. 2020 Sep 2:10:1656.
doi: 10.3389/fonc.2020.01656. eCollection 2020.

Abnormal Ferroptosis in Myelodysplastic Syndrome

Affiliations

Abnormal Ferroptosis in Myelodysplastic Syndrome

Qi Lv et al. Front Oncol. .

Abstract

Background: Ferroptosis is a form of iron-dependent non-apoptotic cell death, with characteristics of loss of the activity of the lipid repair enzyme, glutathione (GSH) peroxidase 4 (GPX4), and accumulation of lethal reactive lipid oxygen species. The mechanism of ferroptosis in myelodysplastic syndrome (MDS) is unclear.

Methods: Cell viability assay, reactive oxygen species (ROS) assay, GSH assay, and GPX activity assay were performed to study the regulation of ferroptosis in MDS cells obtained from MDS patients, the iron overload model mice, and cell lines.

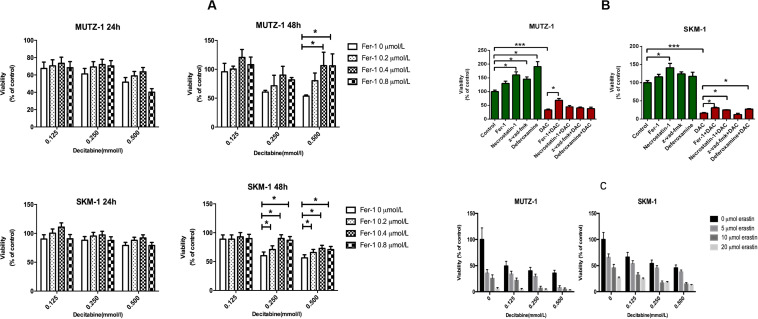
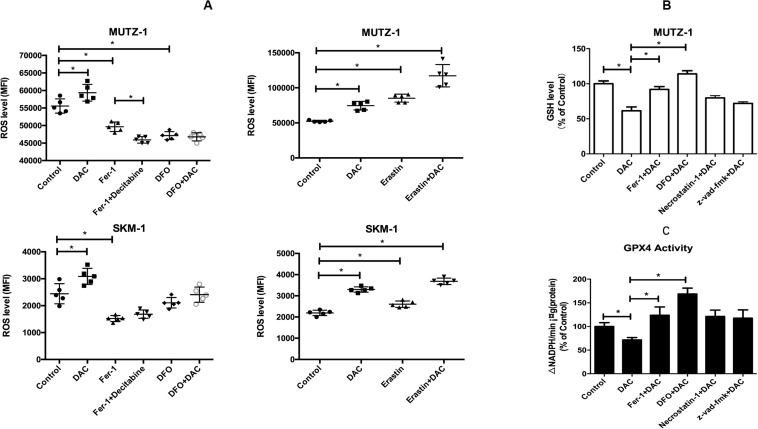
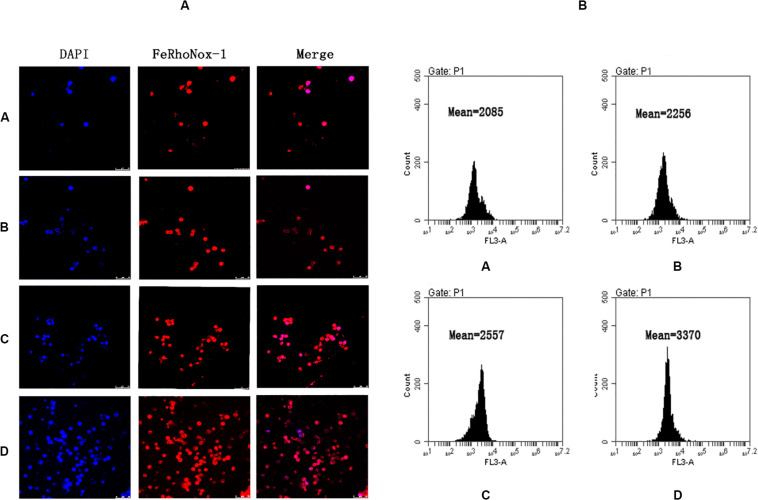
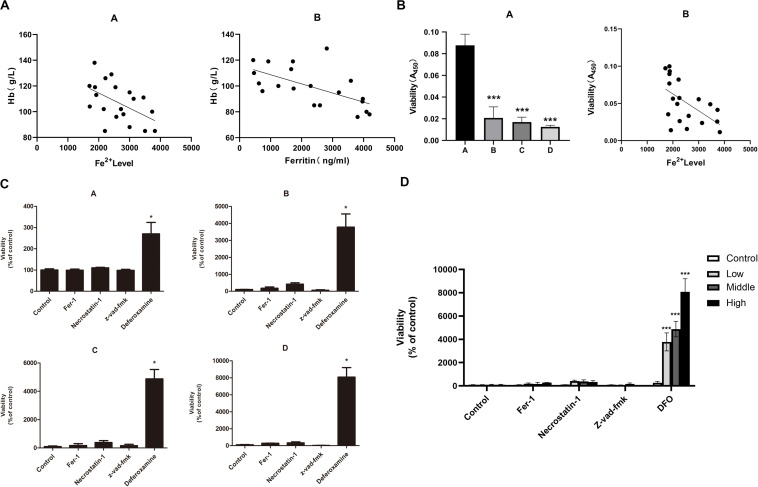
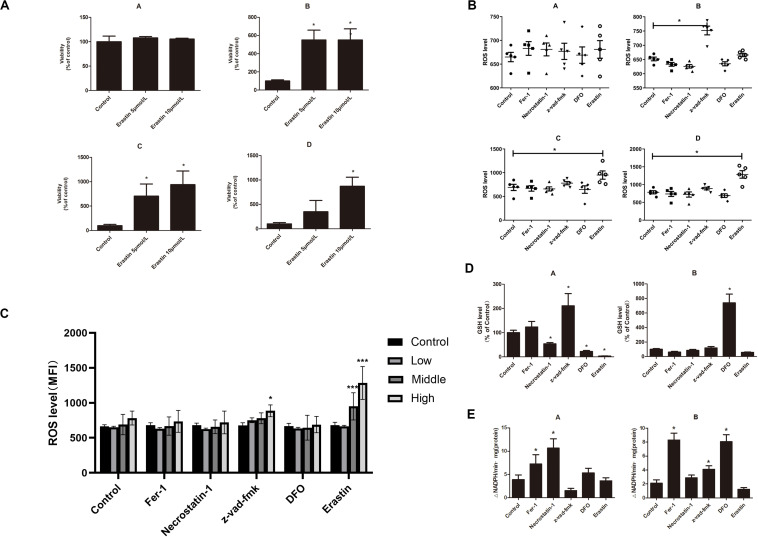
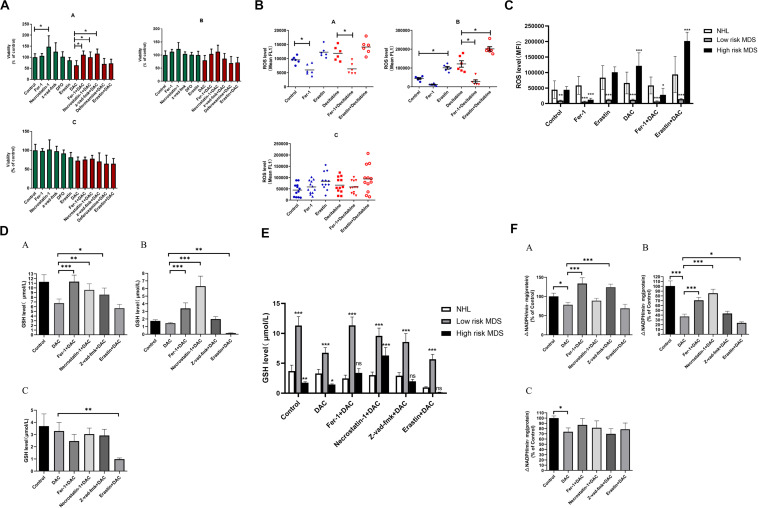
Results: The growth-inhibitory effect of decitabine could be partially reversed by ferrostatin-1 and iron-chelating agent [desferrioxamine (DFO)] in MDS cell lines. Erastin could increase the cytotoxicity of decitabine on MDS cells. The level of GSH and the activity of GPX4 decreased, whereas the ROS level increased in MDS cells upon treatment with decitabine, which could be reversed by ferrostatin-1. The concentration of hemoglobin in peripheral blood of iron overload mice was negatively correlated with intracellular Fe2+ level and ferritin concentration. Iron overload (IO) led to decreased viability of bone marrow mononuclear cells (BMMNCs), which was negatively correlated with intracellular Fe2+ level. Ferrostatin-1 partially reversed the decline of cell viability in IO groups. The level of GSH and the activity of GPX4 decreased, whereas the ROS level increased in BMMNCs of IO mice. DFO could increase the level of GSH. Ferrostatin-1 and DFO could increase the GPX4 activity of BMMNCs in IO mice. Ferrostatin-1 could significantly reverse the growth-inhibitory effect of decitabine in MDS patients. Decitabine could significantly increase the ROS level in MDS groups, which could be inhibited by ferrostatin-1 or promoted by erastin. Ferrostatin-1 could significantly reverse the inhibitory effect of decitabine on GSH levels in MDS patients. Erastin combined with decitabine could further reduce the GSH level. Erastin could further decrease the activity of GPX4 compared with the decitabine group.

Conclusion: Ferroptosis may account for the main mechanisms of how decitabine induced death of MDS cells. Decitabine-induced ROS raise leads to ferroptosis in MDS cells by decreasing GSH level and GPX4 activity.

Keywords: apoptosis; decitabine; ferroptosis; myelodysplastic syndrome; pyroptosis.


Figures

FIGURE 1
FIGURE 1
Decitabine induces ferroptosis in myelodysplastic syndrome cells and its mechanism. (A) Ferroptosis induced by decitabine under different concentrations and duration. CCK-8 assay of cell viability in MUTZ-1 and SKM-1 cell lines. Data are mean ± SE; n = 5. *P < 0.05 by ANOVA/Bonferroni. ANOVA, analysis of variance; SE, standard error. (B) Effects of different inhibitors on cytotoxicity of decitabine. CCK-8 assay of cell viability in MUTZ-1 and SKM-1 cell lines. DAC, 0.5 mM; Fer-1, 0.4 μM; necrostatin-1, 30 μM; Z-VAD-FMK, 20 μM; and deferoxamine, 50 μM. Data are mean ± SE; n = 5. *P < 0.05, by ANOVA/Bonferroni. ANOVA, analysis of variance; DAC, decitabine; and SE, standard error. (C) Erastin enhances the inhibitory effect of decitabine on MDS cell lines. CCK-8 assay of cell viability in MUTZ-1 and SKM-1 cell lines. Data are mean ± SE; n = 5. ***P < 0.001.
FIGURE 2
FIGURE 2
Mechanism of decitabine in inducing ferroptosis. (A) Effect of decitabine on intracellular ROS level in MUTZ-1 and SKM-1 cell lines by flow cytometry. Decitabine, 100 nM; Fer-1, 0.4 μM; necrostatin-1, 30 μM; Z-VAD-FMK, 20 μM; DFO, 50 μM; and erastin, 10 μM. Mean, mean fluorescence intensity (MFI). (B) Effect of decitabine on GSH level in MDS cells. GSH and GSSG assay of GSH level in the MUTZ-1 cell line. Decitabine, 0.5 mM; Fer-1, 0.4 μM; and DFO, 50 μM. Data are mean ± SE; n = 3. *P < 0.05 by ANOVA/Bonferroni. ANOVA, analysis of variance; DAC, decitabine; and SE, standard error. (C) Effect of decitabine on GPXs activity in MDS cells. Cellular glutathione peroxidase assay of GPXs activity in the MUTZ-1 cell line. DAC, 0.5 mM; Fer-1, 0.4 μM; GSH, 1 mM; necrostatin-1, 30 μM; and Z-VAD-FMK, 20 μM. Data are mean ± SE; n = 3. *P < 0.05 by ANOVA/Bonferroni. ANOVA, analysis of variance; SE, standard error.
FIGURE 3
FIGURE 3
Establishment of a mouse model of iron overload. (A) Intracellular ferrous ions in BMMNCs by fluorescence microscopy. FeRhoNox-1 was used to detect the intracellular ferrous ions by fluorescence microscopy in BMMNCs. FeRhoNox-1, an activatable fluorescent probe that specifically detects labile Fe2+ ions via orange (red) fluorescence, 5 μM. DAPI, 4,6-diamidino-2-phenylindole, a blue fluorescent nucleic acid stain that preferentially stains double-stranded DNA (dsDNA). BMMNCs, bone marrow mononuclear cells. A, control group; B, low-dose iron group; C, middle-dose iron group; and D, high-dose iron group. (B) Amount of intracellular ferrous ions in BMMNCs by flow cytometry. Flow cytometry was used to detect the intracellular ferrous ions in BMMNCs of four groups, quantitatively. A, control group; B, low-dose iron group; C, middle-dose iron group; and D, high-dose iron group. Mean, mean fluorescence intensity (MFI).
FIGURE 4
FIGURE 4
(A) Correlation between the degree of anemia and iron overload in mice. A, correlation between hemoglobin concentration and intracellular Fe2+ level. r2 = 0.2996, and P < 0.05 by linear regression. B, correlation between hemoglobin concentration and ferritin concentration in mice. r2 = 0.3274, P < 0.05 by linear regression. (B) Correlation between the cell viability of BMMNCs and iron overload. A, CCK-8 assay of cell viability in four groups. A, control group; B, low-dose iron group; C, middle-dose iron group; and D, high-dose iron group. Data are mean ± SE; n = 3. *P < 0.05 by ANOVA/Bonferroni compared with the control group. ANOVA, analysis of variance; SE, standard error. B, correlation between the cell viability of BMMNCs and the level of Fe2+ in mice. r2 = 0.3117, P < 0.05 by linear regression. (C) Effects of different inhibitors on BMMNCs of mice. CCK-8 assay of cell viability of four groups. A, control group; B, low-dose iron group; C, middle-dose iron group; and D, high-dose iron group. Fer-1, 0.4 μM; necrostatin-1, 30 μM; Z-VAD-FMK, 20 μM; and deferoxamine, 50 μM. Data are mean ± SE; n = 4. *P < 0.05, by ANOVA/Bonferroni compared with the control. ANOVA, analysis of variance; SE, standard error. (D) The comparison of cell viability among four groups of BMMNCs. ***P < 0.001 by ANOVA/Bonferroni compared with the control group. ANOVA, analysis of variance.
FIGURE 5
FIGURE 5
(A) Effects of erastin on BMMNCs of mice. CCK-8 assay of cell viability of four groups. A, control group; B, low-dose iron group; C, middle-dose iron group; and D, high-dose iron group. Data are mean ± SE; n = 3. *P < 0.05 by ANOVA/Bonferroni compared with the control. ANOVA, analysis of variance; SE, standard error. (B) Intracellular ROS level in BMMNCs of mice. Level of ROS in BMMNCs of mice by flow cytometry. A, control group; B, low-dose iron group; C, middle-dose iron group; and D, high-dose iron group. Fer-1, 0.4 μM; necrostatin-1, 30 μM; Z-VAD-FMK, 20 μM; DFO, 50 μM; and erastin, 10 μM. Data are mean fluorescence intensity (MFI) ± SE; n = 3. *P < 0.05 by ANOVA/Bonferroni compared with the control. ANOVA, analysis of variance; SE, standard error. (C) Comparison of intracellular ROS level and GPXs activity in the control group and high-dose iron group. *P < 0.05 by unpaired t-test. MFI, mean fluorescence intensity. (D) GSH level in BMMNCs of mice. GSH levels of the control group and high-dose iron group were detected by GSH and GSSG assay. A, control group; B, high-dose iron group. Fer-1, 0.4 μM; necrostatin-1, 30 μM; Z-VAD-FMK, 20 μM; DFO, 50 μM; and erastin, 10 μM. Data are mean fluorescence intensity (MFI) ± SE; n = 3. *P < 0.05 by ANOVA/Bonferroni compared with the control. ANOVA, analysis of variance; SE, standard error. (E) Activity of GPXs in BMMNCs of mice. Activity of GPXs of the control group and high-dose iron group were detected by cellular glutathione peroxidase assay. A, control group; B, high-dose iron group. Fer-1, 0.4 μM; necrostatin-1, 30 μM; Z-VAD-FMK, 20 μM; DFO, 50 μM; and erastin, 10 μM. Data are mean fluorescence intensity (MFI) ± SE; n = 3. *P < 0.05 by ANOVA/Bonferroni compared with the control. ANOVA, analysis of variance; SE, standard error. ***P < 0.001.
FIGURE 6
FIGURE 6
Decitabine induces ferroptosis in bone marrow mononuclear cells of patients with MDS. (A) Cell viability of patients was detected by CCK-8 assay. A, low-risk MDS patients; B, high-risk MDS patients; and C, lymphoma patients. DAC, 0.5 mM; Fer-1, 0.4 μM; necrostatin-1, 30 μM; Z-VAD-FMK, 20 μM; deferoxamine, 50 μM; and erastin, 10 μM. Data are mean ± SE; n = 3. *P < 0.05, by ANOVA/Bonferroni. ANOVA, analysis of variance; DAC, decitabine; and SE, standard error. (B) Level of ROS in BMMNCs of MDS patients. Level of ROS in BMMNCs of patients by flow cytometry. A, low-risk MDS patients; B, high-risk MDS patients; and C, lymphoma patients. Decitabine, 100 nM; Fer-1, 0.4 μM; and erastin, 10 μM. Data are mean ± SE; n = 3. *P < 0.05 by ANOVA/Bonferroni. ANOVA, analysis of variance; SE, standard error. (C) Comparison of intracellular ROS levels among the three groups of patients. *P < 0.05 by two-way ANOVA/Bonferroni compared with the control group. ANOVA, analysis of variance; MFI, mean fluorescence intensity. (D) Level of GSH in BMMNCs of MDS patients. GSH levels of patients were detected by GSH and GSSG assay. A, low-risk MDS patients; B, high-risk MDS patients; and C, lymphoma patients. DAC, 0.5 mM; Fer-1, 0.4 μM; necrostatin-1, 30 μM; Z-VAD-FMK, 20 μM; and erastin, 10 μM. Data are mean ± SE; n = 3. *P < 0.05 by ANOVA/Bonferroni. ANOVA, analysis of variance; DAC, decitabine, and SE, standard error. (E) Comparison of GSH levels among the three groups of patients. *P < 0.05 by two-way ANOVA/Bonferroni compared with the control group. ANOVA, analysis of variance; ns, no significance. (F) Activity of GPXs in BMMNCs of MDS patients. Cellular glutathione peroxidase assay detected the activity of GPXs of patients. A, low-risk MDS patients; B, high-risk MDS patients; and C, lymphoma patients. DAC, 0.5 mM; Fer-1, 0.4 μM; necrostatin-1, 30 μM; Z-VAD-FMK, 20 μM; and erastin, 10 μM. Data are mean ± SE; n = 3. *P < 0.05 by ANOVA/Bonferroni. ANOVA, analysis of variance; DAC, decitabine; and SE, standard error. **P < 0.01, ***P < 0.001.

Similar articles

Cited by

References

    1. Galluzzi L, Bravo-San Pedro JM, Vitale I, Aaronson SA, Abrams JM, Adam D, et al. Essential versus accessory aspects of cell death: recommendations of the NCCD 2015. Cell Death Differ. (2015) 22:58–73. 10.1038/cdd.2014.137 - DOI - PMC - PubMed
    1. Conrad M, Angeli JPF, Vandenabeele P, Stockwell BR. Regulated necrosis: disease relevance and therapeutic opportunities. Nat Rev Drug Discov. (2016) 15:348–66. 10.1038/nrd.2015.6 - DOI - PMC - PubMed
    1. Galluzzi L, Vitale I, Aaronson SA, Abrams JM, Adam D, Agostinis P, et al. Molecular mechanisms of cell death: recommendations of the Nomenclature Committee on cell death 2018. Cell Death Differ. (2018) 25:486–541. 10.1038/s41418-017-0012-4 - DOI - PMC - PubMed
    1. Dixon SJ, Lemberg KM, Lamprecht MR, Skouta R, Zaitsev EM, Gleason CE, et al. Ferroptosis: an iron-dependent form of nonapoptotic cell death. Cell. (2012) 149:1060–72. 10.1016/j.cell.2012.03.042 - DOI - PMC - PubMed
    1. Dixon SJ, Patel DN, Welsch M, Skouta R, Lee ED, Hayano M, et al. Pharmacological inhibition of cystine-glutamate exchange induces endoplasmic reticulum stress and ferroptosis. eLife. (2014) 3:e02523. 10.7554/eLife.02523 - DOI - PMC - PubMed