

Efavirenz and Lopinavir/Ritonavir Alter Cell Cycle Regulation in Lung Cancer
- PMID: 32984047
- PMCID: PMC7484481
- DOI: 10.3389/fonc.2020.01693
Efavirenz and Lopinavir/Ritonavir Alter Cell Cycle Regulation in Lung Cancer
Abstract
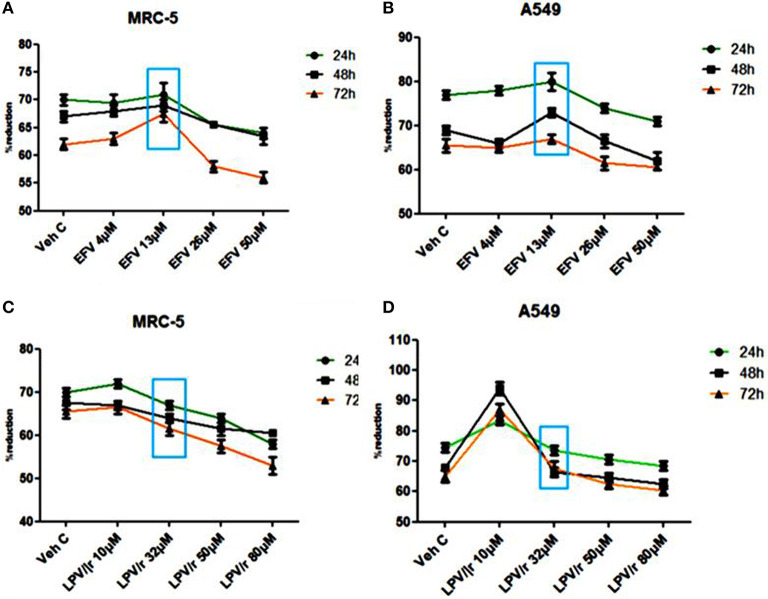
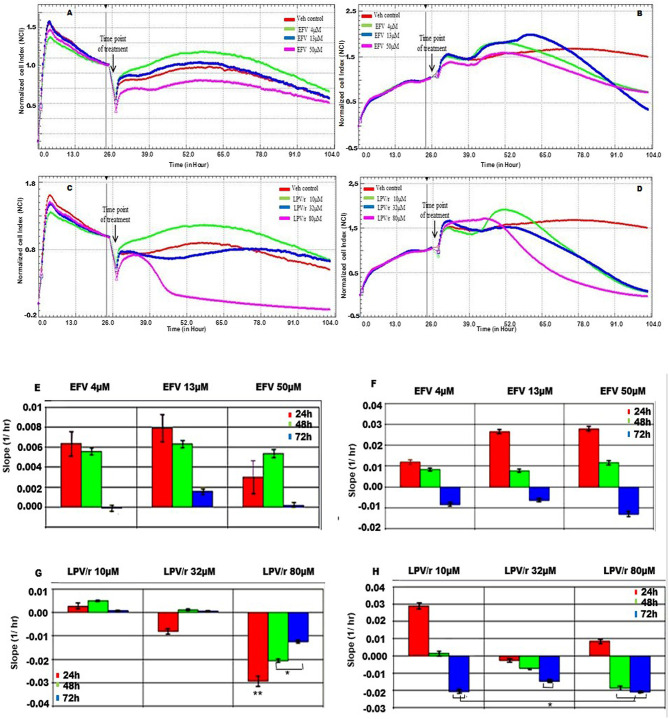
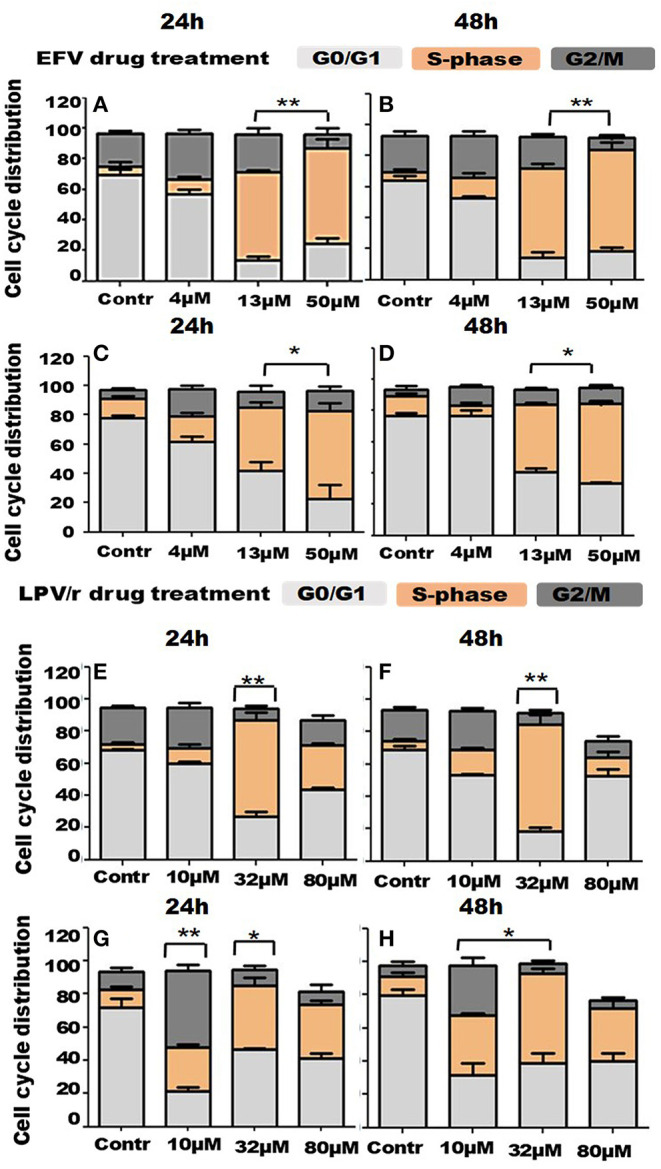
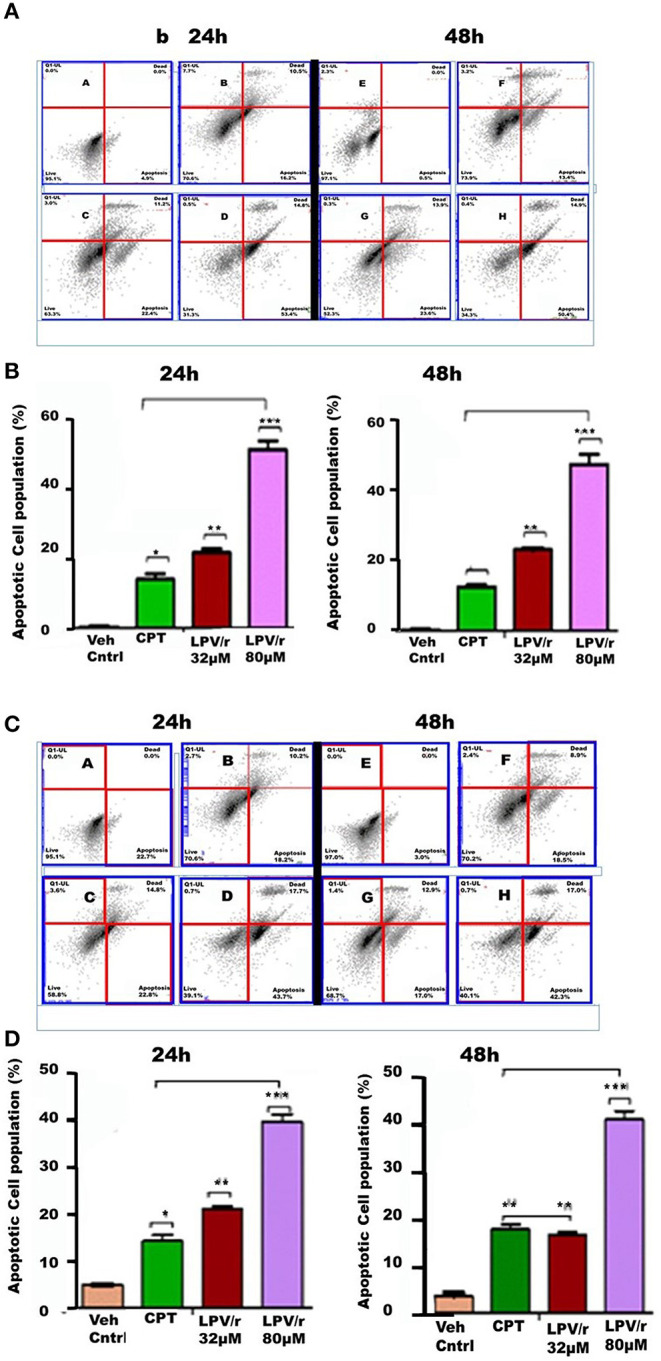
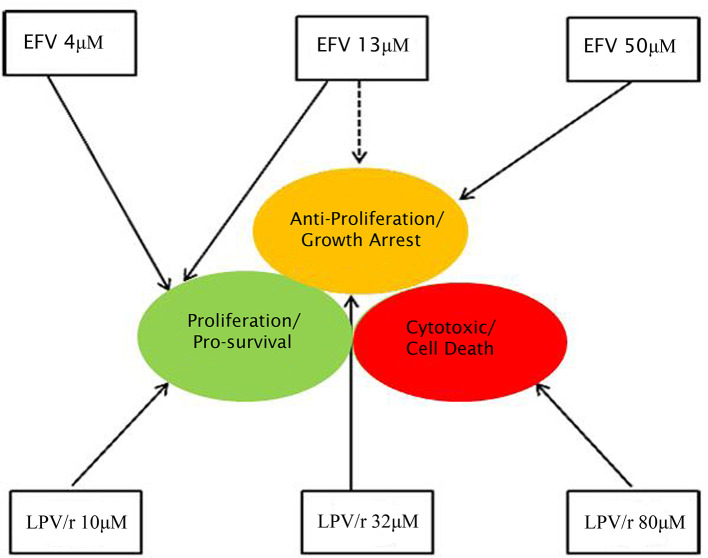
Highly active anti-retroviral treatment (HAART) is currently the most effective treatment for HIV/AIDS. Additionally, HIV positive patients receiving HAART have a better health-related quality of life (HRQoL). Cancers previously associated with HIV/AIDS also known as the AIDS defining cancers (ADCs), such as Kaposi's sarcoma and non-Hodgkin's lymphoma have been on the decline since the introduction of HAART. However, non-AIDS defining cancers (NADCs), in particular, lung cancers have been documented to be on the rise. The association between the use of HAART components and lung carcinogenesis is poorly understood. This study aimed at elucidating the effects of two HAART components [efavirenz (EFV), and lopinavir/ritonavir (LPV/r)] on lung cancer. This was achieved through the use of in vitro cell biological approaches to assess cell health, including cell viability, Real Time Cell Analysis (RTCA) growth monitoring, evaluation of the cell cycle, and progression to apoptosis, following on drug treatments. At plasma level concentrations, both EFV and LPV/r induced S-phase arrest, while at lower concentrations both drugs promoted the progression of cells into G2/M phase following cell cycle FACS analysis. At higher concentrations although cell viability assays reflected anti-proliferative effects of the drugs, this was not statistically significant. RTCA showed a significant decline in cell viability in response to the highest dose of LPV/r. Dual staining by Annexin V-FITC and PI confirmed significant pro-apoptotic effects were promoted by LPV/r. Both EFV and LPV/r exert double-edged oncogenic effects on MRC-5 and A549 lung cells, acting to either promote cell proliferation or to enhance apoptosis. This is affected by EFV and LPV/r altering cell cycle progression, with a significant S-phase arrest, this being an indication of cellular stress, cytotoxicity, and DNA damage within the cell.
Keywords: cell cycle; cell death; cell proliferation; efavirenz; lopinavir/ritonavir; lung cancer; real-time cell analysis.
Copyright © 2020 Marima, Hull, Dlamini and Penny.
Figures
Similar articles
-
The dual protease inhibitor lopinavir/ritonavir (LPV/r) exerts genotoxic stress on lung cells.Biomed Pharmacother. 2020 Dec;132:110829. doi: 10.1016/j.biopha.2020.110829. Epub 2020 Oct 12. Biomed Pharmacother. 2020. PMID: 33059259
-
Efavirenz and ritonavir-boosted lopinavir use exhibited elevated markers of atherosclerosis across age groups in people living with HIV in Ethiopia.J Biomech. 2016 Sep 6;49(13):2584-2592. doi: 10.1016/j.jbiomech.2016.05.018. Epub 2016 May 21. J Biomech. 2016. PMID: 27270208
-
Efavirenz-based simplification after successful early lopinavir-boosted-ritonavir-based therapy in HIV-infected children in Burkina Faso and Côte d'Ivoire: the MONOD ANRS 12206 non-inferiority randomised trial.BMC Med. 2017 Apr 24;15(1):85. doi: 10.1186/s12916-017-0842-4. BMC Med. 2017. PMID: 28434406 Free PMC article. Clinical Trial.
-
Lopinavir/ritonavir: a protease inhibitor for HIV-1 treatment.Expert Opin Pharmacother. 2008 Sep;9(13):2363-75. doi: 10.1517/14656566.9.13.2363. Expert Opin Pharmacother. 2008. PMID: 18710360 Review.
-
[Lopinavir/ritonavir in patients with human immunodeficiency virus infection in special situations].Enferm Infecc Microbiol Clin. 2014 Nov;32 Suppl 3:18-21. doi: 10.1016/S0213-005X(14)70163-6. Enferm Infecc Microbiol Clin. 2014. PMID: 25542871 Review. Spanish.
Cited by
-
Lopinavir enhances anoikis by remodeling autophagy in a circRNA-dependent manner.Autophagy. 2024 Jul;20(7):1651-1672. doi: 10.1080/15548627.2024.2325304. Epub 2024 Mar 8. Autophagy. 2024. PMID: 38433354 Free PMC article.
-
Putative COVID-19 therapies imatinib, lopinavir, ritonavir, and ivermectin cause hair cell damage: A targeted screen in the zebrafish lateral line.Front Cell Neurosci. 2022 Aug 24;16:941031. doi: 10.3389/fncel.2022.941031. eCollection 2022. Front Cell Neurosci. 2022. PMID: 36090793 Free PMC article.
-
Drug repurposing screen targeting PARP identifies cytotoxic activity of efavirenz in high-grade serous ovarian cancer.Mol Ther Oncol. 2024 Nov 23;32(4):200911. doi: 10.1016/j.omton.2024.200911. eCollection 2024 Dec 19. Mol Ther Oncol. 2024. PMID: 39802157 Free PMC article.
-
Drug Repurposing in Non-Small Cell Lung Carcinoma: Old Solutions for New Problems.Curr Oncol. 2023 Jan 5;30(1):704-719. doi: 10.3390/curroncol30010055. Curr Oncol. 2023. PMID: 36661704 Free PMC article. Review.
-
Efavirenz: History, Development and Future.Biomolecules. 2022 Dec 31;13(1):88. doi: 10.3390/biom13010088. Biomolecules. 2022. PMID: 36671473 Free PMC article. Review.
References
-
- Hiv UG. AIDS Statistics−2018 Fact Sheet. Gauteng: (2019).
LinkOut - more resources
Full Text Sources
Research Materials
Miscellaneous