. 2020 Sep 2:10:458.
doi: 10.3389/fcimb.2020.00458. eCollection 2020.

16S Metagenomics Reveals Dysbiosis of Nasal Core Microbiota in Children With Chronic Nasal Inflammation: Role of Adenoid Hypertrophy and Allergic Rhinitis

Affiliations

16S Metagenomics Reveals Dysbiosis of Nasal Core Microbiota in Children With Chronic Nasal Inflammation: Role of Adenoid Hypertrophy and Allergic Rhinitis

Massimiliano Marazzato et al. Front Cell Infect Microbiol. .

Abstract

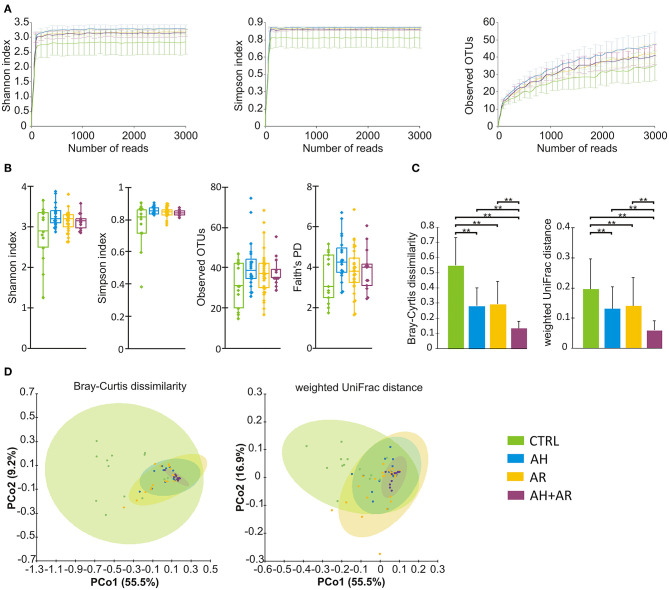
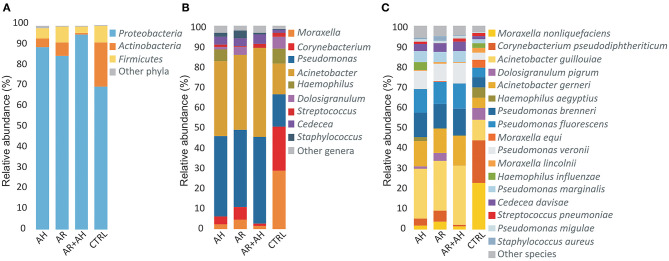
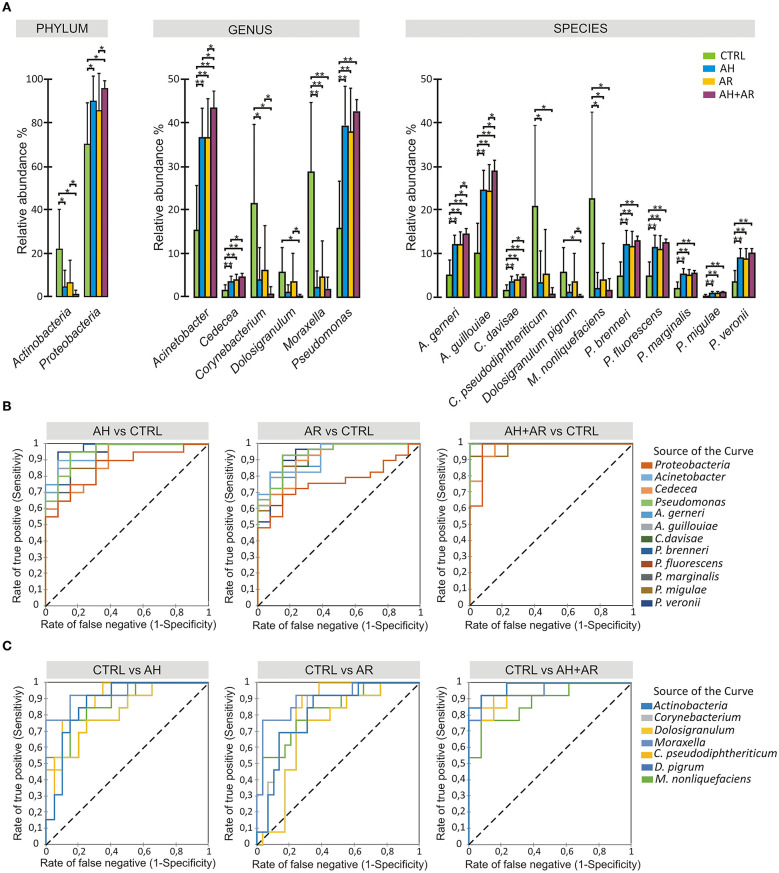
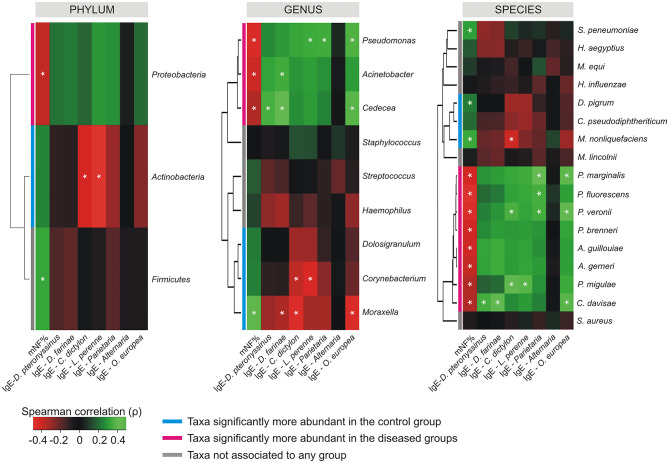
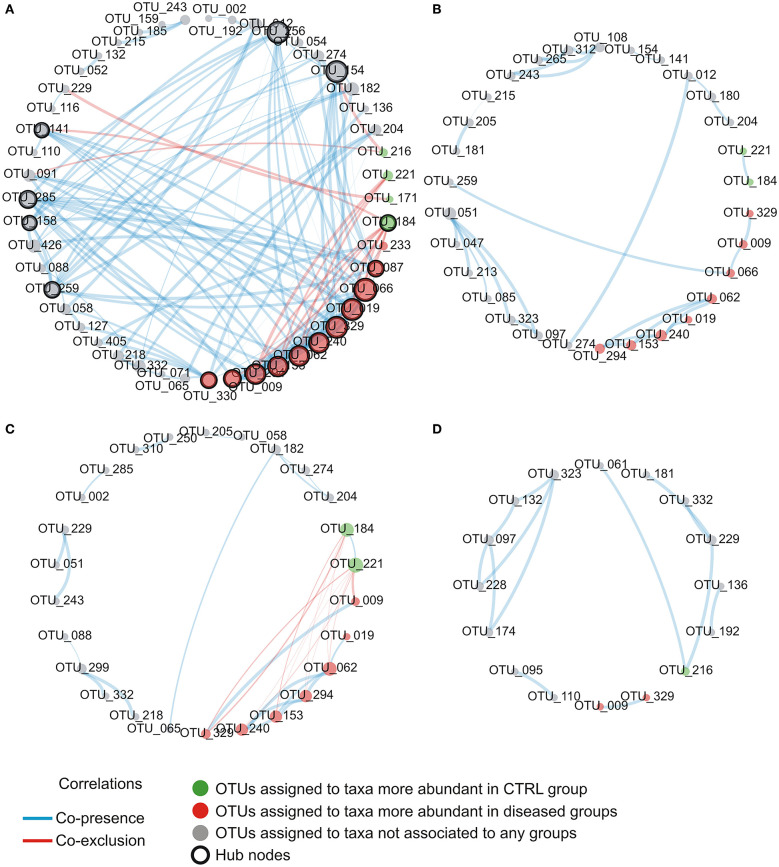
Allergic rhinitis (AR) and adenoid hypertrophy (AH) are, in children, the main cause of partial or complete upper airway obstruction and reduction in airflow. However, limited data exist about the impact of the increased resistance to airflow, on the nasal microbial composition of children with AR end AH. Allergic rhinitis (AR) as well as adenoid hypertrophy (AH), represent extremely common pathologies in this population. Their known inflammatory obstruction is amplified when both pathologies coexist. In our study, the microbiota of anterior nares of 75 pediatric subjects with AR, AH or both conditions, was explored by 16S rRNA-based metagenomic approach. Our data show for the first time, that in children, the inflammatory state is associated to similar changes in the microbiota composition of AR and AH subjects respect to the healthy condition. Together with such alterations, we observed a reduced variability in the between-subject biodiversity on the other hand, these same alterations resulted amplified by the nasal obstruction that could constitute a secondary risk factor for dysbiosis. Significant differences in the relative abundance of specific microbial groups were found between diseased phenotypes and the controls. Most of these taxa belonged to a stable and quantitatively dominating component of the nasal microbiota and showed marked potentials in discriminating the controls from diseased subjects. A pauperization of the nasal microbial network was observed in diseased status in respect to the number of involved taxa and connectivity. Finally, while stable co-occurrence relationships were observed within both control- and diseases-associated microbial groups, only negative correlations were present between them, suggesting that microbial subgroups potentially act as maintainer of the eubiosis state in the nasal ecosystem. In the nasal ecosystem, inflammation-associated shifts seem to impact the more intimate component of the microbiota rather than representing the mere loss of microbial diversity. The discriminatory potential showed by differentially abundant taxa provide a starting point for future research with the potential to improve patient outcomes. Overall, our results underline the association of AH and AR with the impairment of the microbial interplay leading to unbalanced ecosystems.

Keywords: adenoid hypertrophy; allergic rhinitis; chronic inflammation; core microbiota; nasal microbiota.


Figures

Figure 1
Figure 1
Microbiota diversity analysis. (A) Color coded rarefaction curves. For each group, the average values of α-diversity indexes with 95% confidence intervals were reported at different sequencing depth (B) box plots showing α-diversity estimators, measured for each groups. (C) Barplots relative to the intra-group distribution of the considered β-diversity estimators among groups. Data are expressed as mean ± SD while the presence of statistically significant differences was determined by Kruskal-Wallis rank sum test followed by pairwise Dunn's post-hoc tests. (D) PCoA plot of bacterial β-diversity based on Bray-Curtis dissimilarity and weighted UniFrac distance according to individual health status. For each group, the 95% confidence interval has been drawn. Numbers between parenthesis represents the percentage of the total variance explained by the principal coordinates. Where needed, the computed p-values were corrected by using the FDR procedure to take into account for multiple comparisons. A p-value ≤ 0.05 was considered statistically significant. **p < 0.0001.
Figure 2
Figure 2
Color-coded barplots showing the average distribution of bacterial taxa at (A) phylum, (B) genus, and (C) species levels across different phenotypes. Only taxa for which a mean relative abundance = 1% was determined in at least one group, were reported in plots. Taxa were sorted respect to the descending order of the mean relative abundances in the CTRL group.
Figure 3
Figure 3
Differential abundance analysis and diagnostic power of most abundant taxa. (A) Color-coded barplots showing differential abundance analysis at phylum, genus and species levels performed by Kruskal-Wallis test followed by Games-Howell post hoc tests with Benjamini-Hochberg FDR correction to account for multiple comparisons. Only taxa showing significant differences among groups and for which a mean relative abundance ≥1% was determined in at least one group, are shown in plots. Values are expressed as mean ± SD. (B) ROC curve plots for taxa differentially abundant in diseased groups and in (C) control subjects. The areas under the ROC curves represent the specificity and sensitivity of the selected taxa able to discriminate AH, AR and AH+AR phenotypes from the control group. Dotted line represents the AUC = 0.5 (random classifier). *p ≤ 0.05; *p ≤ 0.001.
Figure 4
Figure 4
Cross-correlation heatmaps based on Spearman's correlation coefficients computed between the relative abundance of taxa ≥1% in at least one group and the values observed for mNF% and antigen-specific serum IgE across the whole population of studied subjects. The color scale represents values assumed by the Spearman's correlation coefficient (ρ) with green and red for positive and negative correlations, respectively. Taxa were ordered according to hierarchical simple-linkage clustering based on Spearman's coefficients computed on relative abundances (dendrogram on the left). The color coded bar indicates the differential association of taxa to groups according to results produced by the differential abundance analysis. A white asterisk indicates significant correlation at α level 0.05 after FDR correction for multiple comparisons.
Figure 5
Figure 5
Intra-community network analysis taking into account OTUs presenting a mean relative abundance ≥0.01% across the whole population of samples. (A) CTRL, (B) AH, (C) AR, (D) AH+AR. The size of each node is proportional to the number of edges departing from it while the edge thickness is proportional to the strength of correlations.
Figure 6
Figure 6
Results of LEfSe method performed on the relative abundances of KEGG pathways at L2 level obtained by reconstructing metagenomes with the PICRUSt algorithm. Pairwise comparisons were performed separately between each diseased groups and the control one. A FDR adjusted p-value ≤ 0.05, as well as an LDA score ≥3, were used as thresholds to identify significant features.

Similar articles

Cited by

References

    1. Abreu N. A., Nagalingam N. A., Song Y., Roediger F. C., Pletcher S. D., Goldberg A. N., et al. . (2012). Sinus microbiome diversity depletion and Corynebacterium tuberculostearicum enrichment mediates rhinosinusitis. Sci. Transl. Med. 4:151ra124. 10.1126/scitranslmed.3003783 - DOI - PMC - PubMed
    1. Aguirre de Cárcer D. (2018). The human gut pan-microbiome presents a compositional core formed by discrete phylogenetic units. Sci. Rep. 8:14069. 10.1038/s41598-018-32221-8 - DOI - PMC - PubMed
    1. Ballikaya E., Dogan B. G., Onay O., Tekcice M. U. (2018). Oral health status of children with mouth breathing due to adenotonsillar hypertrophy. Int. J. Pediatr. Otorhinolaryngol. 113, 11–15. 10.1016/j.ijporl.2018.07.018 - DOI - PubMed
    1. Beiko R. G. (2015). Microbial malaise: how can we classify the microbiome? Trends Microbiol. 23, 671–679. 10.1016/j.tim.2015.08.009 - DOI - PubMed
    1. Biesbroek G., Tsivtsivadze E., Sanders E. A., Montijn R., Veenhoven R. H., Keijser B. J. F., et al. . (2014). Early respiratory microbiota composition determines bacterial succession patterns and respiratory health in children. Am. J. Respir. Crit. Care Med. 190, 1283–1292. 10.1164/rccm.201407-1240OC - DOI - PubMed

Publication types

Substances