. 2020 Aug 27:8:912.
doi: 10.3389/fbioe.2020.00912. eCollection 2020.

Calcium Dynamics in Astrocytes During Cell Injury

Affiliations

Calcium Dynamics in Astrocytes During Cell Injury

Nicole M Wakida et al. Front Bioeng Biotechnol. .

Abstract

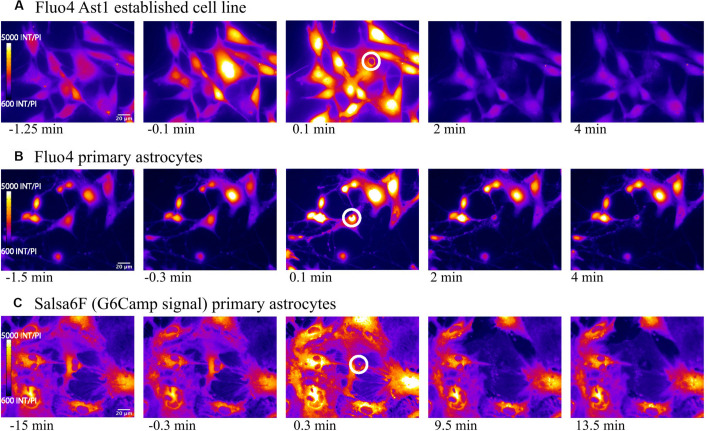
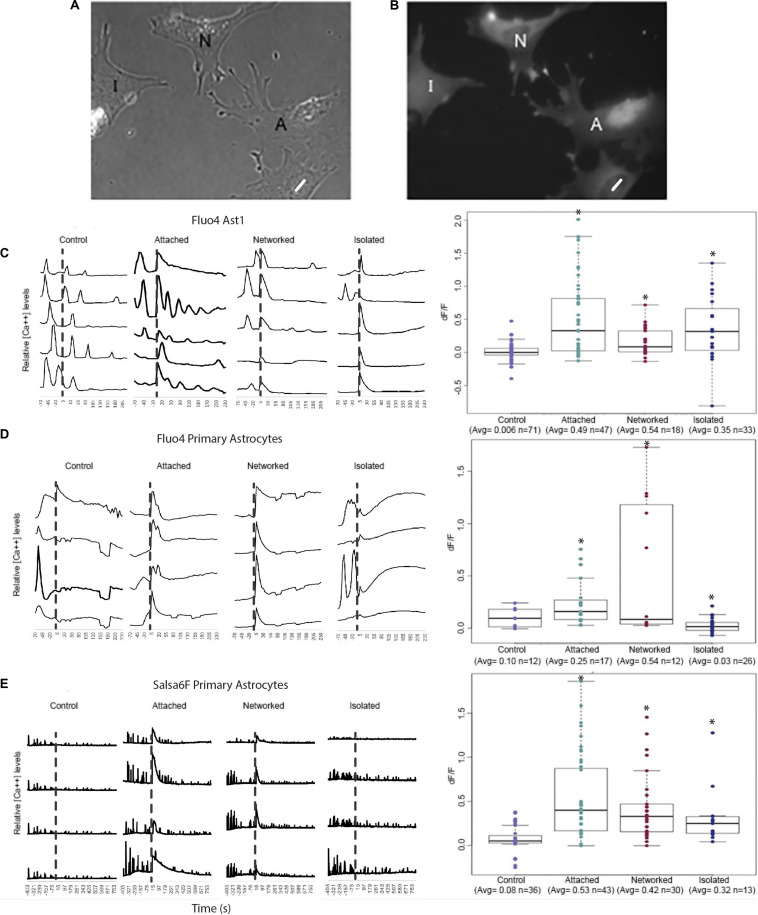
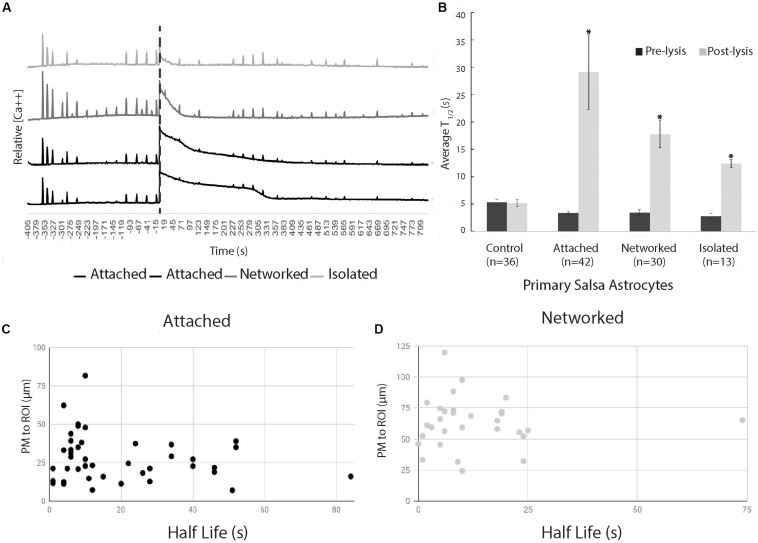
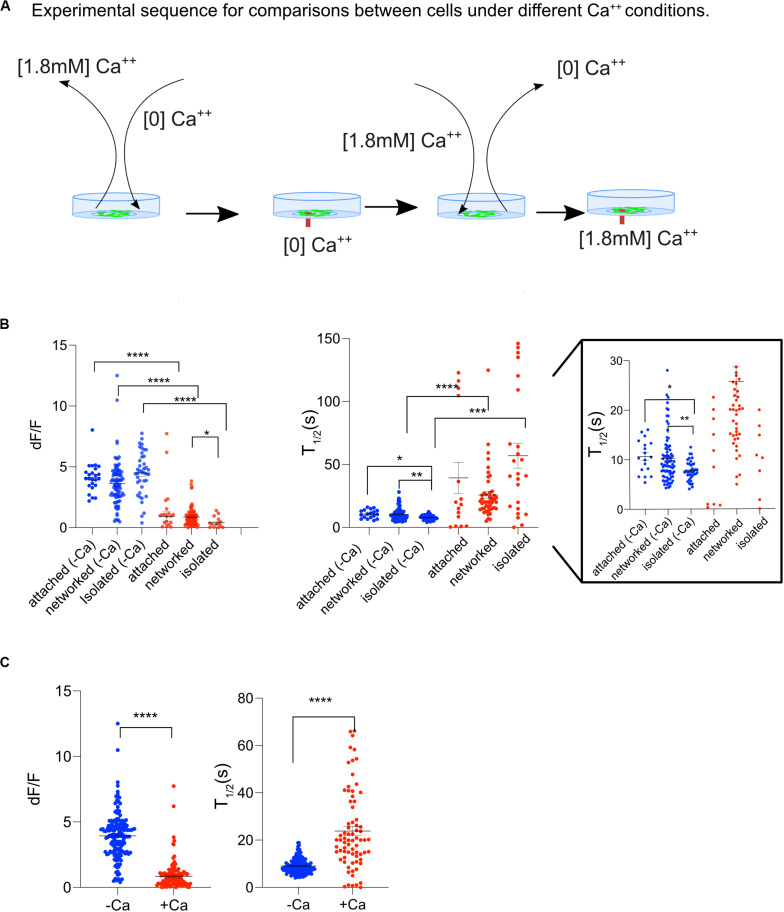
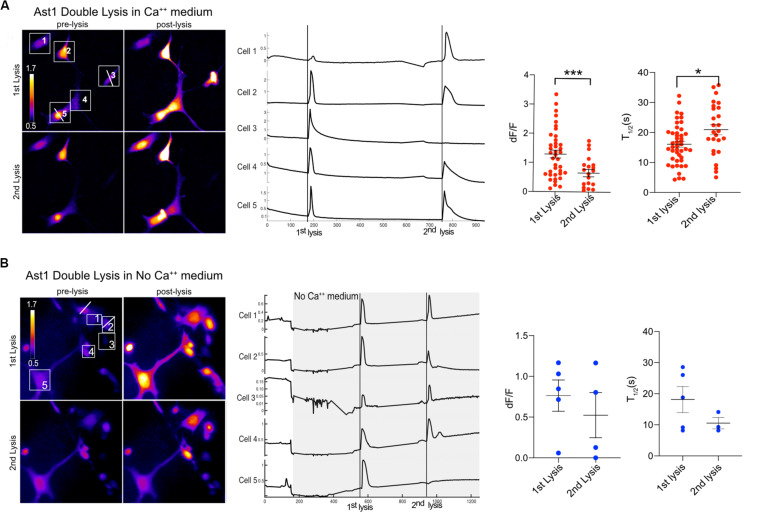
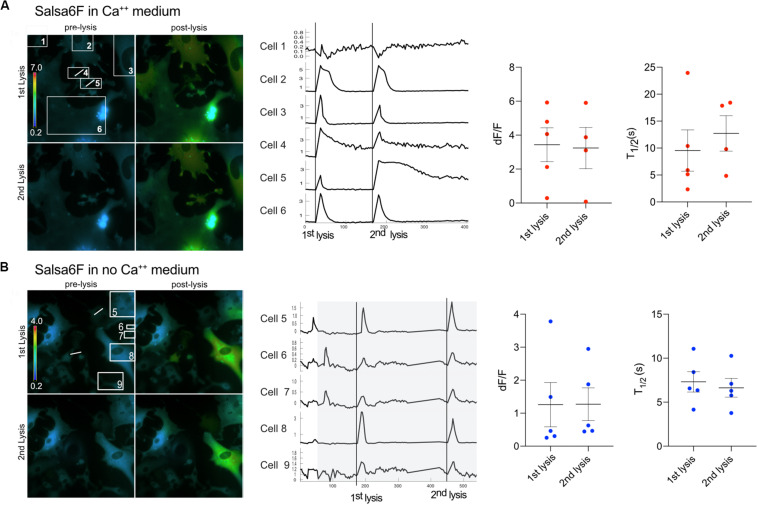
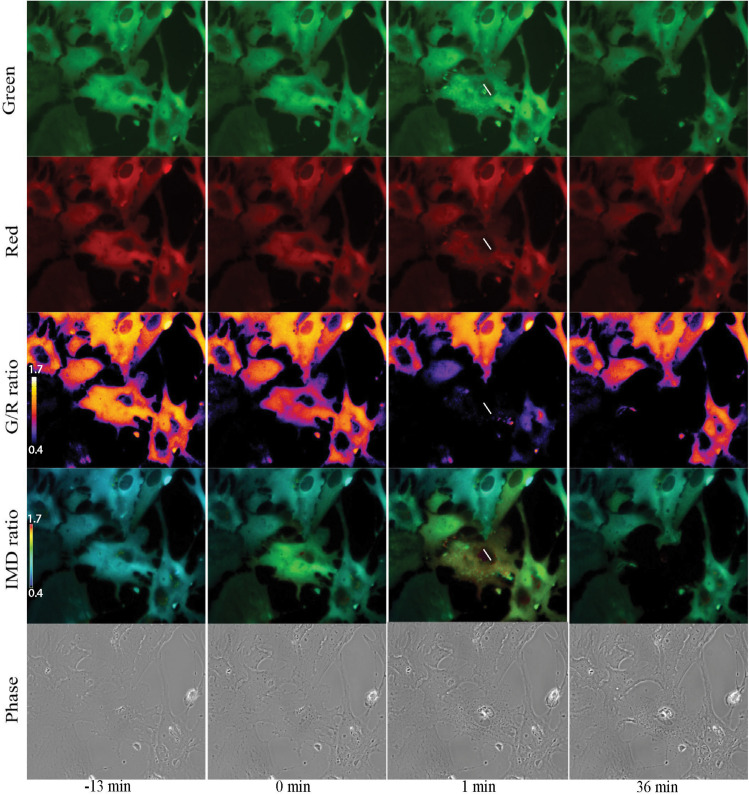
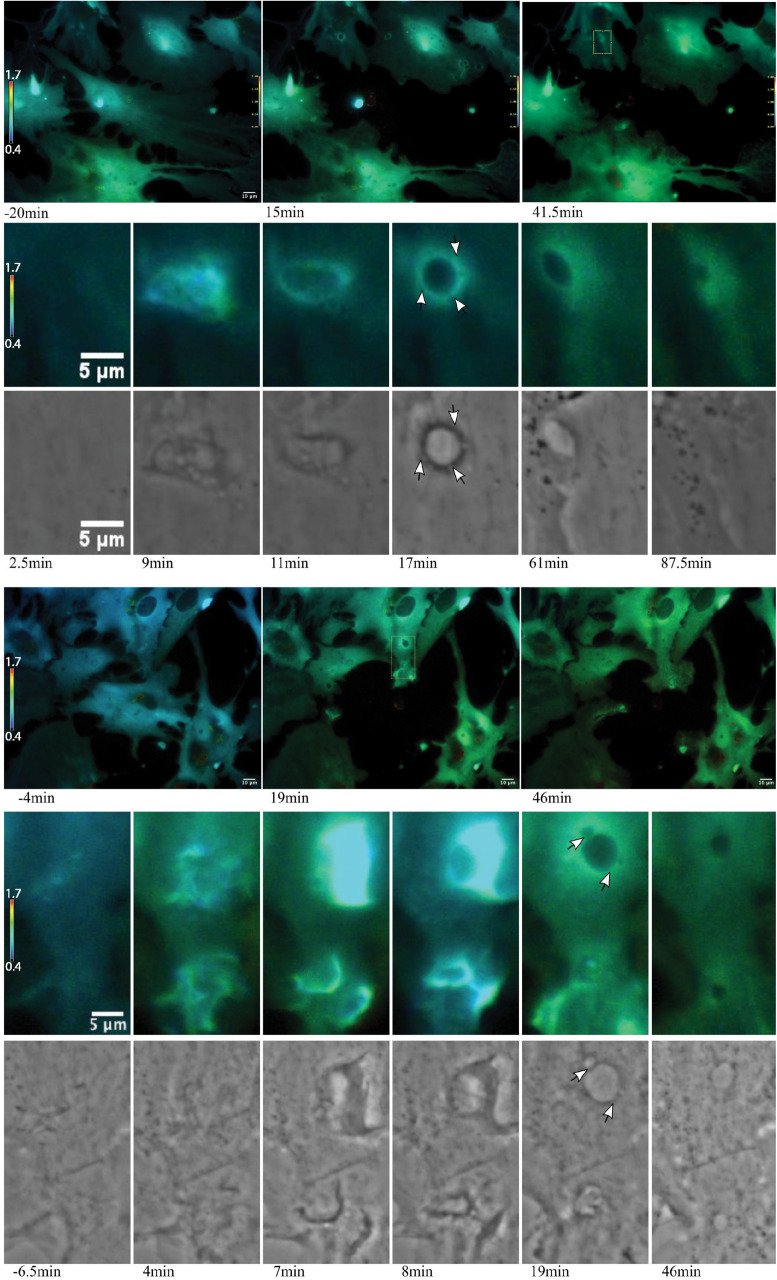
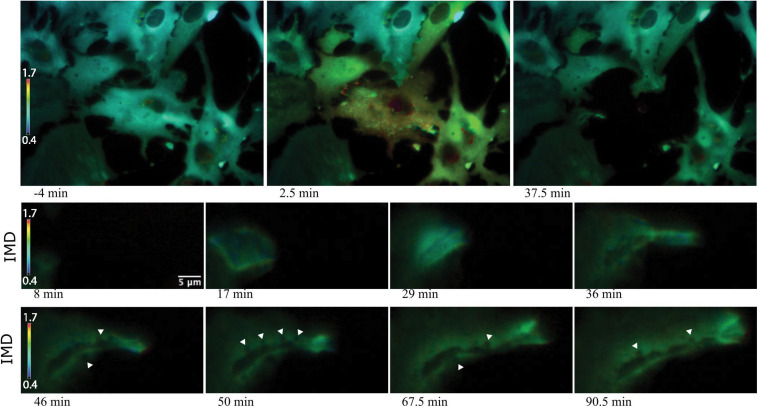
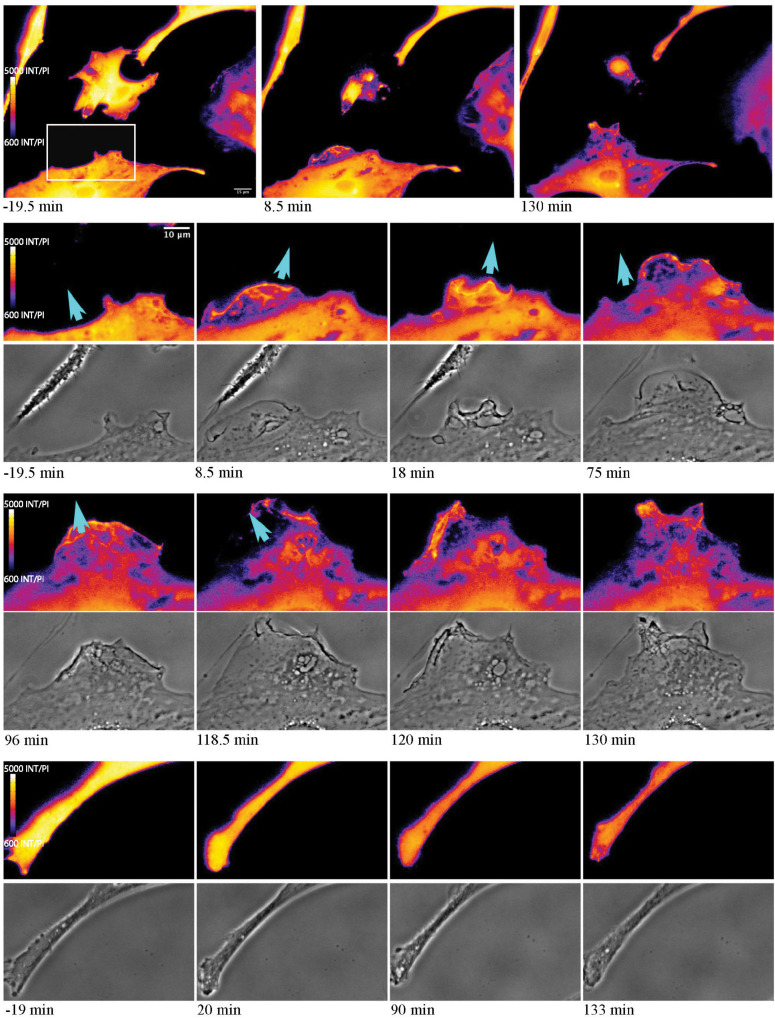
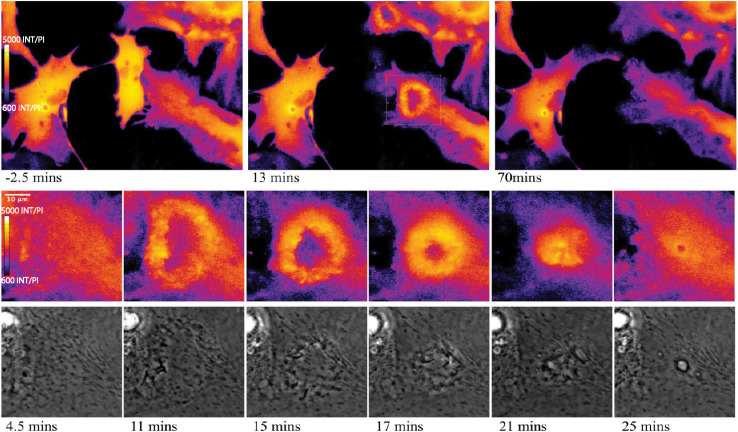
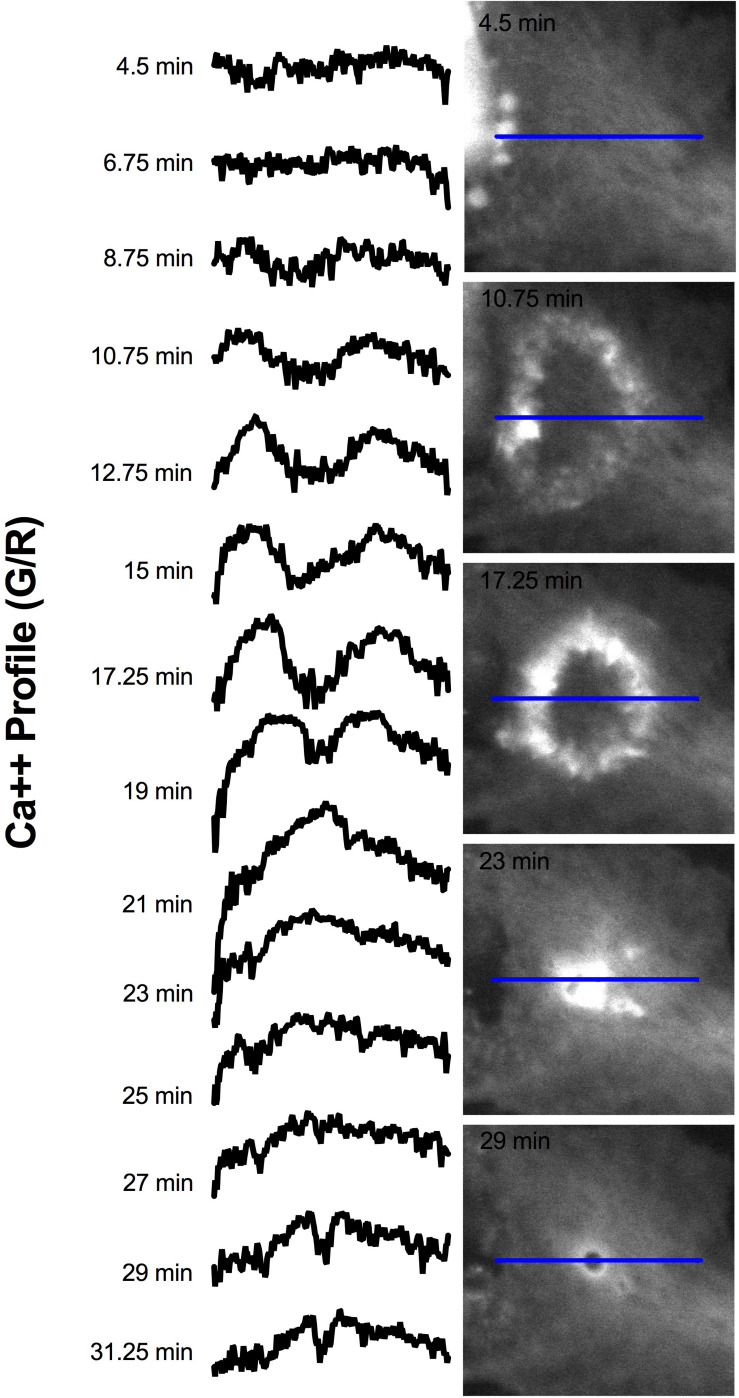
The changes in intracellular calcium concentration ([Ca2+]) following laser-induced cell injury in nearby cells were studied in primary mouse astrocytes selectively expressing the Ca2+ sensitive GFAP-Cre Salsa6f fluorescent tandem protein, in an Ast1 astrocyte cell line, and in primary mouse astrocytes loaded with Fluo4. Astrocytes in these three systems exhibit distinct changes in [Ca2+] following induced death of nearby cells. Changes in [Ca2+] appear to result from release of Ca2+ from intracellular organelles, as opposed to influx from the external medium. Salsa6f expressing astrocytes displayed dynamic Ca2+ changes throughout the phagocytic response, including lamellae protrusion, cytosolic signaling during vesicle formation, vesicle maturation, and vesicle tract formation. Our results demonstrate local changes in [Ca2+] are involved in the process of phagocytosis in astrocytes responding to cell corpses and/or debris.

Keywords: Salsa6f; astrocyte; calcium; laser ablation; laser nanosurgery; phagocytosis; photolysis.


Figures

FIGURE 1
FIGURE 1
Elevated cytosolic Ca2+ signal in response to photolysis. Ca2+ elevation is observed throughout astrocyte networks following photolysis of a central cell, using 2 different Ca2+ indicators, Fluo4 (A) and Salsa6f (B,C). Astrocytes were derived from 2 sources, an established astrocyte line in (A) and mouse primary cortical astrocytes in (B,C). The blue arrow in the third column delineates the laser irradiated region depicted by the white ROI. By 2 min post irradiation, fluorescence in uninjured astrocytes returns to baseline levels observed prior to laser exposure.
FIGURE 2
FIGURE 2
Quantification of Ca2+ elevation within the astrocyte network. Astrocytes were categorized into 4 groups: control, attached, networked, and isolated. (A,B) Phase contrast (A) and corresponding Ca2+ fluorescence signal (B) of a representative group of astrocytes depicting attached (A), networked (N), and isolated (I) astrocytes with respect to photolyzed cell (white ROI). Attached astrocytes shared a membrane with the photolyzed cells, networked cells were indirectly connected to the photolyzed cell, and isolated cells shared no membranous connection with the photolyzed cell. (B–D) Ca2+ signal traces of control, attached, networked, and isolated astrocytes and dF/F in response to photolysis of a neighboring cell. Representative traces are shown for Fluo4 labeled Ast1 cells (C), Fluo4 labeled primary astrocytes (D), and Salsa6f labeled primary astrocytes (E). Control astrocytes did not respond to the laser being fired within an adjacent area vacant of cells, but did show spontaneous Ca2+ spiking throughout the observation period. A significant Ca2+ oscillation is consistently observed throughout the contiguous astrocyte network (attached and networked cells) immediately following the photolysis event, denoted by the dashed vertical line. Isolated astrocytes from the Ast1 cell line also displayed a sharp rise in cytosolic Ca2+, with a significant, but less dramatic rise in primary astrocytes labeled with both Fluo4 and Salsa6f. Box plots of dF/F displaying a value for change in Ca2+ signal in response to photolysis are displayed for each fluorophore/astrocyte combination. All categories (attached, networked, isolated) showed significant increases in dF/F values when compared to control cells, depicted by asterisk () over each column.
FIGURE 3
FIGURE 3
Exponential decay of Ca2+ oscillation following photolysis event. (A) Representative Ca2+ signal traces for 2 attached, 1 networked, and 1 isolated astrocyte labeled with Salsa6f. The large Ca2+ oscillation coinciding with the time of photolysis (depicted by vertical dashed line), diminishes at varying rates dependent on the cell’s relative location to the photolyzed cell. (B) Comparison of average time to 50% decrease from the peak of signal, T1/2, decay of transients before photolysis (Pre-lysis) and Ca2+ oscillation at time 0/photolysis (Post-lysis). Average pre-lysis T1/2 for all cell categories ranged between 2.8 and 5.3 s. Attached astrocytes displayed the longest average for post-lysis T1/2, at 29 s. Networked and isolated categories displayed lower T1/2 average values at 18 and 12 s, respectively. Post-lysis T1/2 for all categories except control had a significantly longer post-lysis T1/2 when compared to pre-lysis T1/2 values, depicted by asterisks. (C,D) Scatter plot of T1/2 vs. distance of responding cell to laser-targeted region for attached (C) and networked (D) astrocytes. We observe no correlation between T1/2 and distance between laser damage (ROI) and closest plasma membrane (PM) of the observed/responding cell for both attached (r2 = 0.033) and networked cells (r2 = 0.00039).
FIGURE 4
FIGURE 4
Ast1 Cells in low Ca2+ medium display a Ca2+ oscillation after single cell photolysis. (A) Sequence of events for experiments shown on this figure. Cells grown in regular DMEM were washed with [0] Ca2+ HBSS and bathed in low Ca2+ DMEM approximately 3 min before placing them on the microscope. A central cell in the field of view was lysed while in low Ca2+ DMEM. The field of view was imaged for 5 min before the medium in the dish was replaced with Ca2+ containing medium. A second lysis event was triggered within a different field of view of the same dish. (B) The dF/F and T1/2 are shown for Ast1. Each dot is representative of a single cell. Cells were separated into attached, networked and isolated categories. Low calcium was abbreviated as –Ca and normal calcium was abbreviated as +Ca. Blue is used to indicate cells in low calcium medium and red is for cells in regular calcium medium. The T1/2 is shown with two different y-axis ranges. The first range is 0–150 s. The same graph is shown on the right with a range of 0–30 s. Asterisks denote significance. *P ≤ 0.05, **P ± 0.01, ***P ± 0.001, ****P ± 0.0001. (C) Combined results from experiments in (B).
FIGURE 5
FIGURE 5
Ast1 cells respond to multiple photolysis events in both Ca2+ and no Ca2+ conditions. (A) Cells in Ca2+ free medium (low Ca2+ + 1 mM EGTA) were loaded with Ca2+ indicator Fluo4. Two cells were sequentially photolyzed within the same field of view. Pseudo color images are shown for the pre and post photolysis. Lysed cells are marked by a white horizontal line ROI through the cell. The numbered ROI have corresponding Ca2+ traces to the right. The vertical line in the traces demarcates the time of photolysis within the traces. In this example, cells 3 and 5 were lysed respectively. Experimental data from different fields were combined to generate the dF/F peak and T1/2 graphs. A t-test shows a significant difference in peak response between the 1st and 2nd lysis. ***P < 0.001. N = 39 for the 1st lysis and n = 20 for the second lysis from combined experiments. A significant difference in T1/2 between the 1st and 2nd lysis was found, *P ± 0.05. (B) Ast1 were perfused with Ca2+ free medium prior to photolysis. The first lysed cell is to the left of cell 1 and was not quantified or numbered. The second lysis occurred on cell 2. The Ca2+ traces of cells in the field of view are displayed, where the gray area represents the period in which cells are in Ca2+ free medium. Perfusion of Ca2+ free medium occurred over a period of 200 s. The fluorescence intensity changes during perfusion are do to the changing focus due to the pressure between the coverslips of the rose chambers. The dF/F and T1/2 values shown correspond to the cells shown in (B) and are not combined with other data.
FIGURE 6
FIGURE 6
Primary Salsa6f astrocytes respond to multiple lysis events. (A) Two cells (4 and 5) were lysed within the field of view shown in the ratiometric images on the left. A white line is drawn across the cell that was photolyzed. Both lysis events lead to cytoplasmic increases within cells in the field of view. Images of the first two lysis events are shown. Where the top row is of the 1st lysis. A pre and post lysis images are shown where the prelysis image contains the regions of interest for each cell. Ca2+ traces are shown to the right of the images. dF/F and T1/2 values are shown for combined data from multiple field of views. (B) Cells were perfused with Ca2+ free medium for a period of 90 s to minimize cell perturbation. The area in gray depicts the period in which cells are in Ca2+ free medium. Cells responded to two lysis events while bathed in Ca2+ free medium.
FIGURE 7
FIGURE 7
Ratiometric imaging of an astrocyte network in response to photolysis. Green GCaMP6f and red tdTomato images directly acquired during fluorescent imaging are displayed in rows 1 and 2. A small increase in green signal intensity is visible 1 min post photolysis. Fluorescence from the photolyzed cell (white roi) diminishes after photolysis, signal is completely absent in the 36 min post image. Ca2+ sensitive green images were divided by Ca2+-insensitive red images, and pseudo colored with LUT fire, displayed in row 3. The corresponding scale to LUT fire is overlaid on the pre-lysis/13 min image where large fluorescence intensity changes are indicated by white pixels, decreasing in color warmth to small intensity changes corresponding to dark blue and black pixels. The central lysed cell (white ROI) loses all fluorescence signal within 1 min or photolysis, changing from orange to black hue. Green/red ratiometric images were also analyzed using intensity modulated display (IMD) ratio, displayed in row 4. IMD ratio images highlight changes of pixel intensities observed in cells attached to the targeted cell 1 min following photolysis. Fluorescence levels return toward pre-lysis levels in the 36 min post photolysis image. Phase contrast images in row 5 show minimal changes in the surrounding astrocyte network in response to the photolyzed central cell. The color scale bars for LUT fire and IMD indicate maximum and minimum brightness (BRT) as 5000 and 600, respectively.
FIGURE 8
FIGURE 8
Ca2+ localization during endocytic vesicle formation and maturation. Two representative networks of astrocytes respond to photolysis via vesicle formation. Rows 1 and 4 display lower magnification images, with the images in column 1 corresponding to before laser irradiation. Two post photolysis images show an overall elevation of Ca2+, with an increase from blue (low Ca2+) to green signal (higher Ca2+) in IMD ratio images. We observe an increased concentration in local Ca2+ at regions of membrane ruffling and surrounding newly formed vesicles. Magnified insets corresponding to regions of vesicle formation are shown in rows 2, 3, 5, and 6. Ca2+ signal localizes to regions surrounding the vesicle during vesicle formation. Smaller vesicles are often visible at vesicle periphery (white arrows in row 6), as well as fusion of these smaller vesicles to form larger vesicles. The signal surrounding the vesicles appears to dissipate over time. The dynamic process of vesicle formation and fusion was consistently linked to elevated Ca2+ signal.
FIGURE 9
FIGURE 9
Vesicle tract formation at cell periphery coincides with increased Ca2+ signal. Row 1 depicts an astrocyte network in response to photolysis. Rows 2-5 magnifies an active region of a cell located at the bottom left of the lysed cell, near the cell periphery. Frequently, numerous vesicles fuse resulting in the formation of a long tract region devoid of fluorescence near the cell periphery. Smaller, vesicles localize to the edge of the tract and fuse with the central region, highlighted by the white arrows in row 4.
FIGURE 10
FIGURE 10
Ca2+ localization during cell migration toward lysed cell. Observe the reorientation and migration of the astrocyte at the bottom of the image toward the central photolyzed cell (white ROI in pre-lysis image). Rows 2–5 highlight the area depicted by the white rectangle in the pre-lysis image of row 1. As the responding cell migrates in the direction of the lysed cell (blue arrow) Ca2+ localizes to cell membrane ruffles and protrusions. This dynamic process continues over the 130 min imaging period following photolysis. No obvious morphology or fluorescence changes are observed in the non-responding astrocyte process, in magnified insets visible in row 6 and 7.
FIGURE 11
FIGURE 11
Cytoplasmic Ca2+ signal constriction resulting in formation of endocytic vesicle. G/R ratio images (LUT fire) highlight waves of Ca2+ signal in response to photolyzed cell at center. Top right and bottom right cells both display a Ca2+ ring visible in the 13 min post-lysis image of row 1. The rectangle in the 13 min post-lysis image of row one corresponds to the magnified insets in row 2 that track the development of vesicle formation at the center of the constricting Ca2+ ring. High resolution IMD images and corresponding phase contrast images highlight Ca2+ through the process of endocytic vesicle formation.
FIGURE 12
FIGURE 12
Signal profile of concentric Ca2+ wave constricting and resulting in phagocytic vesicle formation. G/R intensity along the blue ROI is plotted. Between 4.5 and 6.75 min following photolysis, the intensity profile remains relatively linear. Two peaks corresponding to the perimeter of the concentric Ca2+ circle are visible at 10.75 min, and increase in intensity through 19 min. The peaks move from the periphery of traces toward the center of the plot profile as the concentric ring constricts. The two peaks form a large central peak 21 min post photolysis, then diminishes between 23 and 27 min post photolysis. The newly formed vesicle corresponds to the small dip at the center of the plot profiles at 28 and 31.25 min.

References

    1. Anderson M. A., Burda J. E., Ren Y., Ao Y., O’Shea T. M., Kawaguchi R., et al. (2016). Astrocyte scar formation aids central nervous system axon regeneration. Nature 532 195–200. 10.1038/nature17623 - DOI - PMC - PubMed
    1. Bagur R., Hajnoczky G. (2017). Intracellular Ca(2+) sensing: its role in calcium homeostasis and signaling. Mol. Cell 66 780–788. 10.1016/j.molcel.2017.05.028 - DOI - PMC - PubMed
    1. Bellesi M., de Vivo L., Chini M., Gilli F., Tononi G., Cirelli C. (2017). Sleep loss promotes astrocytic phagocytosis and microglial activation in mouse cerebral cortex. J. Neurosci. 37 5263–5273. 10.1523/jneurosci.3981-16.2017 - DOI - PMC - PubMed
    1. Botvinick E. L., Berns M. W. (2005). Internet-based robotic laser scissors and tweezers microscopy. Microsc. Res. Tech. 68 65–74. 10.1002/jemt.20216 - DOI - PubMed
    1. Cahoy J. D., Emery B., Kaushal A., Foo L. C., Zamanian J. L., Christopherson K. S., et al. (2008). A transcriptome database for astrocytes, neurons, and oligodendrocytes: a new resource for understanding brain development and function. J. Neurosci. 28 264–278. 10.1523/jneurosci.4178-07.2008 - DOI - PMC - PubMed