. 2020 Aug 28:8:842.
doi: 10.3389/fcell.2020.00842. eCollection 2020.

Epitranscriptomic N4-Acetylcytidine Profiling in CD4+ T Cells of Systemic Lupus Erythematosus

Affiliations

Epitranscriptomic N4-Acetylcytidine Profiling in CD4+ T Cells of Systemic Lupus Erythematosus

Gangqiang Guo et al. Front Cell Dev Biol. .

Abstract

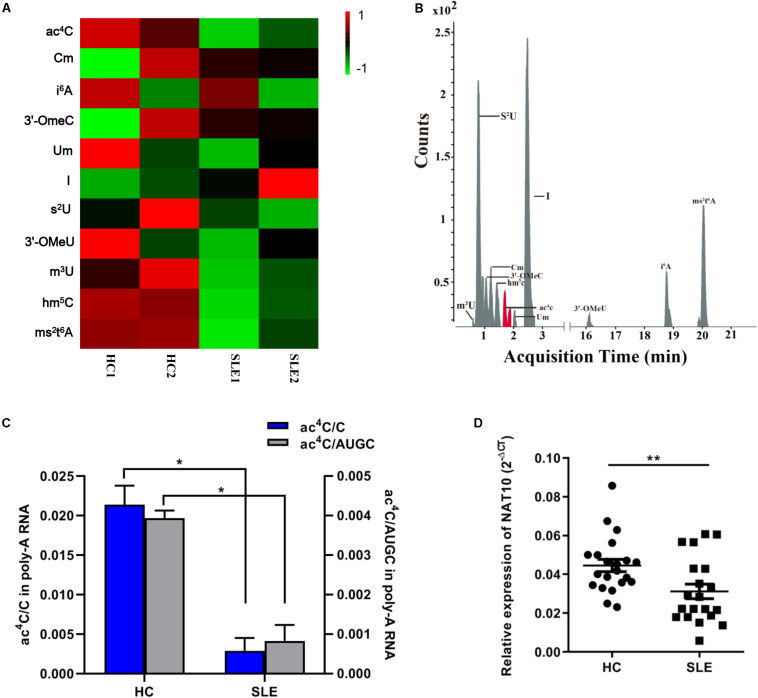
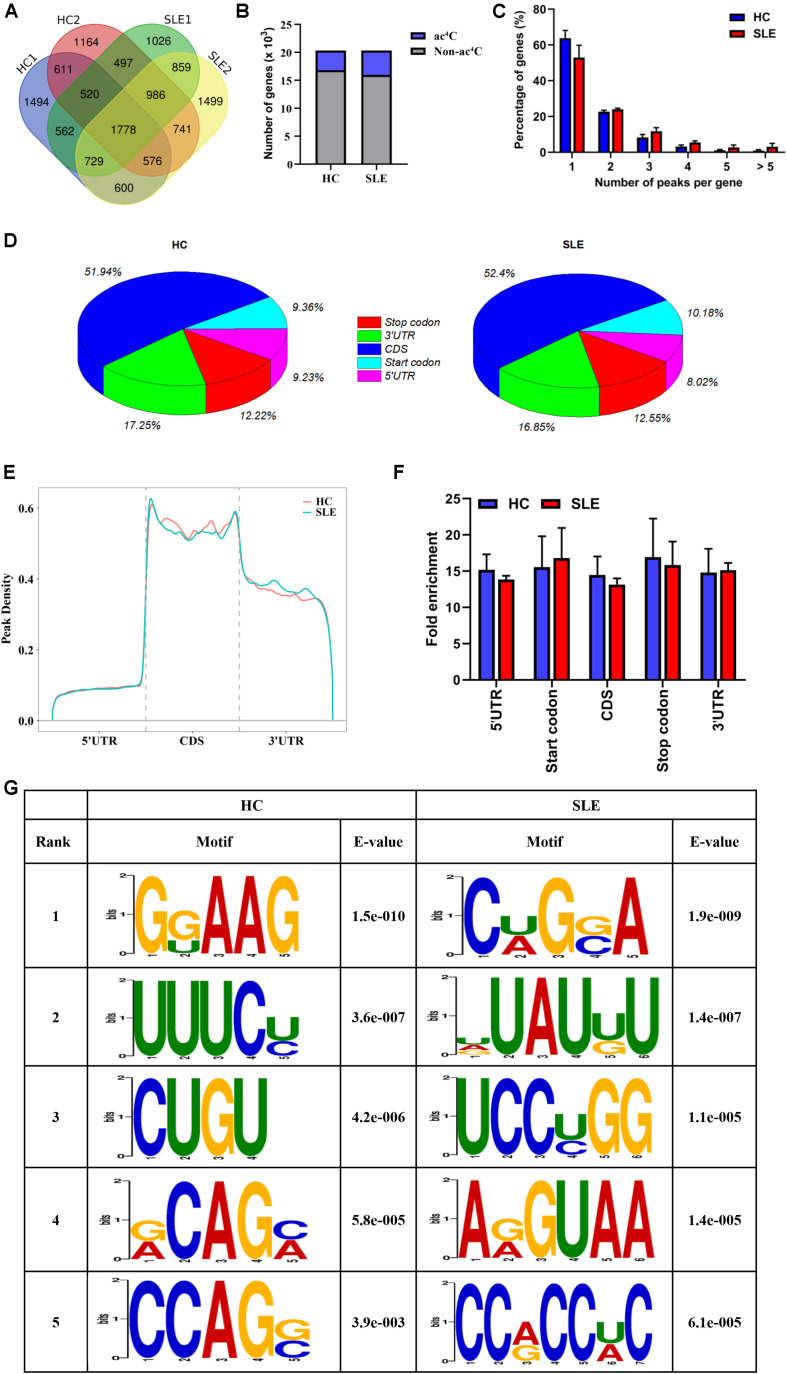
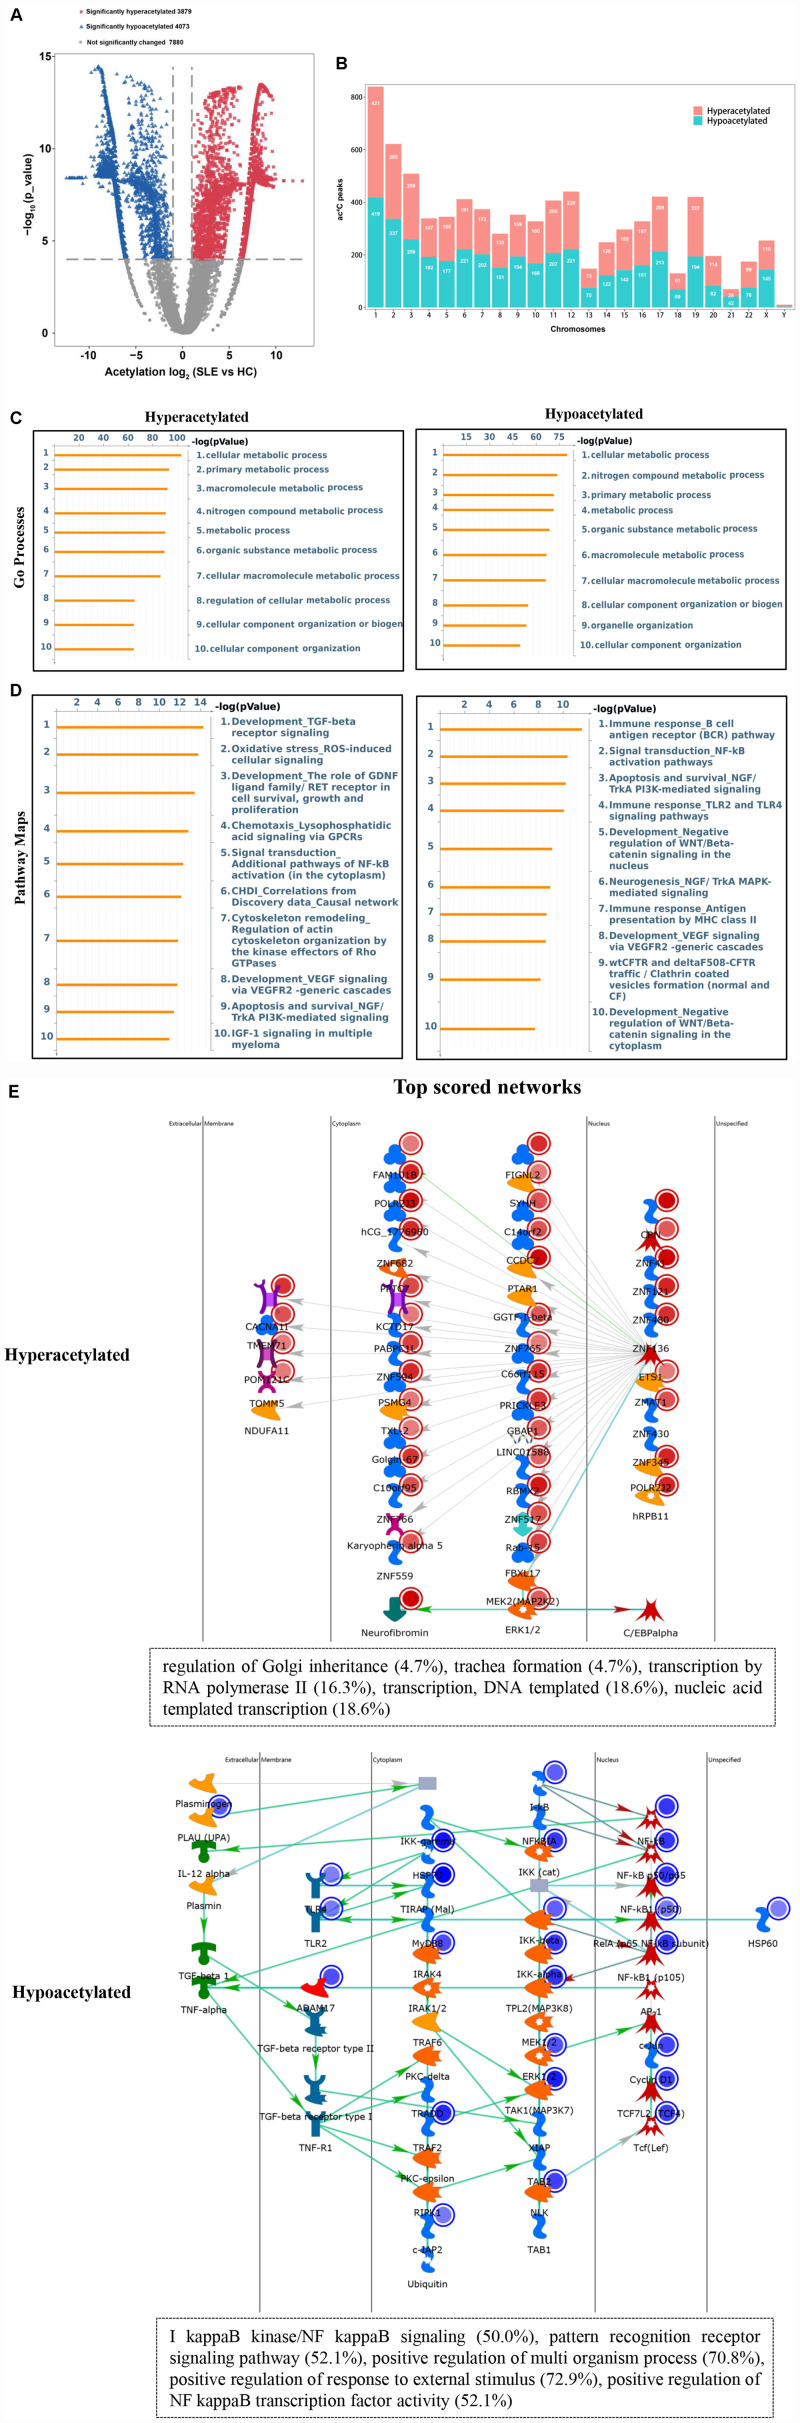
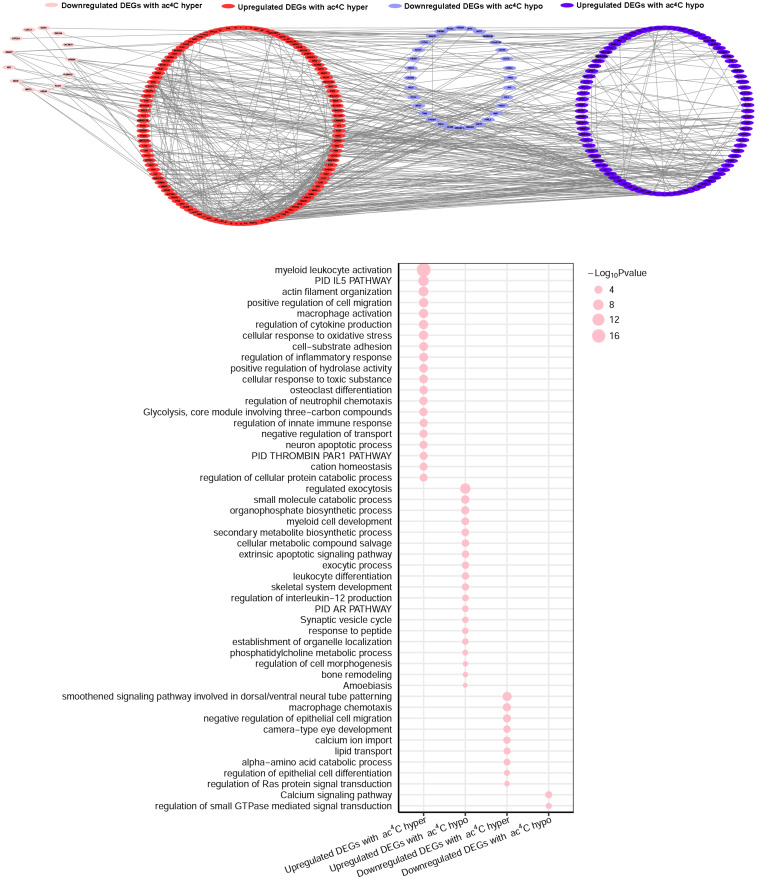
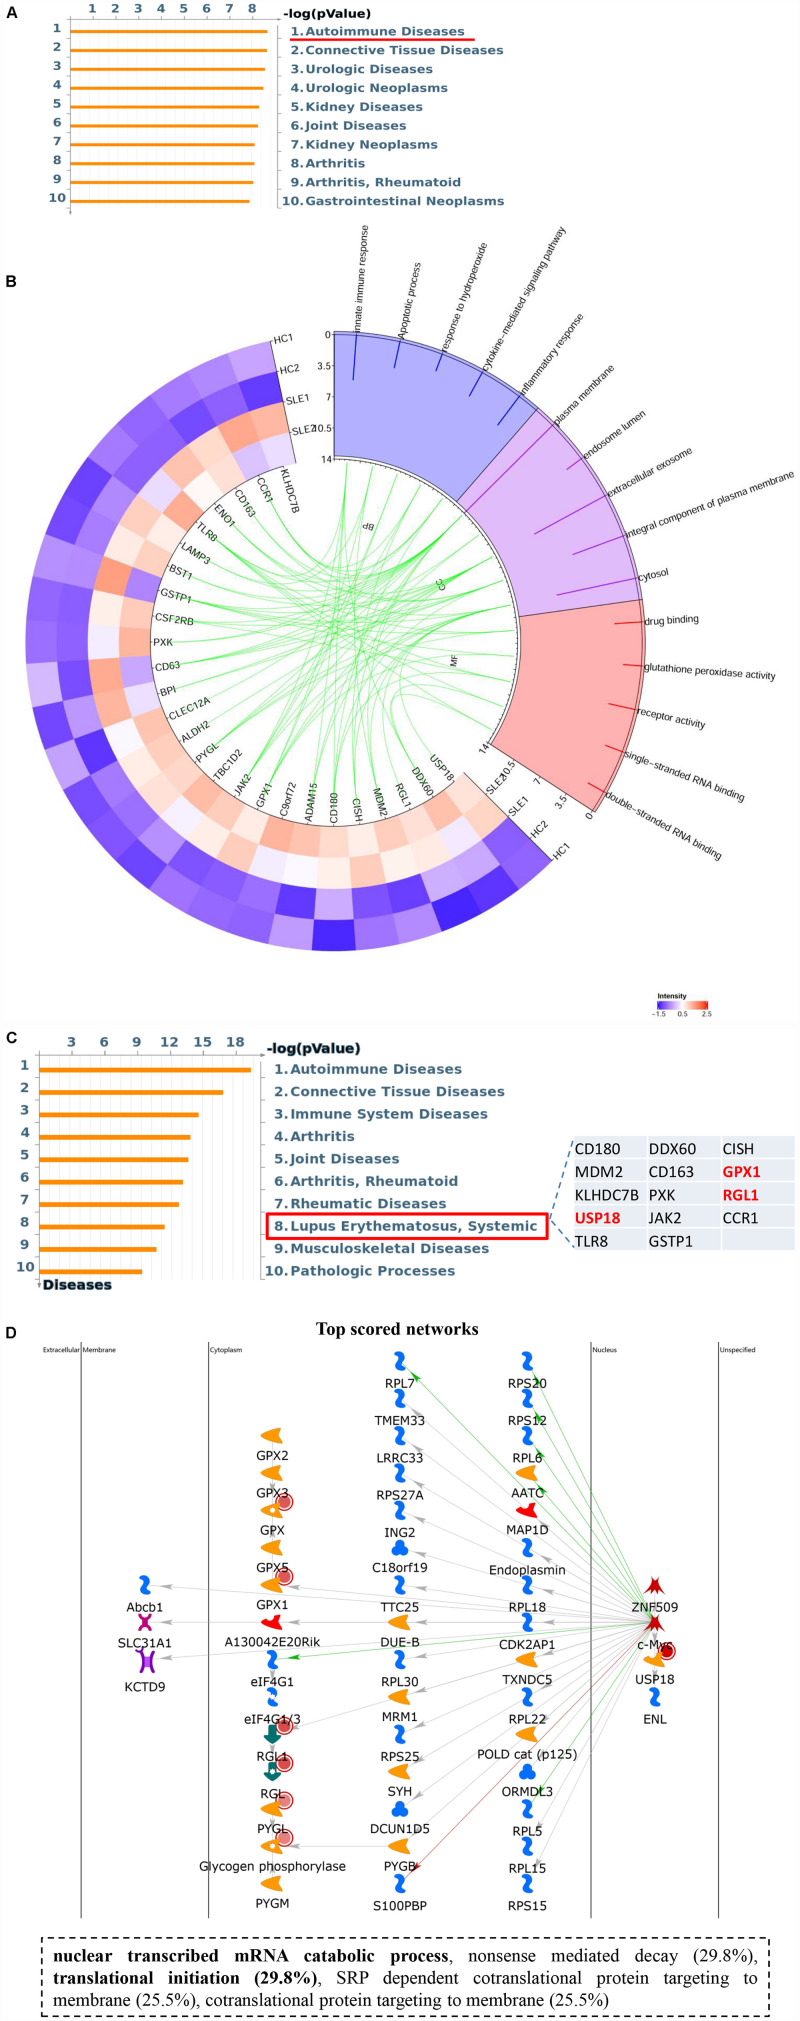
The emerging epitranscriptome plays an essential role in autoimmune disease. As a novel mRNA modification, N4-acetylcytidine (ac4C) could promote mRNA stability and translational efficiency. However, whether epigenetic mechanisms of RNA ac4C modification are involved in systemic lupus erythematosus (SLE) remains unclear. Herein, we detected eleven modifications in CD4+ T cells of SLE patients using mass spectrometry (LC-MS/MS). Furthermore, using samples from four CD4+ T cell pools, we identified lower modification of ac4C mRNA in SLE patients as compared to that in healthy controls (HCs). Meanwhile, significantly lower mRNA acetyltransferase NAT10 expression was detected in lupus CD4+ T cells by RT-qPCR. We then illustrated the transcriptome-wide ac4C profile in CD4+ T cells of SLE patients by ac4C-RIP-Seq and found ac4C distribution in mRNA transcripts to be highly conserved and enriched in mRNA coding sequence regions. Using bioinformatics analysis, the 3879 and 4073 ac4C hyper-acetylated and hypoacetylated peaks found in SLE samples, respectively, were found to be significantly involved in SLE-related function enrichments, including multiple metabolic and transcription-related processes, ROS-induced cellular signaling, apoptosis signaling, and NF-κB signaling. Moreover, we demonstrated the ac4C-modified regulatory network of gene biological functions in lupus CD4+ T cells. Notably, we determined that the 26 upregulated genes with hyperacetylation played essential roles in autoimmune diseases and disease-related processes. Additionally, the unique ac4C-related transcripts, including USP18, GPX1, and RGL1, regulate mRNA catabolic processes and translational initiation. Our study identified novel dysregulated ac4C mRNAs associated with critical immune and inflammatory responses, that have translational potential in lupus CD4+ T cells. Hence, our findings reveal transcriptional significance and potential therapeutic targets of mRNA ac4C modifications in SLE pathogenesis.

Keywords: CD4+ T cells; N4-acetylcytidine (ac4C); NAT10; epitranscriptome; systemic lupus erythematosus.


Figures

FIGURE 1
FIGURE 1
Overview of mRNA ac4C acetylation mapping between systemic lupus erythematosus (SLE) patients and healthy controls (HCs). (A) Heatmap of normalized abundance (modification/canonical nucleotide) of 11 mRNA modification forms detected through LC-MS/MS in CD4+ T cells from SLE patients and HCs. Green indicates a low z-score whereas red indicates a high z-score. (B). LC-MS/MS extracted ion chromatograms of modified mRNA in SLE patients and HCs. ac4C, N4-acetylcytidine; Cm, 2′-O-methylcytidine; i6A, N6-isopentenyladenosine; 3′-OmeC, 3′-O-methylcytidine; Um, 2′-O-methyluridine; I, inosine; s2U, 2-thiouridine; 3′-OMeA, 3′-O-methyladenosine; m3U, 3-methyluridine; hm5C, 5-hydroxymethylcytidine; ms2t6A, 2-methylthio-N6-threonylcarbamoyladenosine. (C) Comparation of calibrated ac4C/C and ac4C/AUGC levels in poly(A) RNA between HCs and SLE. Bars show the mean with SD of individual biological replicates (n = 2). *P < 0.05. (D) NAT10 mRNA expression level in CD4+ T cells from HCs (n = 21) and SLE patients (n = 20). Compared to HCs, NAT10 was downregulated in SLE patients. Data are presented as 2–ΔCt relative to GAPDH expression (mean with SEM; **P < 0.01).
FIGURE 2
FIGURE 2
Transcriptome-wide ac4C-RIPSeq and distribution of ac4C peaks. (A) Venn diagram of ac4C acetylated genes in HCs and SLE patients. The numbers of HC-unique, SLE-unique, and common ac4C modified genes are shown. (B) Bar charts indicating the number of genes with no (gray) or at least one significant (blue) ac4C peak at SLE group or HC group. (C) Proportion of genes harboring different numbers of ac4C peaks in the two groups. The majority of transcripts harbor only one or two ac4C peaks per gene in HC and SLE groups. (D) Pie charts show ac4C peaks distribution in different gene context in HCs and SLE patients. The averages of percentages of mRNA ac4C peaks within 5′UTR, StartC, CDS, StopC, and 3′UTR regions in transcriptomes are shown. (E) Distribution of ac4C peaks along mRNA transcripts. The moving averages of percentages of mRNA ac4C peaks are shown. (F) Statistics of fold enrichment of ac4C peaks in five segments in the two groups. Error bars represent the mean with SD. (G) Sequence logo showing the top five differential mode motifs enriched across changed ac4C peaks identified from HCs and SLE patients.
FIGURE 3
FIGURE 3
Pathway analysis of differentially acetylated genes. (A) Volcano plots display the differential ac4C peaks with statistical significance (fold change > 2; P < 0.0001). Blue points indicate significantly hypoacetylated transcripts and red points indicate significantly hyperacetylated transcripts. (B) The distributions of altered ac4C peaks in chromosomes of SLE patients. (C) Gene Ontology (GO) process analysis of differentially acetylated genes. Left panel represents hyperacetylated transcripts and right panel represents hypoacetylated transcripts. (D) Pathway Maps analysis of differentially acetylated genes. Left panel represents hyperacetylated transcripts and right panel represents hypoacetylated transcripts. (E) Top scored networks analysis of differentially acetylated genes. Top panel represents hyperacetylated transcripts and bottom panel represents hypoacetylated transcripts.
FIGURE 4
FIGURE 4
Gene Ontology enrichment map for ac4C-modified DEGs. Groups of upregulated DEGs with ac4C hyperacetylation (red), downregulated DEGs with ac4C hyper (pink), upregulated DEGs with ac4C hypo (dark blue), and downregulated DEGs with ac4C hypo (light blue) are marked in the network (P < 0.01; for details, see Supplementary Tables S3, S4) (top panel). Bubble diagram of GO biological process categories enriched for DEGs with ac4C hyper- or hypo-acetylation. The pink circle represents the –log10 P-value (down panel).
FIGURE 5
FIGURE 5
Upregulated gene set with ac4C hyperacetylation associated with SLE. (A) Pathway enriched analyses of upregulated DEGs with ac4C hyper. Twenty-six genes of upregulated DEGs with ac4C hyper-associated with autoimmune disease. (B) GO analysis of 26 upregulated DEGs with ac4C hyper. (C) Disease marker analysis of 26 upregulated DEGs with ac4C hyper. Fourteen of 26 genes of upregulated DEGs with ac4C hype associated with SLE. (D) The top scored networks analysis of 26 upregulated DEGs with ac4C hyper. GPX1, RGL1, and USP18 were involved in the top scored networks.

References

    1. Arango D., Sturgill D., Alhusaini N., Dillman A. A., Sweet T. J., Hanson G., et al. (2018). Acetylation of Cytidine in mRNA Promotes Translation Efficiency. Cell 175 1872.e24–1886.e24. 10.1016/j.cell.2018.10.030 - DOI - PMC - PubMed
    1. Bailey T. L. (2011). DREME: motif discovery in transcription factor ChIP-seq data. Bioinformatics 27 1653–1659. 10.1093/bioinformatics/btr261 - DOI - PMC - PubMed
    1. Chen X., Li A., Sun B. F., Yang Y., Han Y. N., Yuan X., et al. (2019). 5-methylcytosine promotes pathogenesis of bladder cancer through stabilizing mRNAs. Nat. Cell Biol. 21 978–990. 10.1038/s41556-019-0361-y - DOI - PubMed
    1. Chen X. Y., Zhang J., Zhu J. S. (2019). The role of m(6)A RNA methylation in human cancer. Mol. Cancer 18:103. 10.1186/s12943-019-1033-z - DOI - PMC - PubMed
    1. Chen Y., Zhou C., Sun Y., He X., Xue D. (2020). m(6)A RNA modification modulates gene expression and cancer-related pathways in clear cell renal cell carcinoma. Epigenomics 12 87–99. 10.2217/epi-2019-0182 - DOI - PubMed