

Thermodynamic equilibrium dose-response models for MERS-CoV infection reveal a potential protective role of human lung mucus but not for SARS-CoV-2
- PMID: 32984489
- PMCID: PMC7501778
- DOI: 10.1016/j.mran.2020.100140
Thermodynamic equilibrium dose-response models for MERS-CoV infection reveal a potential protective role of human lung mucus but not for SARS-CoV-2
Abstract
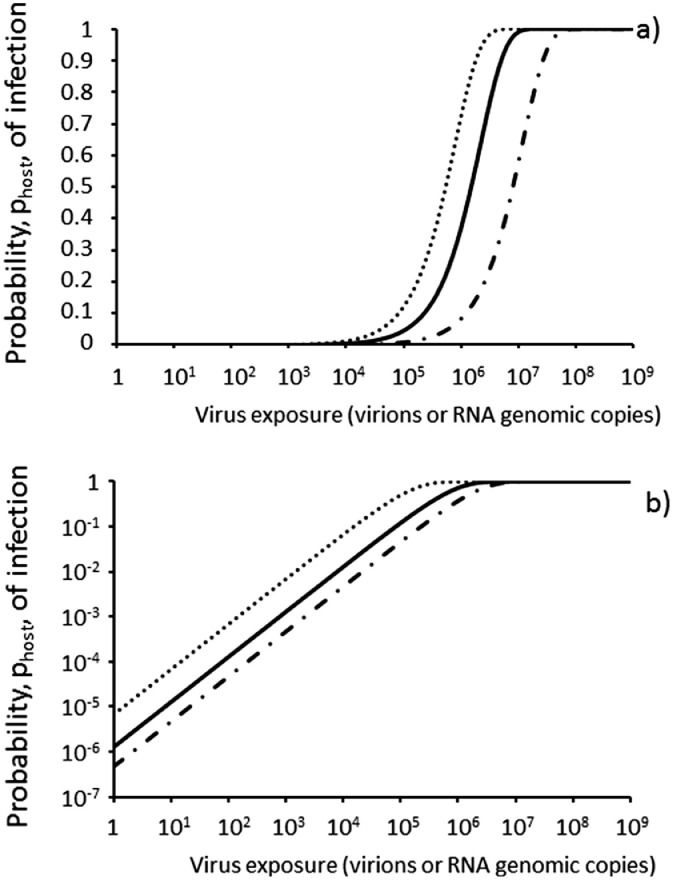
Severe acute respiratory syndrome coronavirus 2 (SARS-CoV-2) and Middle East respiratory syndrome coronavirus (MERS-CoV) infect the human respiratory tract. A prototype thermodynamic equilibrium model is presented here for the probability of the virions getting through the mucus barrier and infecting epithelial cells based on the binding affinity (Kmucin) of the virions to mucin molecules in the mucus and parameters for binding and infection of the epithelial cell. Both MERS-CoV and SARS-CoV-2 bind strongly to their cellular receptors, DDP4 and ACE2, respectively, and infect very efficiently both bronchus and lung ex vivo cell cultures which are not protected by a mucus barrier. According to the model, mucin binding could reduce the infectivity for MERS-CoV compared to SARS-CoV-2 by at least 100-fold depending on the magnitude of Kmucin. Specifically Kmucin values up to 106 M-1 have little protective effect and thus the mucus barrier would not remove SARS-CoV-2 which does not bind to sialic acids (SA) and hence would have a very low Kmucin. Depending on the viability of individual virions, the ID50 for SARS-CoV-2 is estimated to be ~500 virions (viral RNA genomic copies) representing 1 to 2 pfu. In contrast MERS-CoV binds both SA and human mucin and a Kmucin of 5 × 10⁹ M-1 as reported for lectins would mop up 99.83% of the virus according to the model with the ID50 for MERS-CoV estimated to be ~295,000 virions (viral RNA genomic copies) representing 819 pfu. This could in part explain why MERS-CoV is poorly transmitted from human to human compared to SARS-CoV-2. Some coronaviruses use an esterase to escape the mucin, although MERS-CoV does not. Instead, it is shown here that "clustering" of virions into single aerosol particles as recently reported for rotavirus in extracellular vesicles could provide a co-operative mechanism whereby MERS-CoV could theoretically overcome the mucin barrier locally and a small proportion of 10 μm diameter aerosol particles could contain ~70 virions based on reported maximum levels in saliva. Although recent evidence suggests SARS-CoV-2 initiates infection in the nasal epithelium, the thermodynamic equilibrium models presented here could complement published approaches for modelling the physical entry of pathogens to the lung based on the fate and transport of the pathogen particles (as for anthrax spores) to develop a dose-response model for aerosol exposure to respiratory viruses. This would enable the infectivity through aerosols to be defined based on molecular parameters as well as physical parameters. The role of the spike proteins of MERS-CoV and SARS-CoV-2 binding to SA and heparan sulphate, respectively, may be to aid non-specific attachment to the host cell. It is proposed that a high Kmucin is the cost for subsequent binding of MERS-CoV to SAs on the cell surface to partially overcome the unfavourable entropy of immobilisation as the virus adopts the correct orientation for spike protein interactions with its protein cellular receptor DPP4.
Keywords: Dose-response; Infection; Mucin; Risk; SARS-CoV-2.
© 2020 Elsevier B.V. All rights reserved.
Conflict of interest statement
None declared.
Figures
Similar articles
-
Using thermodynamic parameters to calibrate a mechanistic dose-response for infection of a host by a virus.Microb Risk Anal. 2018 Apr;8:1-13. doi: 10.1016/j.mran.2018.01.002. Epub 2018 Jan 4. Microb Risk Anal. 2018. PMID: 32289059 Free PMC article.
-
Species-Specific Colocalization of Middle East Respiratory Syndrome Coronavirus Attachment and Entry Receptors.J Virol. 2019 Jul 30;93(16):e00107-19. doi: 10.1128/JVI.00107-19. Print 2019 Aug 15. J Virol. 2019. PMID: 31167913 Free PMC article.
-
Using thermodynamic equilibrium models to predict the effect of antiviral agents on infectivity: Theoretical application to SARS-CoV-2 and other viruses.Microb Risk Anal. 2022 Aug;21:100198. doi: 10.1016/j.mran.2021.100198. Epub 2021 Dec 4. Microb Risk Anal. 2022. PMID: 34901357 Free PMC article.
-
Man-Specific Lectins from Plants, Fungi, Algae and Cyanobacteria, as Potential Blockers for SARS-CoV, MERS-CoV and SARS-CoV-2 (COVID-19) Coronaviruses: Biomedical Perspectives.Cells. 2021 Jun 28;10(7):1619. doi: 10.3390/cells10071619. Cells. 2021. PMID: 34203435 Free PMC article. Review.
-
Properties of Coronavirus and SARS-CoV-2.Malays J Pathol. 2020 Apr;42(1):3-11. Malays J Pathol. 2020. PMID: 32342926 Review.
Cited by
-
A CFD-based framework to assess airborne infection risk in buildings.Build Environ. 2023 Apr 1;233:110099. doi: 10.1016/j.buildenv.2023.110099. Epub 2023 Feb 13. Build Environ. 2023. PMID: 36815961 Free PMC article.
-
Risk of SARS-CoV-2 in a car cabin assessed through 3D CFD simulations.Indoor Air. 2022 Mar;32(3):e13012. doi: 10.1111/ina.13012. Indoor Air. 2022. PMID: 35347787 Free PMC article. Review.
-
A Novel Framework for Modeling Person-to-Person Transmission of Respiratory Diseases.Viruses. 2022 Jul 19;14(7):1567. doi: 10.3390/v14071567. Viruses. 2022. PMID: 35891547 Free PMC article.
-
Assessment of SARS-CoV-2 airborne infection transmission risk in public buses.Geosci Front. 2022 Nov;13(6):101398. doi: 10.1016/j.gsf.2022.101398. Epub 2022 Apr 13. Geosci Front. 2022. PMID: 37521135 Free PMC article.
-
Ventilation procedures to minimize the airborne transmission of viruses in classrooms.Build Environ. 2021 Sep;202:108042. doi: 10.1016/j.buildenv.2021.108042. Epub 2021 Jun 10. Build Environ. 2021. PMID: 34127877 Free PMC article.
References
-
- Adhikari U., Chabrelie A., Weir M., Boehnke K., McKenzie E., Ikner L., Wang M., Wang Q., Young K., Haas C.N., Rose J., Mitchell J. A case study evaluating the risk of infection from Middle Eastern Respiratory syndrome coronavirus (MERS-CoV) in a hospital setting through bioaerosols. Risk Analysis. 2019;39:2608–2624. - PMC - PubMed
-
- Anon (2020). Coronavirus resource center (https://coronavirus.jhu.edu/map.html) Accessed 8 August 2020.
LinkOut - more resources
Full Text Sources
Miscellaneous