

Fragility of a multilayer network of intranational supply chains
- PMID: 32984501
- PMCID: PMC7509503
- DOI: 10.1007/s41109-020-00310-1
Fragility of a multilayer network of intranational supply chains
Abstract
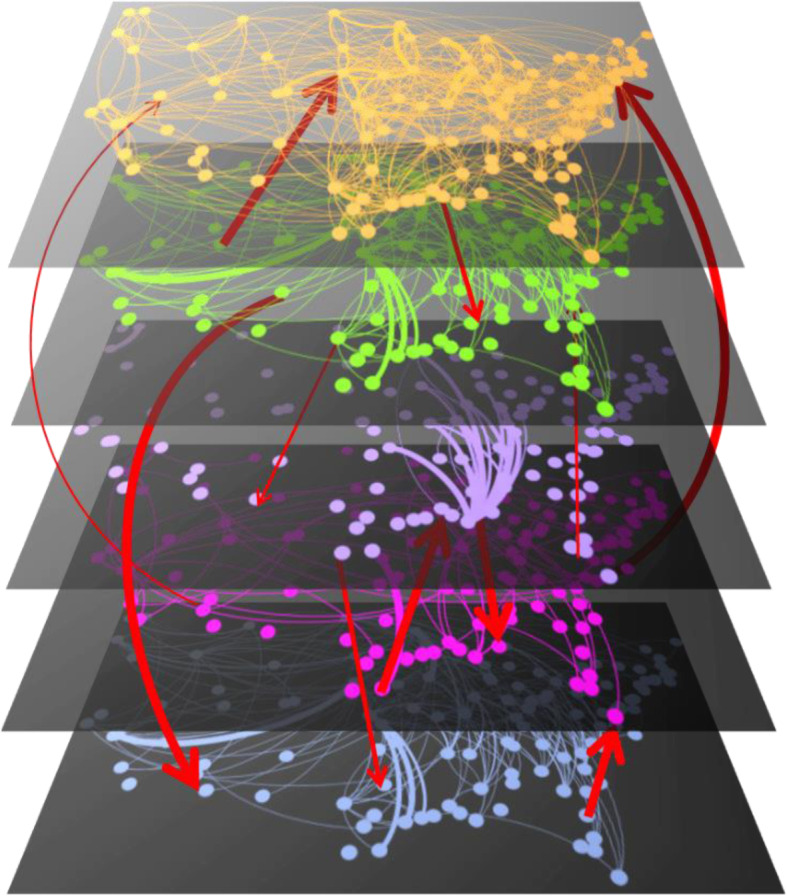
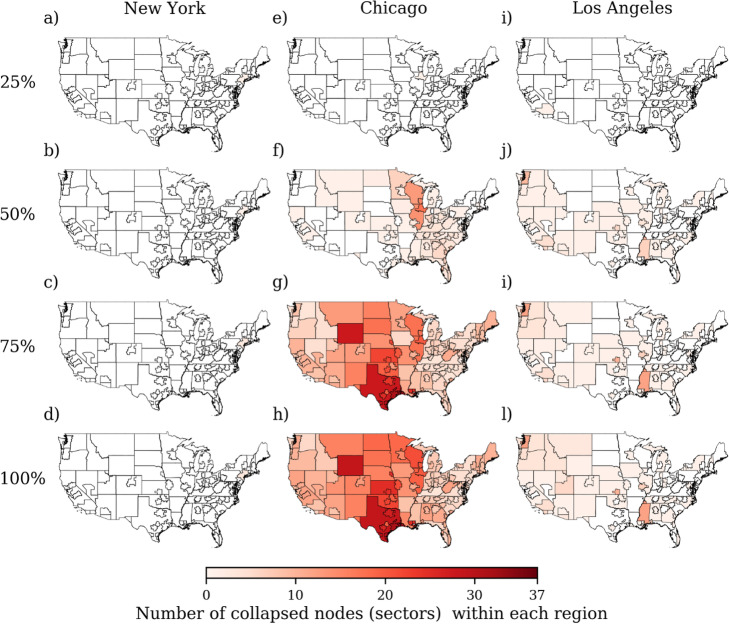
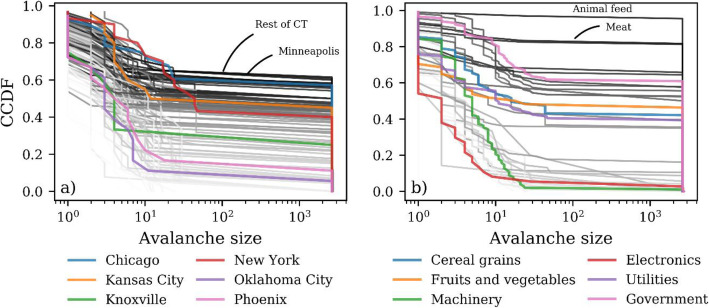
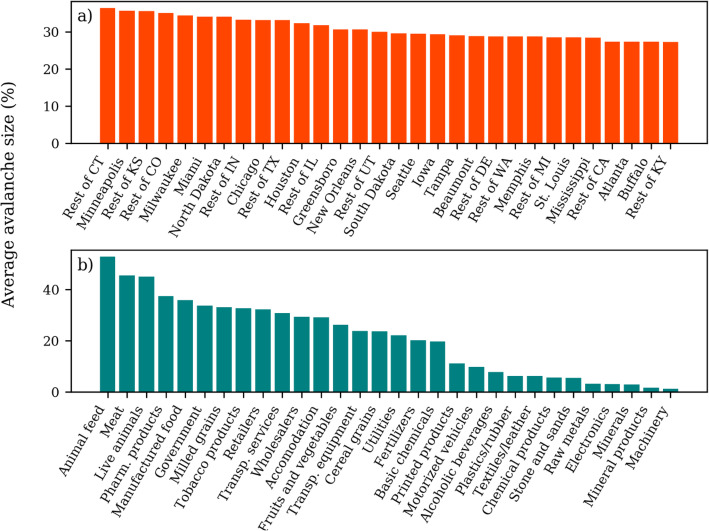
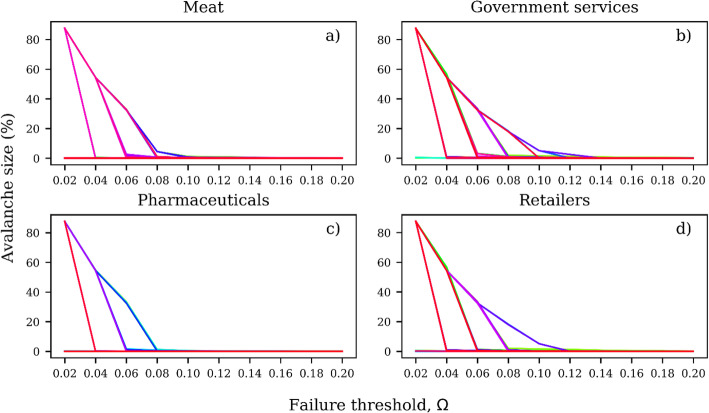
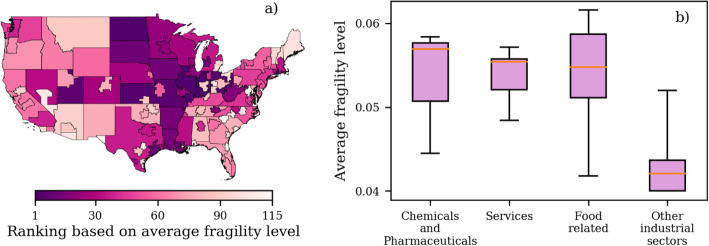
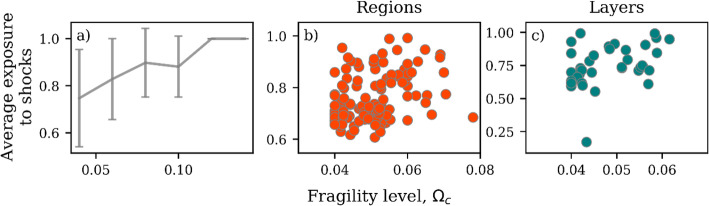
Supply chains enable the flow of goods and services within economic systems. When mapped for the entire economy and geographic locations of a country, supply chains form a spatial web of interactions among suppliers and buyers. One way to characterize supply chains is through multiregional input-output linkages. Using a multiregional input-output dataset, we build the multilayer network of supply chains in the United States. Together with a network cascade model, the multilayer network is used to explore the propagation of economic shocks along intranational supply chains. We find that the effect of economic shocks, measured using the avalanche size or total number of collapsed nodes, varies widely depending on the geographic location and economic sector of origin of a shock. The response of the supply chains to shocks reveals a threshold-like behavior. Below a certain failure or fragility level, the avalanche size increases relatively quickly for any node in the network. Based on this result, we find that the most fragile regions tend to be located in the central United States, which are regions that tend to specialize in food production and manufacturing. The most fragile layers are chemical and pharmaceutical products, services and food-related products, which are all sectors that have been disrupted by the Coronavirus Disease 2019 (COVID-19) pandemic in the United States. The fragility risk, measured by the intersection of the fragility level of a node and its exposure to shocks, varies across regions and sectors. This suggests that interventions aiming to make the supply-chain network more robust to shocks are likely needed at multiple levels of network aggregation.
Keywords: COVID-19; Cascading failure; Diffusion; Economic networks; Multiplex; Multiregional input-output; Shock.
© The Author(s) 2020.
Conflict of interest statement
Competing interestsThe authors declare that they have no competing interests.
Figures
Similar articles
-
Mapping the Water-Economic Cascading Risks within a Multilayer Network of Supply Chains in China.Environ Sci Technol. 2025 Apr 29;59(16):7960-7972. doi: 10.1021/acs.est.5c01545. Epub 2025 Apr 18. Environ Sci Technol. 2025. PMID: 40248977
-
Propagation of economic shocks in input-output networks: a cross-country analysis.Phys Rev E Stat Nonlin Soft Matter Phys. 2014 Dec;90(6):062812. doi: 10.1103/PhysRevE.90.062812. Epub 2014 Dec 19. Phys Rev E Stat Nonlin Soft Matter Phys. 2014. PMID: 25615153
-
Robustness and resilience of supply chains during the COVID-19 pandemic.World Econ. 2022 Dec 15:10.1111/twec.13372. doi: 10.1111/twec.13372. Online ahead of print. World Econ. 2022. PMID: 36718358 Free PMC article.
-
A review on post-COVID-19 impacts and opportunities of agri-food supply chain in Malaysia.PeerJ. 2023 May 1;11:e15228. doi: 10.7717/peerj.15228. eCollection 2023. PeerJ. 2023. PMID: 37151297 Free PMC article. Review.
-
The Minderoo-Monaco Commission on Plastics and Human Health.Ann Glob Health. 2023 Mar 21;89(1):23. doi: 10.5334/aogh.4056. eCollection 2023. Ann Glob Health. 2023. PMID: 36969097 Free PMC article. Review.
Cited by
-
Shock propagation from the Russia-Ukraine conflict on international multilayer food production network determines global food availability.Nat Food. 2023 Jun;4(6):508-517. doi: 10.1038/s43016-023-00771-4. Epub 2023 Jun 15. Nat Food. 2023. PMID: 37322302
-
Resilience-by-Design and Resilience-by-Intervention in supply chains for remote and indigenous communities.Nat Commun. 2022 Mar 2;13(1):1124. doi: 10.1038/s41467-022-28734-6. Nat Commun. 2022. PMID: 35236845 Free PMC article.
-
The strength of domestic production networks: an economic application of the Finn cycling index.Appl Netw Sci. 2021;6(1):69. doi: 10.1007/s41109-021-00411-5. Epub 2021 Sep 19. Appl Netw Sci. 2021. PMID: 34568547 Free PMC article.
-
Trust issues in vaccine uptake.J Crit Care. 2022 Feb;67:198-199. doi: 10.1016/j.jcrc.2021.09.020. Epub 2021 Oct 12. J Crit Care. 2022. PMID: 34649746 Free PMC article. No abstract available.
-
Shock propagation channels behind the global economic contagion network. The role of economic sectors and the direction of trade.PLoS One. 2021 Oct 20;16(10):e0258309. doi: 10.1371/journal.pone.0258309. eCollection 2021. PLoS One. 2021. PMID: 34669711 Free PMC article.
References
-
- Acemoglu D, Akcigit U, Kerr W. Networks and the macroeconomy: an empirical exploration. NBER Macroecon Annu. 2016;30(1):273–335. doi: 10.1086/685961. - DOI
-
- Acemoglu D, Carvalho VM, Ozdaglar A, Tahbaz-Salehi A. The network origins of aggregate fluctuations. Econometrica. 2012;80(5):1977–2016. doi: 10.3982/ECTA9623. - DOI
-
- Acemoglu D, Ozdaglar A, Tahbaz-Salehi A. The Oxford handbook of the economics of networks. 2016. Networks, shocks, and systemic risk.
-
- Acharya VV, Richardson M. Causes of the financial crisis. Crit Rev. 2009;21(2–3):195–210. doi: 10.1080/08913810902952903. - DOI
-
- Akpan N (2020) These underlying conditions make coronavirus more severe, and they’re surprisingly common. Natl Geogr. https://www.nationalgeographic.com/science/2020/03/these-underlyingcondi.... Accessed 30 Mar 2020.
LinkOut - more resources
Full Text Sources
Other Literature Sources