

Coenzyme Q10 nullified khat-induced hepatotoxicity, nephrotoxicity and inflammation in a mouse model
- PMID: 32984611
- PMCID: PMC7498867
- DOI: 10.1016/j.heliyon.2020.e04917
Coenzyme Q10 nullified khat-induced hepatotoxicity, nephrotoxicity and inflammation in a mouse model
Abstract
Ethnopharmacological relevance: The consumption of khat (Catha Edulis, Forsk) is on the rise despite the much publicized associated deleterious health effects. How chemicals present in khat, affect various physiological and biochemical processes requires further scrutiny. A clear understanding of these processes will provide an avenue for countering khat-driven negative effects using appropriate pharmacological and/or nutritional interventions.
Aim of the study: The current study investigated the effect of khat on vital physiological and biochemical processes such as oxidative stress, inflammation and immune responses and the role of Coenzyme-Q10 (CoQ10), a potent antioxidant and anti-inflammatory, in modulating any negative effects due to khat exposure.
Methodology: Three (3) weeks old forty (40) Swiss albino mice were randomly assigned into four treatment groups (n = 10). The first group was the control that was not administered with khat or CoQ10. The second group received 200 mg/kg body weight (b/w) of CoQ10, while the third group received 1500 mg/kg b/w of khat extract and finally the forth group was co-treated with 200 mg/kg b/w of CoQ10 and 1500 mg/kg b/w of khat extract. The experiment was conducted for 90 days after which samples were collected for physiological and biochemical analyses.
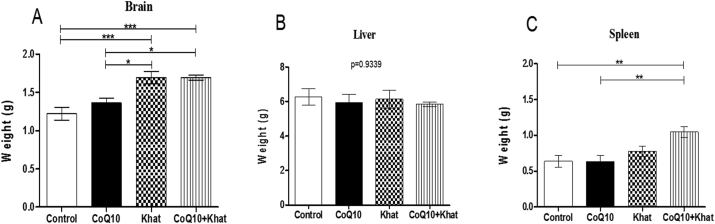
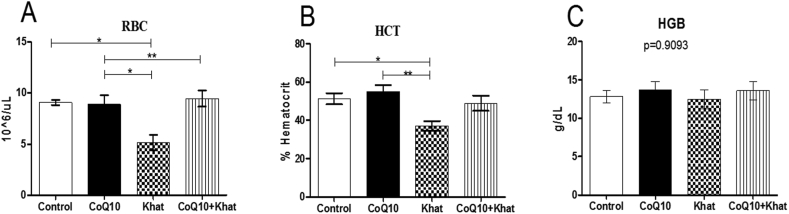
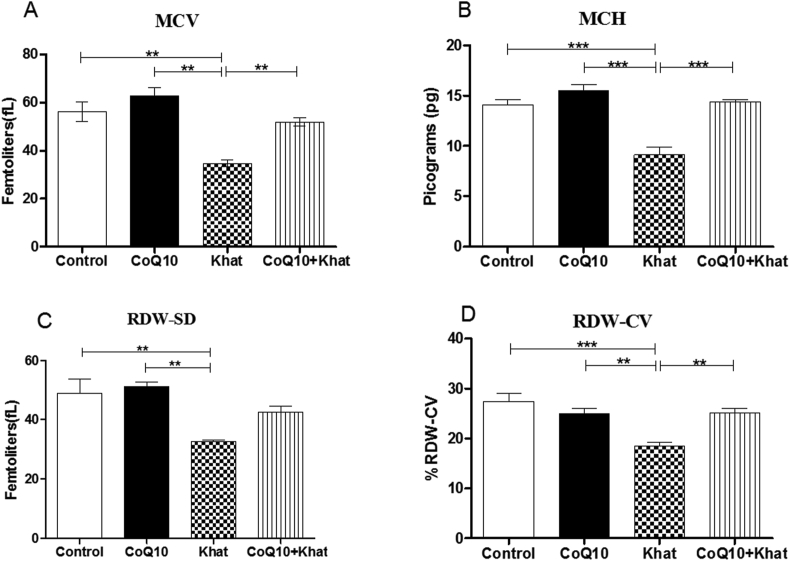
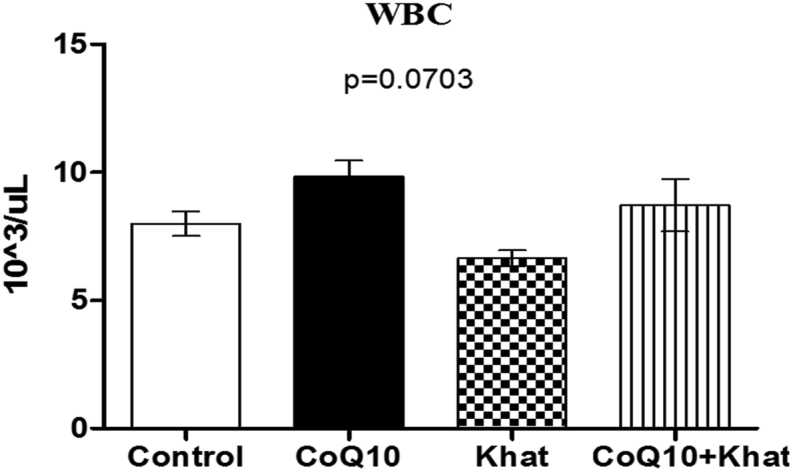
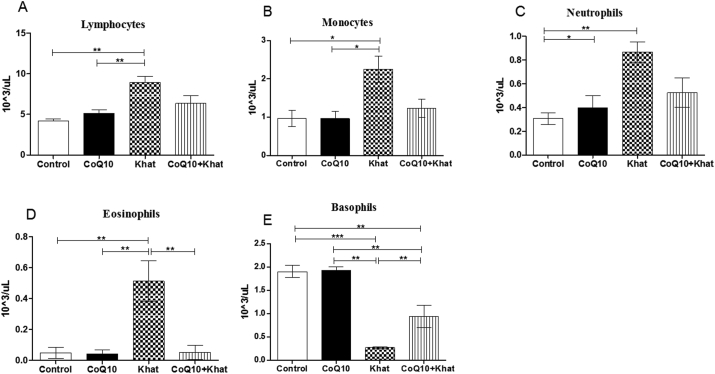
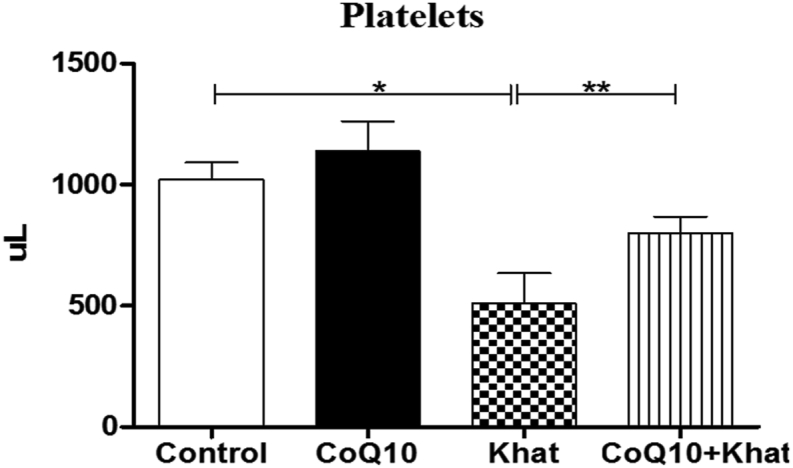
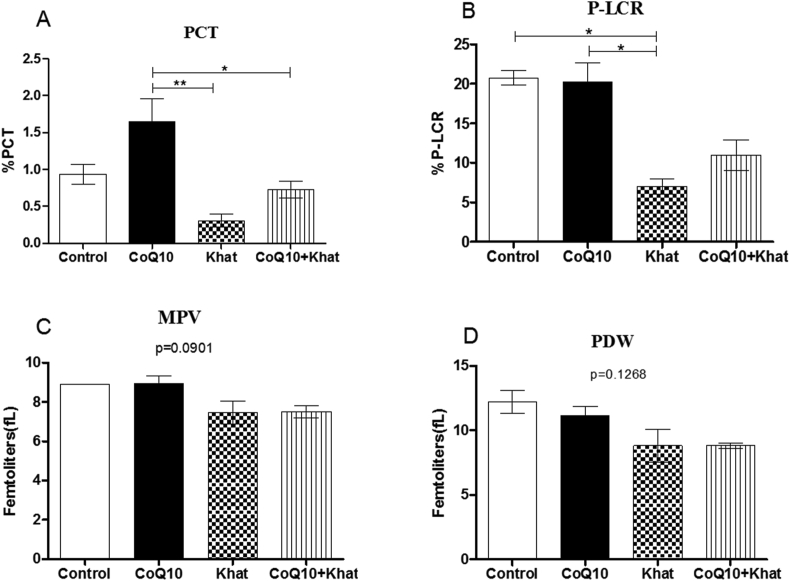
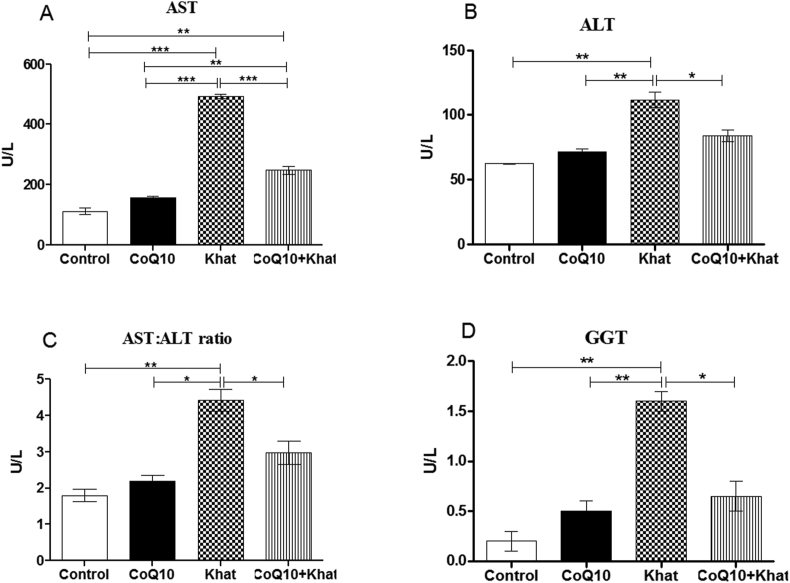
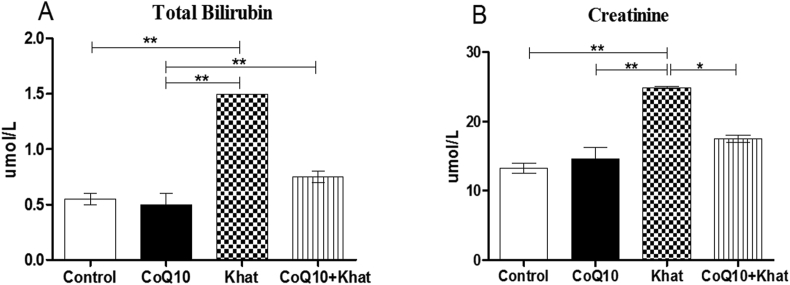
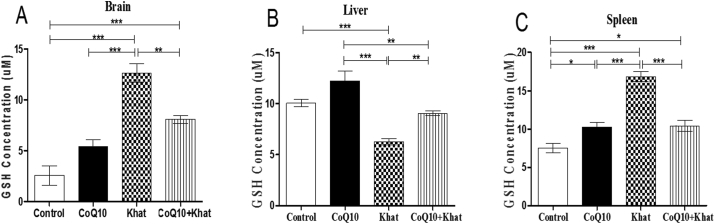
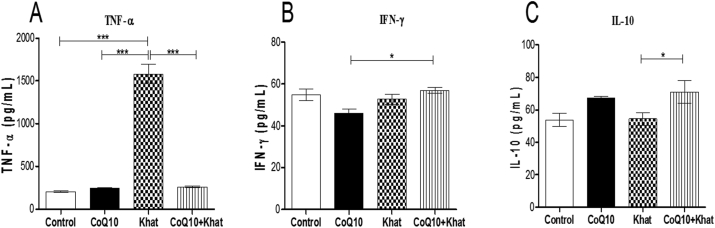
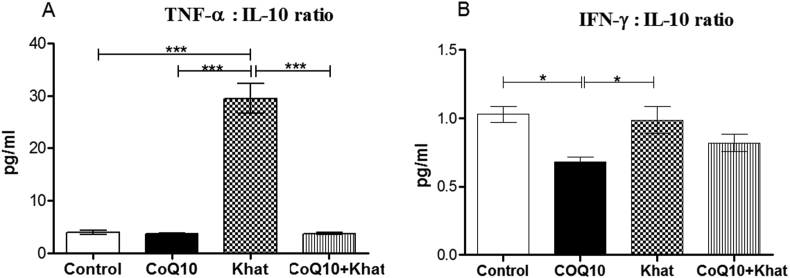
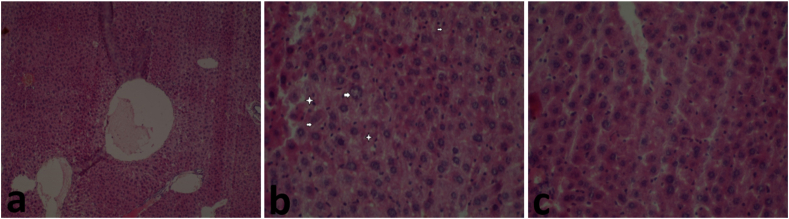
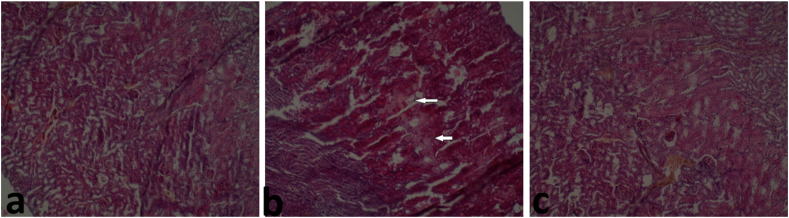
Results: The effects of khat and CoQ10 on the weights of brain, liver, kidney and spleen was determined. Administration of khat decreased the levels of RBCs and its subtypes (MCV, MCH, RDW-SD and RDW-CV), a clear indicator of khat-induced normochromic microcytic anemia. White blood cells (lymphocytes, monocytes, neutrophils and eosinophil) which are vital in responding to infections were markedly elevated by khat. Moreover, these results provide evidence for khat-induced liver and kidney injury as shown by increased biomarkers; AST, ALT, GGT and creatinine respectively. Standard histopathological analysis confirmed this finding for khat-driven liver and kidney injury. Further studies showed evidence for khat-induced inflammation and oxidative stress as depicted by increased levels of the pro-inflammatory cytokine TNF-alpha and elevation of GSH in the brain, liver and spleen. Remarkably, this is the first study to demonstrate the potential of CoQ10 in ameliorating khat-induced negative effects as outlined. CoQ10 supplementation restored the khat-induced reduction in RBC subtypes, and was protective against liver and kidney injury as shown by the appropriate biomarkers and standard histopathology analysis. The other significant finding was the CoQ10-driven normalization of GSH and TNF-α levels, indicating a protective effect from khat-driven oxidative stress and inflammation respectively.
Conclusion: From this study, we conclude that CoQ10 may be useful in nullifying khat-driven deleterious events among chronic khat users.
Keywords: Alternative medicine; Biochemistry; Biological sciences; Coenzyme-Q10; Health sciences; Immune system; Inflammation; Khat toxicity; Khat-induced anemia; Neuroscience; Oxidative stress; Pharmaceutical science; Toxicology.
© 2020 The Author(s).
Figures
Similar articles
-
Coenzyme Q10 protected against arsenite and enhanced the capacity of 2,3-dimercaptosuccinic acid to ameliorate arsenite-induced toxicity in mice.BMC Pharmacol Toxicol. 2021 Apr 7;22(1):19. doi: 10.1186/s40360-021-00484-z. BMC Pharmacol Toxicol. 2021. PMID: 33827703 Free PMC article.
-
Coenzyme Q10 ameliorates carbofuran induced hepatotoxicity and nephrotoxicity in wister rats.Heliyon. 2023 Feb 14;9(2):e13727. doi: 10.1016/j.heliyon.2023.e13727. eCollection 2023 Feb. Heliyon. 2023. PMID: 36865458 Free PMC article.
-
Diosmin and Coenzyme q10: Synergistic histopathological and functional protection against doxorubicin-induced hepatorenal injury in rats.Toxicol Rep. 2024 Nov 30;13:101848. doi: 10.1016/j.toxrep.2024.101848. eCollection 2024 Dec. Toxicol Rep. 2024. PMID: 39703765 Free PMC article.
-
Effects of coenzyme Q10 supplementation on inflammation, angiogenesis, and oxidative stress in breast cancer patients: a systematic review and meta-analysis of randomized controlled- trials.Inflammopharmacology. 2021 Jun;29(3):579-593. doi: 10.1007/s10787-021-00817-8. Epub 2021 May 18. Inflammopharmacology. 2021. PMID: 34008150
-
Can coenzyme Q10 supplementation effectively reduce human tumor necrosis factor-α and interleukin-6 levels in chronic inflammatory diseases? A systematic review and meta-analysis of randomized controlled trials.Pharmacol Res. 2019 Oct;148:104290. doi: 10.1016/j.phrs.2019.104290. Epub 2019 Jun 8. Pharmacol Res. 2019. PMID: 31185284
Cited by
-
Ameliorative and protective effects of coenzyme Q10 against natural and chemical toxicity: a narrative review.Naunyn Schmiedebergs Arch Pharmacol. 2025 Aug;398(8):9817-9850. doi: 10.1007/s00210-025-03992-5. Epub 2025 Mar 13. Naunyn Schmiedebergs Arch Pharmacol. 2025. PMID: 40080152 Review.
-
Coenzyme Q10 protected against arsenite and enhanced the capacity of 2,3-dimercaptosuccinic acid to ameliorate arsenite-induced toxicity in mice.BMC Pharmacol Toxicol. 2021 Apr 7;22(1):19. doi: 10.1186/s40360-021-00484-z. BMC Pharmacol Toxicol. 2021. PMID: 33827703 Free PMC article.
-
Molecular mechanisms underlying the renal protective effects of coenzyme Q10 in acute kidney injury.Cell Mol Biol Lett. 2022 Jul 22;27(1):57. doi: 10.1186/s11658-022-00361-5. Cell Mol Biol Lett. 2022. PMID: 35869439 Free PMC article. Review.
-
A glyphosate-based herbicide disrupted hematopoiesis and induced organ toxicities, ameliorated by vitamin B12 in a mouse model.Saudi J Biol Sci. 2022 Jun;29(6):103278. doi: 10.1016/j.sjbs.2022.03.028. Epub 2022 Mar 29. Saudi J Biol Sci. 2022. PMID: 35401022 Free PMC article.
-
Sodium Metabisulfite-Induced Hematotoxicity, Oxidative Stress, and Organ Damage Ameliorated by Standardized Ginkgo biloba in Mice.J Toxicol. 2023 Oct 10;2023:7058016. doi: 10.1155/2023/7058016. eCollection 2023. J Toxicol. 2023. PMID: 37854041 Free PMC article.
References
-
- Abdul-Mughni A.S., El-Nahla S.M., Hassan S.A., Ali A.A.D. Teratogenic effects of Khat (Catha edulis) in New Zealand rabbit. J. Adv. Vet. Anim. Res. 2018;5:25–36.
-
- Al-Akwa A.A., Shaher M., Al-Akwa S., Aleryani S.L. Free radicals are present in human serum of Catha edulis Forsk (Khat) abusers. J. Ethnopharmacol. 2009;125:471–473. - PubMed
-
- Al-habeshi N.N., Skaug N. Khat ( Catha edulis )— an updated review. Addiction Biol. 2005;10(4):299–307. - PubMed
-
- Al-Zubairi A., Al-Habori M., Al-Geiry A. Effect of Catha edulis (khat) chewing on plasma lipid peroxidation. J. Ethnopharmacol. 2003;87:3–9. - PubMed
LinkOut - more resources
Full Text Sources
Research Materials
Miscellaneous
