. 2020 Sep 18;1(2):100044.
doi: 10.1016/j.xpro.2020.100044. Epub 2020 Jun 6.

An Optimized Protocol for In Vivo Analysis of Tumor Cell Division in a Sleeping Beauty-Mediated Mouse Glioma Model

Affiliations

An Optimized Protocol for In Vivo Analysis of Tumor Cell Division in a Sleeping Beauty-Mediated Mouse Glioma Model

Maria B Garcia-Fabiani et al. STAR Protoc. .

Abstract

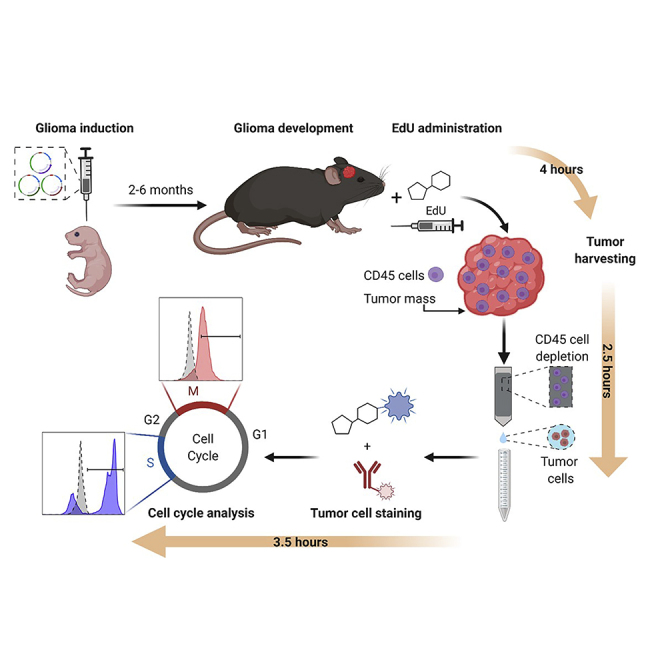
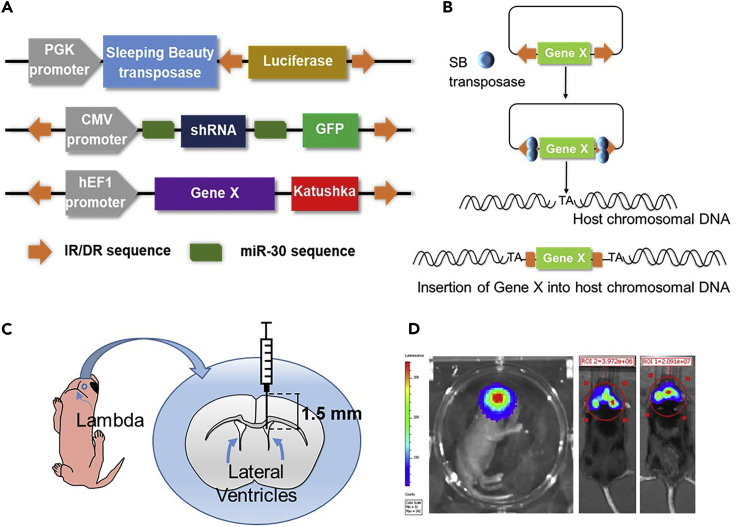
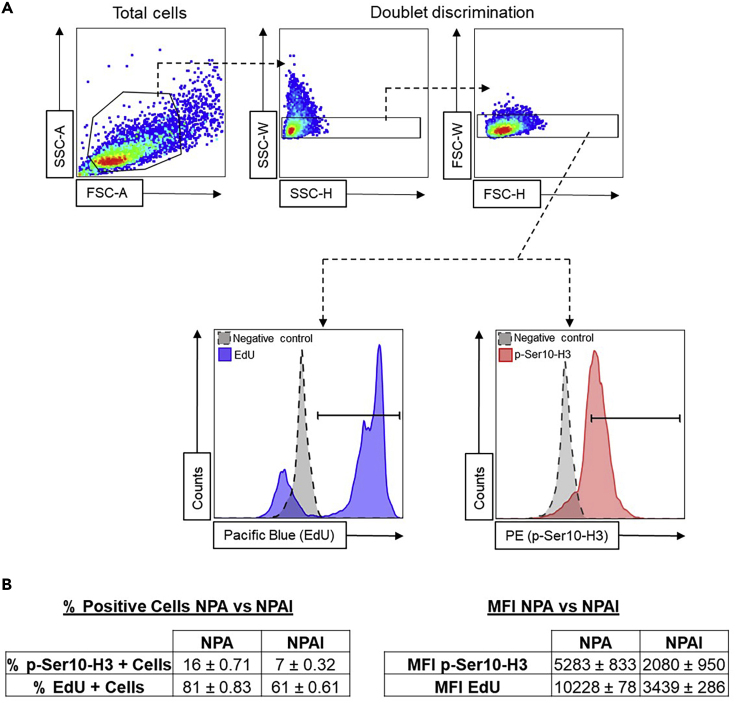
Malignant gliomas are the most common and aggressive primary brain tumor in adults, and high mitotic rates are associated with their malignancy. Gliomas were modeled in mice using the Sleeping Beauty system to encode genetic lesions recapitulating the human disease. The presented workflow allows the study of the proliferation of glioma cells in vivo, enabling the identification of different phases of the cell cycle, with the advantage that 5-ethynyl-2'-deoxyuridine staining does not involve denaturation steps and samples do not require histological processing. For complete details on the use and execution of this protocol, please refer to Núñez et al. (2019).


Conflict of interest statement

DECLARATION OF INTERESTS The authors declare no competing interests.

Figures

None
Graphical abstract
Figure 1
Figure 1
Sleeping Beauty Transposase Method to Model Glioma in Mice (A) Generic plasmid maps used to generate gliomas in mice using the SB transposase method. GFP and Katushka are green and red fluorescent proteins, respectively. miR-30 sequences flank a shRNA encoding sequence designed to silence specific genes. The DNA transposons to be inserted are flanked by inverted repeats/direct repeats (IR/DR), which are recognized by the transposase. (B) These sequences are then randomly integrated into the host genomic DNA sites, between bases T and A. (C) Schematic of a 1 day-old mouse pup, showing the coordinates for plasmid injection into the lateral ventricle, at 1.5 mm rostral and 0.8 mm lateral to the lambda and 1.5 mm ventral. (D) From left to right: bioluminescence scanning of a mouse pup 1 day after SB plasmid injection, when a large tumor has developed (106 photons/s/cm2/sr) and at tumor burden endpoint (107 photons/s/cm2/sr).
Figure 2
Figure 2
Images Depicting Critical Steps of Tumor Dissection and CD45+ Cell Depletion Procedure (A) Images showing a mouse SB-generated glioma under a stereo-zoom microscope equipped with a fluorescent light illumination system. In this example, the tumor was generated with SB plasmids encoding for genes coupled to GFP (middle picture) and Katushka (right picture) expression as reporter genes. Scale bars, 0.5 cm. (B) Image showing a 50 mL conical tube, with a cell strainer on the top and a pestle, used to disintegrate the tumor tissue. (C) Image illustrating MACS CD45-depletion column set up.
Figure 3
Figure 3
Flow Cytometry Gating Strategy Used to Identify EdU+ and p-Ser10-H3+ Glioma Cells (A) Total cells are gated to exclude cellular debris (top left plot). Then, doublet discrimination gating is performed to filter out cellular aggregates (top middle and right plots). Lower panel: Left histogram: glioma cells positive for EdU (black=unstained control, blue=EdU (Pacific Blue staining)). Right histogram: glioma cells positive for p-Ser10-H3 expression (black=unstained control, red=p-Ser10-H3 (PE staining)). (B) Representative results for p-Ser10-H3 and EdU staining of tumor cells isolated from SB gliomas. Tumors were generated by the introduction of the following genetic alterations: NRASG12V overexpression, p53 and Atrx silencing for NPA; or NRASG12V overexpression, p53 and Atrx silencing, and IDH1R132H overexpression for NPAI (Table 1). Results are shown as the % of positive cells (left table) or the median fluorescent intensity (MFI) (right table) ± SD, for each staining. NPAI tumors are less aggressive than NPA tumors and cells show different cell cycle characteristics.

References

    1. Brown D.V., Filiz G., Daniel P.M., Hollande F., Dworkin S., Amiridis S., Kountouri N., Ng W., Morokoff A.P., Mantamadiotis T. Expression of cd133 and cd44 in glioblastoma stem cells correlates with cell proliferation, phenotype stability and intra-tumor heterogeneity. PLoS One. 2017;12:e0172791. - PMC - PubMed
    1. Calinescu A.A., Nunez F.J., Koschmann C., Kolb B.L., Lowenstein P.R., Castro M.G. Transposon mediated integration of plasmid DNA into the subventricular zone of neonatal mice to generate novel models of glioblastoma. J. Vis. Exp. 2015:52443. - PMC - PubMed
    1. Comba A., Dunn P.J., Argento A.E., Kadiyala P., Ventosa M., Patel P., Zamler D.B., Núñez F.J., Zhao L., Castro M.G. Fyn tyrosine kinase, a downstream target of receptor tyrosine kinases, modulates antiglioma immune responses. Neuro Oncol. 2020:noaa006. - PMC - PubMed
    1. Garcia-Fabiani M.B., Comba A., Kadiyala P., Haase S., Núñez F.J., Altshuler D., Lowenstein P.R., Castro M.G. Isolation and characterization of immune cells from the tumor microenvironment of genetically engineered pediatric high-grade glioma models using the sleeping beauty transposon system. Methods Enzymol. 2020;632:369–388. - PMC - PubMed
    1. Kim J.-Y., Jeong H.S., Chung T., Kim M., Lee J.H., Jung W.H., Koo J.S. The value of phosphohistone h3 as a proliferation marker for evaluating invasive breast cancers: A comparative study with ki67. Oncotarget. 2017;8:65064. - PMC - PubMed

Publication types