

Urban Air Pollution May Enhance COVID-19 Case-Fatality and Mortality Rates in the United States
- PMID: 32984861
- PMCID: PMC7505160
- DOI: 10.1016/j.xinn.2020.100047
Urban Air Pollution May Enhance COVID-19 Case-Fatality and Mortality Rates in the United States
Abstract
Background: The novel human coronavirus disease 2019 (COVID-19) pandemic has claimed more than 600,000 lives worldwide, causing tremendous public health, social, and economic damages. Although the risk factors of COVID-19 are still under investigation, environmental factors, such as urban air pollution, may play an important role in increasing population susceptibility to COVID-19 pathogenesis.
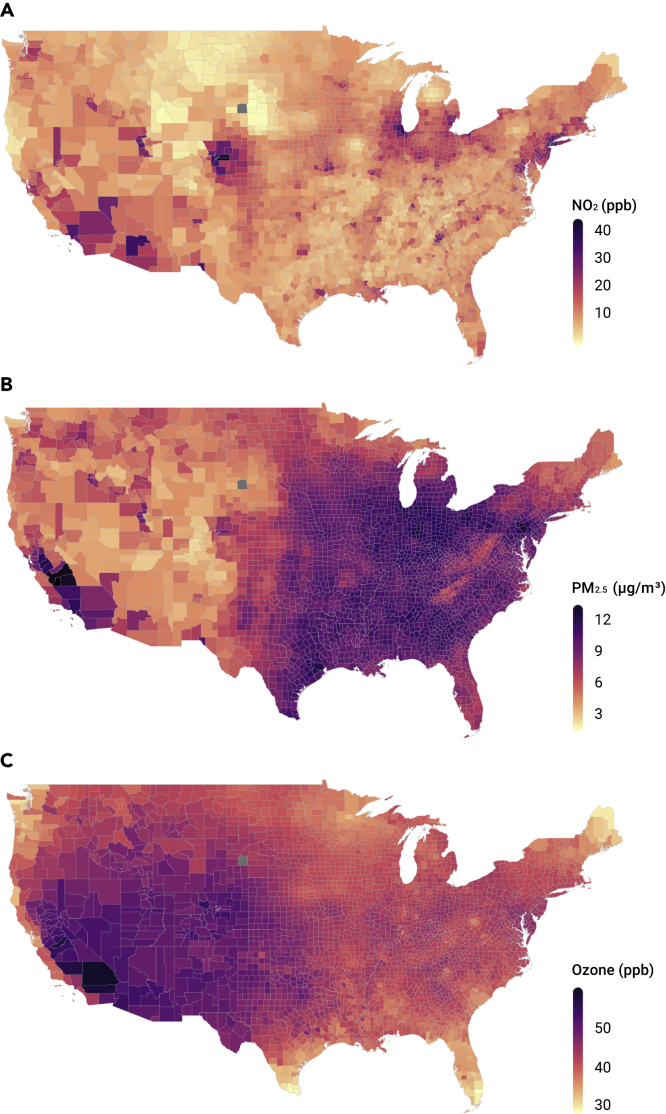
Methods: We conducted a cross-sectional nationwide study using zero-inflated negative binomial models to estimate the association between long-term (2010-2016) county-level exposures to NO2, PM2.5, and O3 and county-level COVID-19 case-fatality and mortality rates in the United States. We used both single- and multi-pollutant models and controlled for spatial trends and a comprehensive set of potential confounders, including state-level test positive rate, county-level health care capacity, phase of epidemic, population mobility, population density, sociodemographics, socioeconomic status, race and ethnicity, behavioral risk factors, and meteorology.
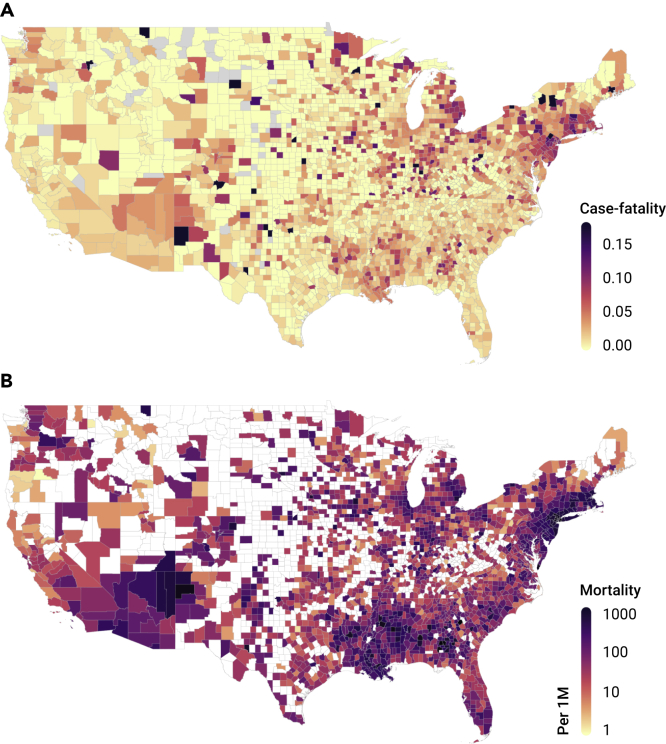
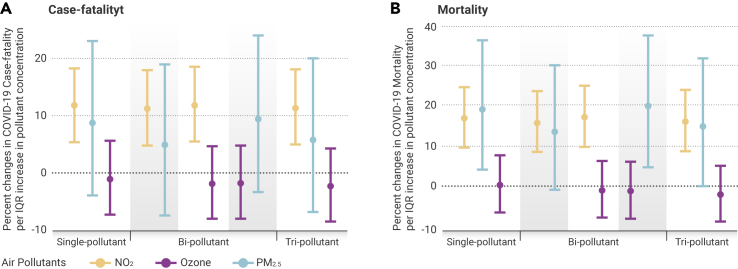
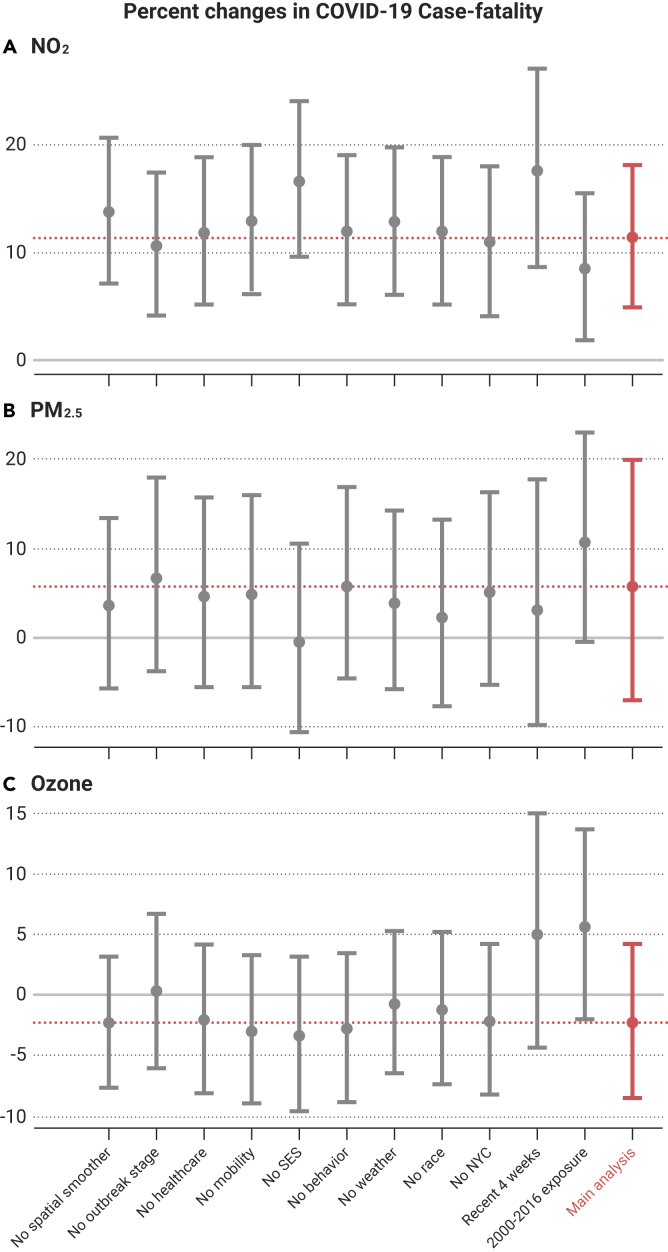
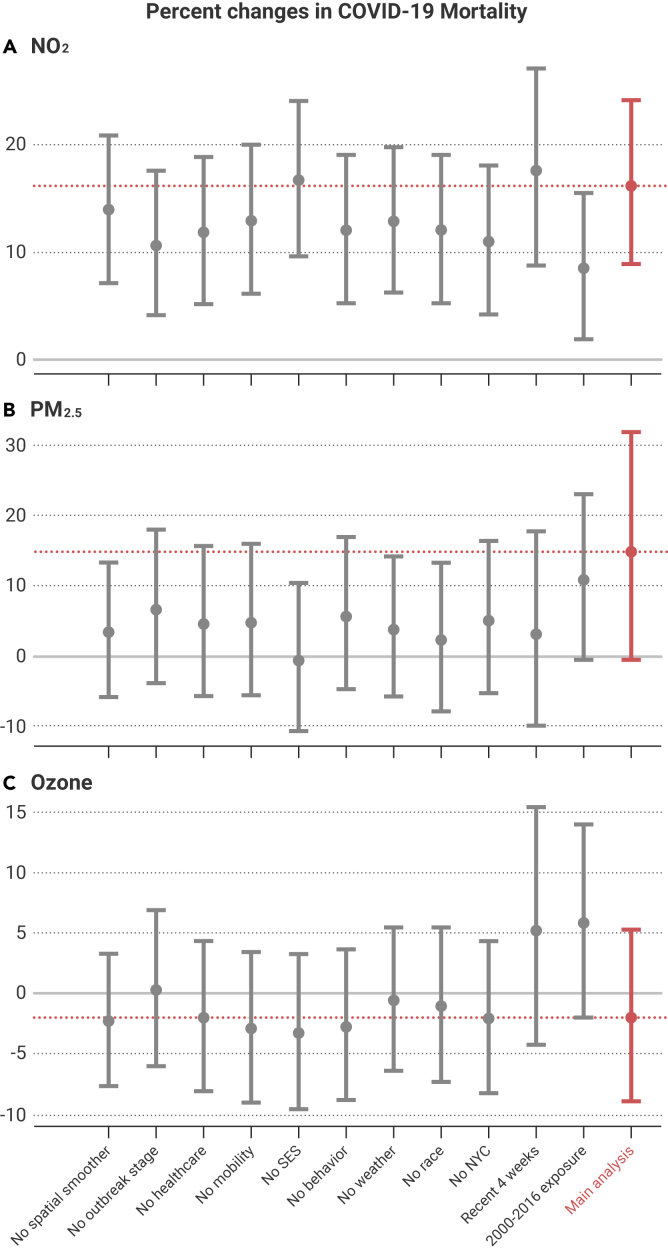
Results: From January 22, 2020, to July 17, 2020, 3,659,828 COVID-19 cases and 138,552 deaths were reported in 3,076 US counties, with an overall observed case-fatality rate of 3.8%. County-level average NO2 concentrations were positively associated with both COVID-19 case-fatality rate and mortality rate in single-, bi-, and tri-pollutant models. When adjusted for co-pollutants, per interquartile-range (IQR) increase in NO2 (4.6 ppb), COVID-19 case-fatality rate and mortality rate were associated with an increase of 11.3% (95% CI 4.9%-18.2%) and 16.2% (95% CI 8.7%-24.0%), respectively. We did not observe significant associations between COVID-19 case-fatality rate and long-term exposure to PM2.5 or O3, although per IQR increase in PM2.5 (2.6 μg/m3) was marginally associated, with a 14.9% (95% CI 0.0%-31.9%) increase in COVID-19 mortality rate when adjusted for co-pollutants.
Discussion: Long-term exposure to NO2, which largely arises from urban combustion sources such as traffic, may enhance susceptibility to severe COVID-19 outcomes, independent of long-term PM2.5 and O3 exposure. The results support targeted public health actions to protect residents from COVID-19 in heavily polluted regions with historically high NO2 levels. Continuation of current efforts to lower traffic emissions and ambient air pollution may be an important component of reducing population-level risk of COVID-19 case fatality and mortality.
Keywords: COVID-19; air pollution; case-fatality rate; mortality; nitrogen dioxide.
© 2020 The Author(s).
Conflict of interest statement
The authors have no conflicts of interest relevant to this article to disclose.
Figures
Update of
-
Urban Air Pollution May Enhance COVID-19 Case-Fatality and Mortality Rates in the United States.medRxiv [Preprint]. 2020 May 7:2020.05.04.20090746. doi: 10.1101/2020.05.04.20090746. medRxiv. 2020. Update in: Innovation (Camb). 2020 Nov 25;1(3):100047. doi: 10.1016/j.xinn.2020.100047. PMID: 32511493 Free PMC article. Updated. Preprint.
References
-
- Onder G., Rezza G., Brusaferro S. Case-fatality rate and characteristics of patients dying in relation to COVID-19 in Italy. JAMA. 2020;323:1775–1776. - PubMed
-
- The New York times. 2020. https://www.nytimes.com/interactive/2020/us/coronavirus-us-cases.html
Grants and funding
LinkOut - more resources
Full Text Sources
