Randomized Controlled Trial
. 2020 Nov;28(11):2073-2077.
doi: 10.1002/oby.22982. Epub 2020 Sep 27.

A Novel Approach to Assess Metabolic Flexibility Overnight in a Whole-Body Room Calorimeter

Affiliations
Randomized Controlled Trial

A Novel Approach to Assess Metabolic Flexibility Overnight in a Whole-Body Room Calorimeter

David H McDougal et al. Obesity (Silver Spring). 2020 Nov.

Abstract

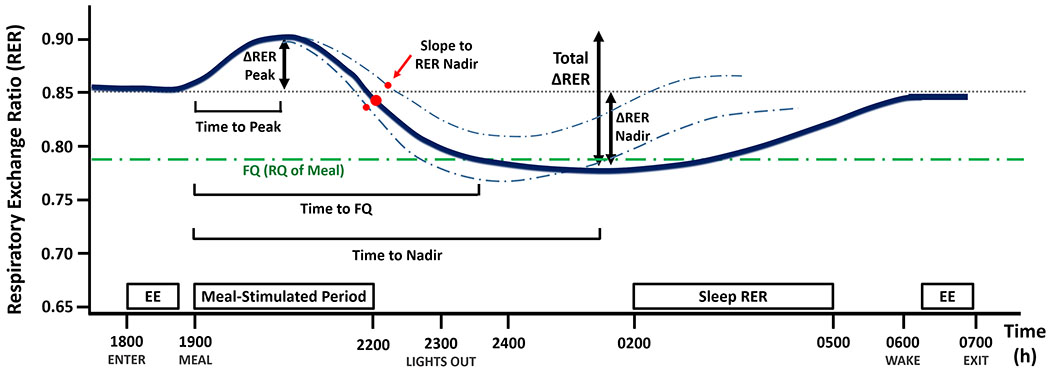
Objective: This study aimed to investigate a novel approach for determining the effects of energy-standardized dinner meals (high-fat and low-fat) on respiratory exchange ratio (RER) dynamics and metabolic flexibility.

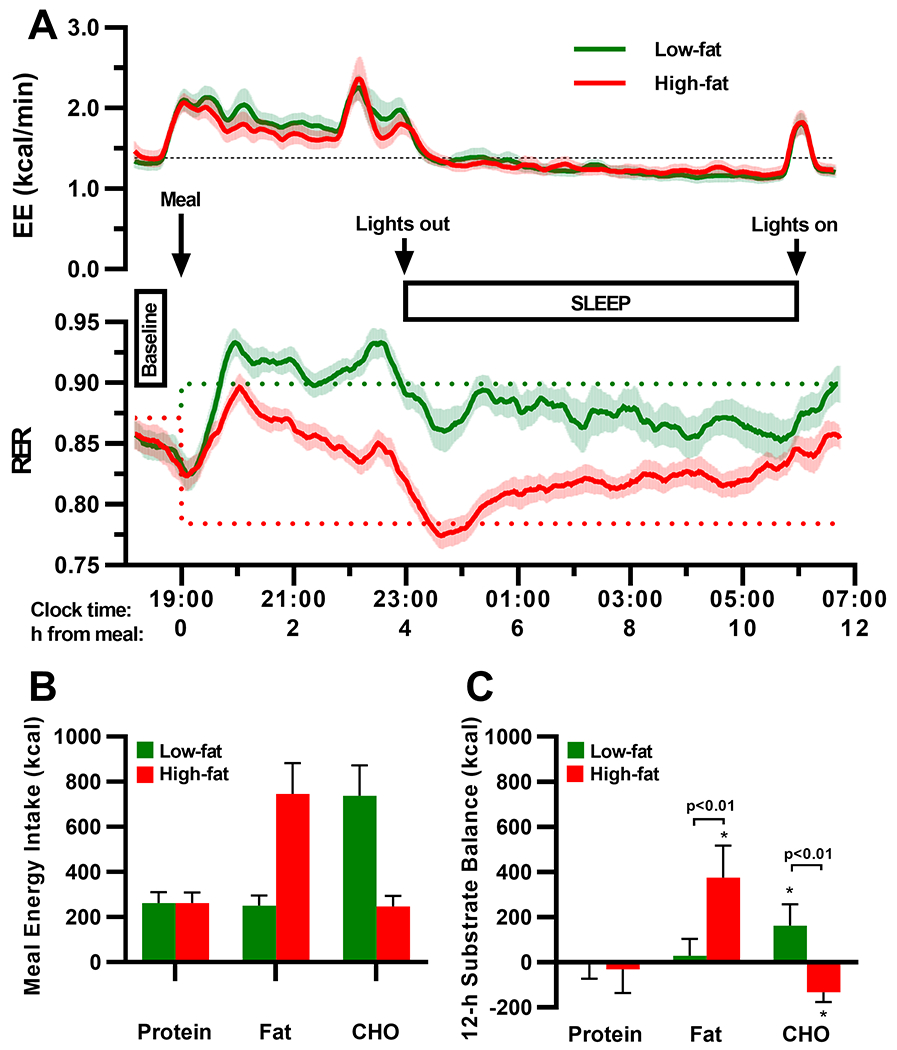
Methods: Using a randomized crossover study design, energy expenditure, RER, and macronutrient oxidation rates were assessed in response to a single dinner meal during an overnight stay in a whole-body room calorimeter. Eight healthy adults completed two overnight chamber stays while fed either a high-fat (60% fat, 20% carbohydrate [CHO], 20% protein; food quotient [FQ] = 0.784) or low-fat (20% fat, 60% CHO, 20% protein; FQ = 0.899) dinner containing 40% of daily energy requirements.

Results: Following the low-fat meal, CHO oxidation first increased before decreasing, resulting in a 12-hour RER:FQ ratio close to 1.0 (0.986 ± 0.019, P = 0.06) and therefore resulting in a 12-hour equilibrated fat balance (29 ± 76 kcal/12 hours). Following the high-fat meal, participants had a RER:FQ ratio above 1.0 (1.061 ± 0.017, P < 0.01), resulting in a significant positive 12-hour fat balance of 376 ± 142 kcal/12 hours. Various RER trajectory parameters were significantly different following the high-fat and low-fat meals.

Conclusions: This proof-of-concept study provides an alternative approach to quantify metabolic flexibility in response to a high-fat dinner and it can be used to derive indexes of metabolic flexibility, such as the 12-hour RER:FQ ratio or the 12-hour fat balance.


Conflict of interest statement

Disclosures: The authors declare no conflicts of interest.

Figures

Figure 1.
Figure 1.
Proposed overnight RER parameters for assessing metabolic flexibility after a meal. Parameters are defined as follows: i) the meal-stimulated rise in RER (∆RER Peak); ii) the subsequent fall in RER during the night (∆RER Nadir) relative to each individual’s baseline RER; iii) the difference between the higher and the lower RER (total ∆RER); iv) time to peak RER; v) time to nadir RER; vi) slope to RER nadir (the slope between the peak and nadir of RER); and vii) time for RER to reach FQ. The solid blue line represents a hypothetical mean RER over time trace, while the dashed blue lines represent hypothetical individual RER traces with different slope to RER nadir. Abbreviations: RER, respiratory exchange ratio; EE, resting energy expenditure; FQ, food quotient.
Figure 2.
Figure 2.
Changes in energy expenditure (EE), respiratory exchange ratio (RER), and substrate balance during an overnight stay in a whole-body room calorimeter following a low-fat or a high-fat isocaloric dinner meal. Although 12-h EE, baseline RER, and baseline EE were similar between the low-fat (green trace) and high-fat (red trace) conditions (A), RER diverged significantly following the two dinner meal conditions (A, lower panel). The alterations in RER were reflective of the low fat-to-carbohydrate (CHO) ratio in low-fat dinner, and the high fat-to-CHO ratio in the high-fat dinner (B). Yet, the increased fat oxidation rate was insufficient to prevent a 12-h positive fat balance following the high-fat dinner (panel C). Upper panels (A): Plotted values were based on 20-min moving averages as a smoothing method; solid lines represent the mean, and shade areas represent the standard deviation of the mean. Dotted lines indicate baseline EE (black) and food quotient (FQ) of the test meals (green, low-fat; red, high-fat). Bottom panels (B,C): Values are expressed as mean±SD. P-values were generated from comparing the differences between least squares means in the low-fat and high-fat conditions derived from a linear mixed effect model controlling for sequence and period effects; * indicates values that were significantly different from zero (p<0.05).

References

    1. Kelley DE, Mandarino LJ. Fuel selection in human skeletal muscle in insulin resistance: a reexamination. Diabetes 2000;49: 677–683. - PubMed
    1. Galgani JE, Moro C, Ravussin E. Metabolic flexibility and insulin resistance. American journal of physiology Endocrinology and metabolism 2008;295: E1009–1017. - PMC - PubMed
    1. Rachek LI. Chapter Eight - Free Fatty Acids and Skeletal Muscle Insulin Resistance In: Tao Y-X (ed). Progress in Molecular Biology and Translational Science. Academic Press, 2014, pp 267–292. - PubMed
    1. Sangwung P, Petersen KF, Shulman GI, Knowles JW. Mitochondrial dysfunction, insulin resistance and potential genetic implications. Endocrinology 2020. - PMC - PubMed
    1. Ukropcova B, Sereda O, de Jonge L, Bogacka I, Nguyen T, Xie H, et al. Family History of Diabetes Links Impaired Substrate Switching and Reduced Mitochondrial Content in Skeletal Muscle. Diabetes 2007;56: 720–727. - PubMed

Publication types

LinkOut - more resources