PLA2G16 is a mutant p53/KLF5 transcriptional target and promotes glycolysis of pancreatic cancer
- PMID: 32985124
- PMCID: PMC7686977
- DOI: 10.1111/jcmm.15832
PLA2G16 is a mutant p53/KLF5 transcriptional target and promotes glycolysis of pancreatic cancer
Abstract
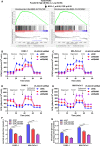
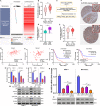
PLA2G16 is a member of the phospholipase family that catalyses the generation of lysophosphatidic acids (LPAs) and free fatty acids (FFAs) from phosphatidic acid. In the current study, we explored the functional role of PLA2G16 in pancreatic adenocarcinoma (PAAD) and the genetic/epigenetic alterations leading to its dysregulation. Bioinformatic analysis was performed using data from The Cancer Genome Atlas (TCGA), Genotype-Tissue Expression (GTEx) and the Human Protein Atlas (HPA). Then, PANC-1 and MIA-PaCa-2 cells harbouring TP53 mutations were used for cellular and animal studies. Results showed that PL2G16 expression was significantly up-regulated in PAAD tissue and was associated with unfavourable survival. PLA2G16 inhibition suppressed pancreatic cell growth in vitro and in vivo and also inhibited aerobic glycolysis. Bioinformatic analysis indicated that KLF5 was positively correlated with PLA2G16 expression in PAAD tumours with TP53 mutation. TP53 or KLF5 inhibition significantly reduced PLA2G16 expression at both mRNA and protein levels. Dual-luciferase and chromatin Immunoprecipitation-quantitative polymerase chain reaction assays showed that KLF5 directly bound to the PLA2G16 promoter and activated its transcription. Co-immunoprecipitation assay indicated that mutant p53 had a physical interaction with KLF5. Inhibition of mutant p53 impaired the transcriptional activating effects of KLF5. In PAAD cases in TCGA, PLA2G16 expression was positively correlated with its copy number (Pearson's r = 0.51, P < 0.001), but was strongly and negatively correlated with the methylation level of cg09518969 (Pearson's r = -0.64, P < 0.001), a 5'-cytosine-phosphodiester bond-guanine-3' site within its gene locus. In conclusion, this study revealed a novel mutant p53/KLF5-PLA2G16 regulatory axis on tumour growth and glycolysis in PAAD.
Keywords: KLF5; PLA2G16; glycolysis; mutant p53; pancreatic cancer.
© 2020 The Authors. Journal of Cellular and Molecular Medicine published by Foundation for Cellular and Molecular Medicine and John Wiley & Sons Ltd.
Conflict of interest statement
The authors have no conflict of interest.
Figures


Similar articles
-
The roles and regulation of the KLF5 transcription factor in cancers.Cancer Sci. 2021 Jun;112(6):2097-2117. doi: 10.1111/cas.14910. Epub 2021 May 3. Cancer Sci. 2021. PMID: 33811715 Free PMC article. Review.
-
Pla2g16 phospholipase mediates gain-of-function activities of mutant p53.Proc Natl Acad Sci U S A. 2014 Jul 29;111(30):11145-50. doi: 10.1073/pnas.1404139111. Epub 2014 Jul 14. Proc Natl Acad Sci U S A. 2014. PMID: 25024203 Free PMC article.
-
Irradiation of 125I seeds blocks glycolysis in pancreatic cancer by inhibiting KLF5 m6A methylation through the suppression of RBM15.Exp Cell Res. 2025 May 1;448(1):114538. doi: 10.1016/j.yexcr.2025.114538. Epub 2025 Mar 25. Exp Cell Res. 2025. PMID: 40147709
-
ARHGAP25 Inhibits Pancreatic Adenocarcinoma Growth by Suppressing Glycolysis via AKT/mTOR Pathway.Int J Biol Sci. 2021 Apr 24;17(7):1808-1820. doi: 10.7150/ijbs.55919. eCollection 2021. Int J Biol Sci. 2021. PMID: 33994864 Free PMC article.
-
KLF5, a Novel Therapeutic Target in Squamous Cell Carcinoma.DNA Cell Biol. 2021 Dec;40(12):1503-1512. doi: 10.1089/dna.2021.0674. DNA Cell Biol. 2021. PMID: 34931868 Review.
Cited by
-
p53-Mediated Indirect Regulation on Cellular Metabolism: From the Mechanism of Pathogenesis to the Development of Cancer Therapeutics.Front Oncol. 2022 May 30;12:895112. doi: 10.3389/fonc.2022.895112. eCollection 2022. Front Oncol. 2022. PMID: 35707366 Free PMC article. Review.
-
The roles and regulation of the KLF5 transcription factor in cancers.Cancer Sci. 2021 Jun;112(6):2097-2117. doi: 10.1111/cas.14910. Epub 2021 May 3. Cancer Sci. 2021. PMID: 33811715 Free PMC article. Review.
-
Organoid in droplet: Production of uniform pancreatic cancer organoids from single cells.Mater Today Bio. 2025 Apr 12;32:101765. doi: 10.1016/j.mtbio.2025.101765. eCollection 2025 Jun. Mater Today Bio. 2025. PMID: 40270893 Free PMC article.
-
Interference with PLA2G16 promotes cell cycle arrest and apoptosis and inhibits the reprogramming of glucose metabolism in multiple myeloma cells by modulating the Hippo/YAP signaling pathway.Anticancer Drugs. 2024 Nov 1;35(10):902-911. doi: 10.1097/CAD.0000000000001642. Epub 2024 Jul 22. Anticancer Drugs. 2024. PMID: 39012720 Free PMC article.
-
Ginsenoside Rg3 increases gemcitabine sensitivity of pancreatic adenocarcinoma via reducing ZFP91 mediated TSPYL2 destabilization.J Ginseng Res. 2022 Sep;46(5):636-645. doi: 10.1016/j.jgr.2021.08.004. Epub 2021 Aug 30. J Ginseng Res. 2022. PMID: 36090681 Free PMC article.
References
-
- Siegel RL, Miller KD, Jemal A. Cancer statistics, 2019. CA Cancer J Clin. 2019;69(1):7‐34. - PubMed
-
- Husmann K, Sers C, Fietze E, Mincheva A, Lichter P, Schafer R. Transcriptional and translational downregulation of H‐REV107, a class II tumour suppressor gene located on human chromosome 11q11‐12. Oncogene. 1998;17(10):1305‐1312. - PubMed
-
- Sers C, Husmann K, Nazarenko I, et al. The class II tumour suppressor gene H‐REV107‐1 is a target of interferon‐regulatory factor‐1 and is involved in IFNgamma‐induced cell death in human ovarian carcinoma cells. Oncogene. 2002;21(18):2829‐2839. - PubMed
MeSH terms
Substances
LinkOut - more resources
Full Text Sources
Medical
Molecular Biology Databases
Research Materials
Miscellaneous

