. 2020 Sep 28;10(1):15918.
doi: 10.1038/s41598-020-72575-6.

Data-driven malaria prevalence prediction in large densely populated urban holoendemic sub-Saharan West Africa

Affiliations

Data-driven malaria prevalence prediction in large densely populated urban holoendemic sub-Saharan West Africa

Biobele J Brown et al. Sci Rep. .

Abstract

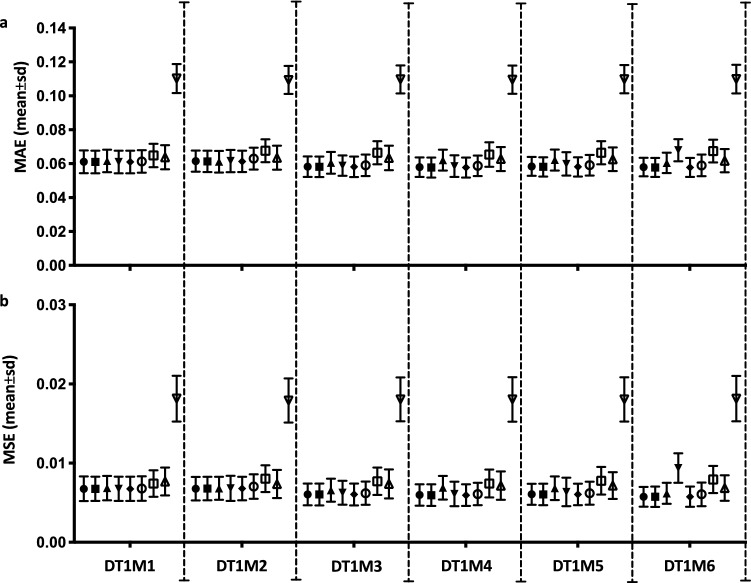
Over 200 million malaria cases globally lead to half-million deaths annually. The development of malaria prevalence prediction systems to support malaria care pathways has been hindered by lack of data, a tendency towards universal "monolithic" models (one-size-fits-all-regions) and a focus on long lead time predictions. Current systems do not provide short-term local predictions at an accuracy suitable for deployment in clinical practice. Here we show a data-driven approach that reliably produces one-month-ahead prevalence prediction within a densely populated all-year-round malaria metropolis of over 3.5 million inhabitants situated in Nigeria which has one of the largest global burdens of P. falciparum malaria. We estimate one-month-ahead prevalence in a unique 22-years prospective regional dataset of > 9 × 10⁴ participants attending our healthcare services. Our system agrees with both magnitude and direction of the prediction on validation data achieving MAE ≤ 6 × 10⁻², MSE ≤ 7 × 10⁻³, PCC (median 0.63, IQR 0.3) and with more than 80% of estimates within a (+ 0.1 to - 0.05) error-tolerance range which is clinically relevant for decision-support in our holoendemic setting. Our data-driven approach could facilitate healthcare systems to harness their own data to support local malaria care pathways.


Conflict of interest statement

The authors declare no competing interests.

Figures

Figure 1
Figure 1
Study site geolocation and its monthly burden of malaria from 1996 to 2017. (a) Left and Centre: geographical location of the third largest urban large densely populated setting in Nigeria, the City of Ibadan. Right: Ibadan’s urban boundary; dropped-pin shows location of UCH Ibadan; red-balls shows location of primary and community centers. Images from Google Map data: Google, Maxar Technologies. By providing the previous attribution Google allows publishing of their images for non-commercial open access license as specified in their guidelines (https://www.google.com/permissions/geoguidelines/). (b) Ibadan dataset 3D surface-plot showing monthly mean malaria prevalence (y-axis and heat map); month (x-axis); year (z-axis) from 1996 to 2017.
Figure 2
Figure 2
Machine learning algorithms parametrization, evaluation and model selection on the Ibadan training DTRAS dataset. DTRAS, Ibadan Dataset Training Set [from 1996 to 2014]; EN, elastic net; LASSO, least absolute shrinkage and selection operator; RR, ridge regression; LARS, least angle regression; AIC, akaike information criterion; BIC, Bayesian information criterion; SVR, support vector regression; α, regularization strength parameter; C, SVR margin parameter; γ, SVR sigma gaussian-kernel parameter; MAE, mean absolute error; MSE, mean square error; X, features; y, true prevalence; y^, predicted prevalence. 1Using fivefold cross validation; 2L1Ratio = 0.5.
Figure 3
Figure 3
MAE and MSE errors of used machine learning approaches on training DTRAS dataset. (a) Mean and Standard Deviation MAE. (b) Mean and Standard Deviation MSE. Algorithms in order from left to right per each regression task DT1M1–DT1M2: EN (filled circles); LASSO (filled squares); RR (filled up-triangles); LASSO-LARS (filled down-triangles); LASSO-LARS-AIC (empty circles); LASSO-LARS-BIC (empty squares); RF (empty up-triangles) and SVR (empty down-triangles). DTRAS Ibadan Dataset Training Set [from 1996 to 2014], EN elastic net, LASSO least absolute shrinkage and selection operator, RR ridge regression, LARS LEAST ANGLE REGRESSION, AIC Akaike information criterion, BIC Bayesian information criterion, SVR support vector regression, MAE mean absolute error, MSE mean square error.
Figure 4
Figure 4
The Region-specific Elastic Net based Malaria Prevalence prediction System (REMPS). (a) REMPS regularization strength and L1-norm ratio model selection on training DTRAS dataset. (b) REMPS validation on DVALS dataset. DTRAS, Ibadan Dataset Training Set [from 1996 to 2014]; DVALS, Ibadan Dataset Validation Set [from 2015 to 2017]; α, regularization strength parameter; MAE, mean absolute error; MSE, mean square error; X, features; y, true prevalence; y^, predicted prevalence. 1Using fivefold cross validation.
Figure 5
Figure 5
REMPS performance and best parameters range on training DTRAS dataset. (a) Mean and Standard Deviation MAE. (b) Mean and Standard Deviation MSE. (c) Mean and Standard Deviation of regularization strength parameter α. (d) Median and Interquartile Range of L1/L2 norm ratio parameter L1Ratio. DTRAS Ibadan Dataset Training Set [from 1996 to 2014], MAE mean absolute error, MSE mean square error, pre prevalence.
Figure 6
Figure 6
REMPS performance on validation set DVALS. Final REMPS system yearly MAE, MSE and PCC on 2015 (filled orange circles), 2016 (filled orange squares) and 2017 (filled orange triangles) DVALS validation set on all regression tasks DT1M1–DT1M6. DVALS Ibadan Dataset Validation Set [from 2015 to 2017], MAE mean absolute error, MSE mean square error, PCC Pearson correlation coefficient, pre prevalence.
Figure 7
Figure 7
Scatter 2D plots of REMPS true and predicted prevalence on validation set DVALS. For all validation years 2015, 2016, 2017 and all regression tasks DT1M1–DT1M6. x-axis: true prevalence value y; y-axis: EN predicted prevalence value y^; red dots = dry season; blue dots = rainy season. DVALS Ibadan Dataset Validation Set [from 2015 to 2017]. Continuous black line = simple linear regression best fit line. Curved non-continuous lines = 95 CI of best fit line.
Figure 8
Figure 8
(a) REMPS predicted prevalence on validation set within regionally relevant tolerance-error. REMPS predicted prevalence for all validation years 2015, 2016, 2017 and all regression tasks DT1M1 to DT1M6 (orange, blue, red, purple, green, yellow filled squares respectively) plotted against the true prevalence value (black circles) and true prevalence value + 0.1 to − 0.05 tolerance-error (shaded grey area). (b) Mean REMPS prediction performance in % (y-axis) on validation set for each of the regression tasks DT1M1–DT1M6 (x-axis).

Similar articles

Cited by

References

    1. World Health Organization. World Malaria Report 2017. https://www.who.int/malaria/publications/world-malaria-report-2017/en/ (2017).
    1. World Health Organization. World Malaria Report 2018. https://www.who.int/malaria/publications/world-malaria-report-2018/en/ (2018).
    1. World Health Organisation. Malaria in children under five. https://www.who.int/malaria/areas/high_risk_groups/children/en/ (2018).
    1. World Health Organization. Global Technical Strategy for Malaria 2016–2030. Resolution WHA68.2. https://www.who.int/malaria/areas/global_technical_strategy/en/ (2015).
    1. World Health Organization. Overview of malaria surveillance. https://www.who.int/malaria/areas/surveillance/overview/en/ (2015).

Publication types