

Multilineage murine stem cells generate complex organoids to model distal lung development and disease
- PMID: 32985719
- PMCID: PMC7604576
- DOI: 10.15252/embj.2019103476
Multilineage murine stem cells generate complex organoids to model distal lung development and disease
Abstract
Organoids derived from mouse and human stem cells have recently emerged as a powerful tool to study organ development and disease. We here established a three-dimensional (3D) murine bronchioalveolar lung organoid (BALO) model that allows clonal expansion and self-organization of FACS-sorted bronchioalveolar stem cells (BASCs) upon co-culture with lung-resident mesenchymal cells. BALOs yield a highly branched 3D structure within 21 days of culture, mimicking the cellular composition of the bronchioalveolar compartment as defined by single-cell RNA sequencing and fluorescence as well as electron microscopic phenotyping. Additionally, BALOs support engraftment and maintenance of the cellular phenotype of injected tissue-resident macrophages. We also demonstrate that BALOs recapitulate lung developmental defects after knockdown of a critical regulatory gene, and permit modeling of viral infection. We conclude that the BALO model enables reconstruction of the epithelial-mesenchymal-myeloid unit of the distal lung, thereby opening numerous new avenues to study lung development, infection, and regenerative processes in vitro.
Keywords: BALO; BASC; lung organoids; stem cells.
© 2020 The Authors. Published under the terms of the CC BY 4.0 license.
Conflict of interest statement
The authors declare that they have no conflict of interest.
Figures
- A
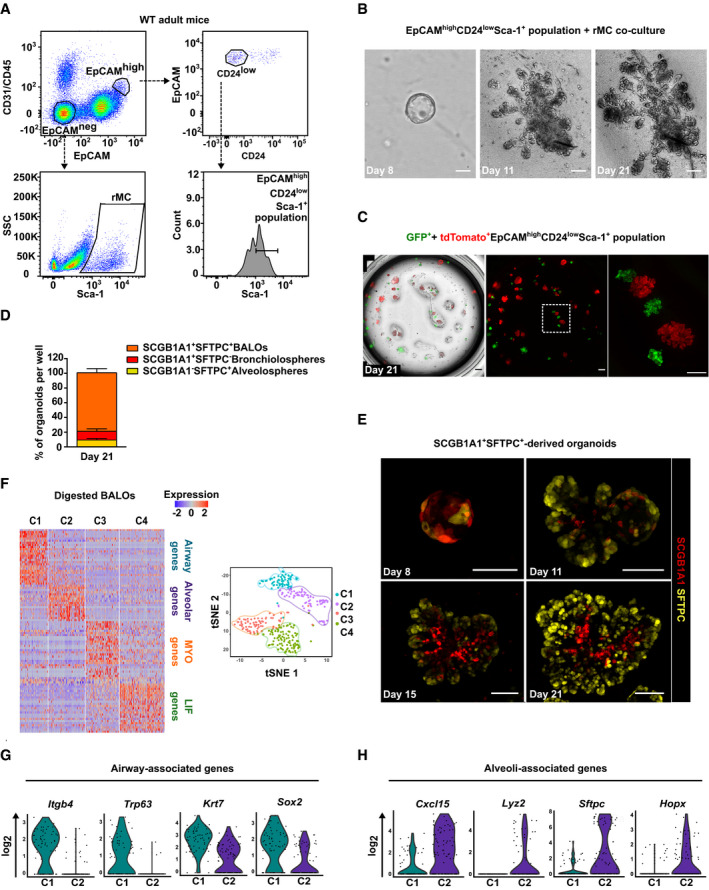
Gating strategy for sorting of EpCAMhighCD24lowSca‐1+ cells and rMC from lung homogenate of adult mice.
- B
Time course of epithelial stem/progenitor cell proliferation and differentiation within BALO at days 8, 11, and 21 of co‐culture with rMC.
- C
Clonal expansion of EpCAMhighCD24lowSca‐1+ cells derived from either GFP‐expressing mice or tdTomato‐expressing mice at day 21 of co‐culture.
- D
Percentages of SCGB1A1+SFTPC+ (BALOs), SCGB1A1+SFTPC− (bronchiolospheres), and SCGB1A1−SFTPC+ (alveolospheres) organoids per well at day 21 of culture derived from EpCAMhighCD24lowSca‐1+ cells isolated from Scgb1a1 mCherry Sftpc YFP reporter mice (n = 4 biological replicates).
- E
Representative confocal images of days 8–21 of culture showing endogenous SCGB1A1 and SFTPC expression during BALO formation derived from EpCAMhighCD24lowSca‐1+SCGB1A1+SFTPC+ cells isolated from Scgb1a1 mCherry Sftpc YFP reporter mice.
- F–H
Heat map (left) and tSNE plot (right) (F) of digested day 21 BALO cultures depicting four distinct clusters (C1, airway, blue; C2, alveolar, purple; C3, MYO, orange; and C4, LIF, green). Violin plots of selected genes representing airway‐associated genes (G) (Itgb4, Trp63, Krt7, and Sox2) and alveoli‐associated genes (H) (Cxcl15, Lyz2, Sftpc, and Hopx). Each violin plot shows the frequency distribution of the mean transcript level (log2).
- A, B
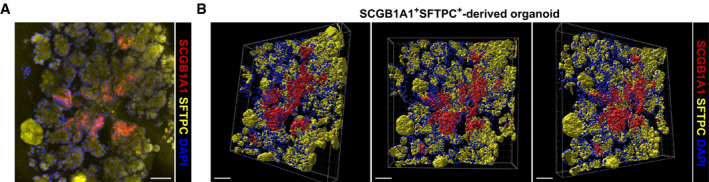
Representative confocal picture (A) and 3D reconstruction (B) of a day 21 culture showing endogenous SCGB1A1 and SFTPC expression within BALO derived from EpCAMhighCD24lowSca‐1+SCGB1A1+SFTPC+ cells isolated from Scgb1a1 mCherry Sftpc YFP reporter mice. Scale bars represent 50 μm.
- A
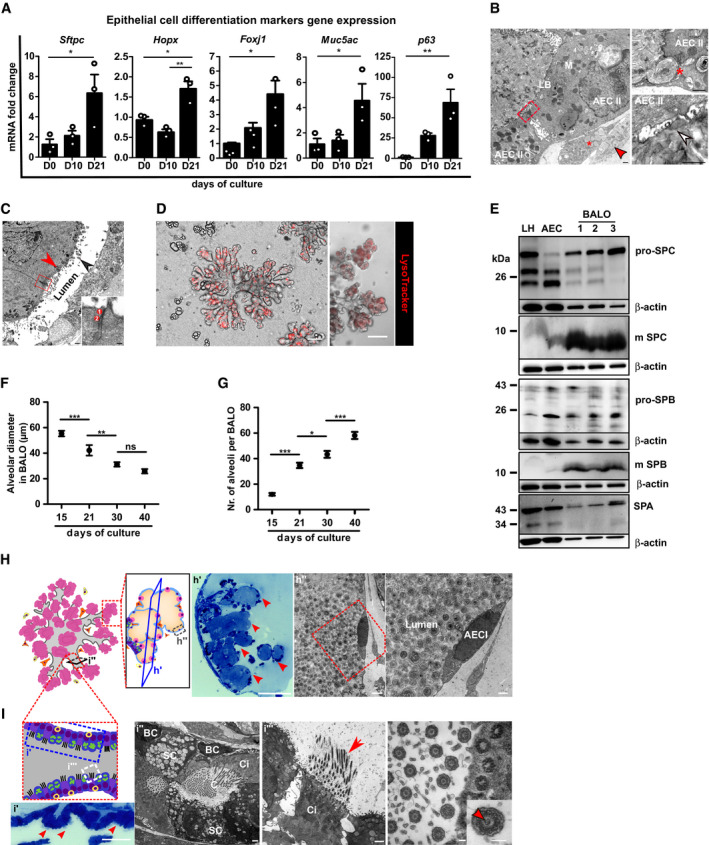
mRNA expression analysis of epithelial cell differentiation markers Sftpc (AEC II), Hopx (AEC I), Foxj1 (ciliated cells), Muc5ac (secretory cells), and p63 (basal cells) in BALO at days 0, 10, and 21 of culture (n = 3 biological replicates with pooled cells from 4 cultures per replicate).
- B
Electron microscopy of BALO alveoli showing two cuboidal epithelial cells (AEC II) connected by tight junctions (red square) with numerous mitochondria (M) and lamellar bodies (LB). A LIF with numerous lipid droplets (*) and a MYO with cisterns of rough ER (red arrow) are located at the basal side (left). The alveolar lumen is filled with lamellar surfactant including tubular myelin (white arrow) (lower right). Exocytosis of a lamellar body (*) from an AEC II (upper right). Scale bars indicate 500 nm.
- C
Electron microscopy of bronchiolar‐like airway depicting columnar ciliated cells (red arrowhead) with basal bodies (black arrowhead) at the left side of the longitudinally sectioned lumen. The boxed area indicates an apical junctional complex between two ciliated cells: 1 = tight junction and 2 = adherens junction. Scale bar indicates 500 nm (in insert: 100 nm).
- D
Staining of lamellar bodies in BALO with RFP LysoTracker. Scale bars represent 100 μm.
- E
Western blot analysis of the surfactant proteins: pro‐SPC, mature SPC, pro‐SPB, mature SPB, and SPA in lung homogenate (LH), AEC, and day 21 BALO (n = 3 biological replicates).
- F, G
Alveolar diameter (F) and number of alveoli (G) in tdTomato+ BALO at days 15, 21, 30, and 40 of culture were measured from n = 5 BALOs in n = 3 biological replicates BALOs.
- H, I
Representative scheme and images of day 40 BALO alveoli (H) and airway (I). BALO alveolar‐like structures (H) are shown (h′) (red arrowheads) in semi‐thin section (0.5 μm) stained with Toluidine blue. Scale bar indicates 100 μm (left). Electron microscopy showing AEC I (h″) ultrastructure within BALO. Scale bars indicate 2,500 nm (center) and 1,000 nm (right). An airway‐like structure (i′) is shown with secretory and ciliated cells (red arrowheads) in semi‐thin sections (0.5 μm) longitudinally cut and stained with Toluidine blue. Scale bar indicates 50 μm (far left). Electron microscopy of a bronchiolar‐like airway (I) depicting pseudostratified epithelium (i″) with a basal‐like cell (BC), not reaching the lumen in which cilia (C) are seen, located between a secretory (SC) and a ciliated cell (Ci). Scale bars indicate 1,000 nm (left and right). Mature cilia (i‴) in BALO at higher magnification depicting the 9 × 2 + 2 structure with central doubled microtubules (insert, red arrowhead), a characteristic for motile cilia. Scale bar indicates 100 nm (far right).
- A, B
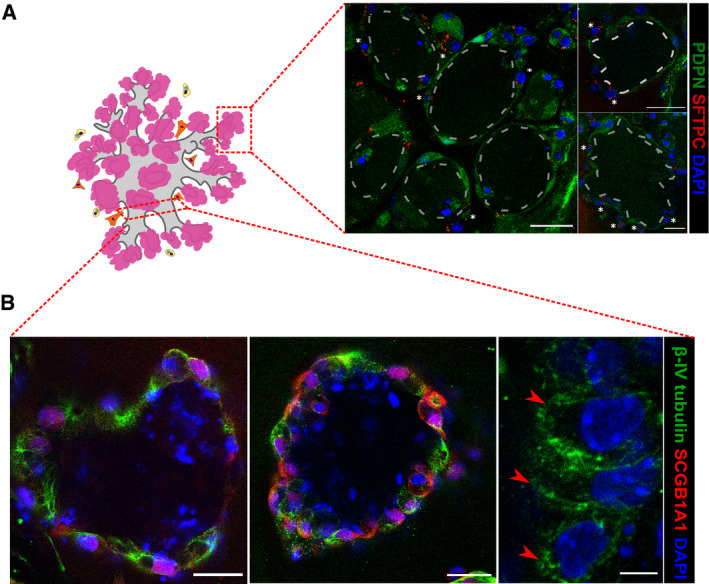
Representative scheme and confocal images of the BALO alveolar‐like (A) and airway‐like (B) structures. (A) Representative image of AEC II SFTPC staining (white asterisks) and AEC I endogenous PDPN expression in day 28 BALO isolated from the lungs of Pdpn GFP reporter mice. Scale bars represent 25 μm. Dotted lines indicate the alveoli. (B) Representative fluorescence images of BALO's airway‐like structures stained for β‐IV tubulin+ ciliated cells (red arrowheads) and SCGB1A1+ club cells. Scale bars represent 25 μm (left and middle) and 5 μm (right).
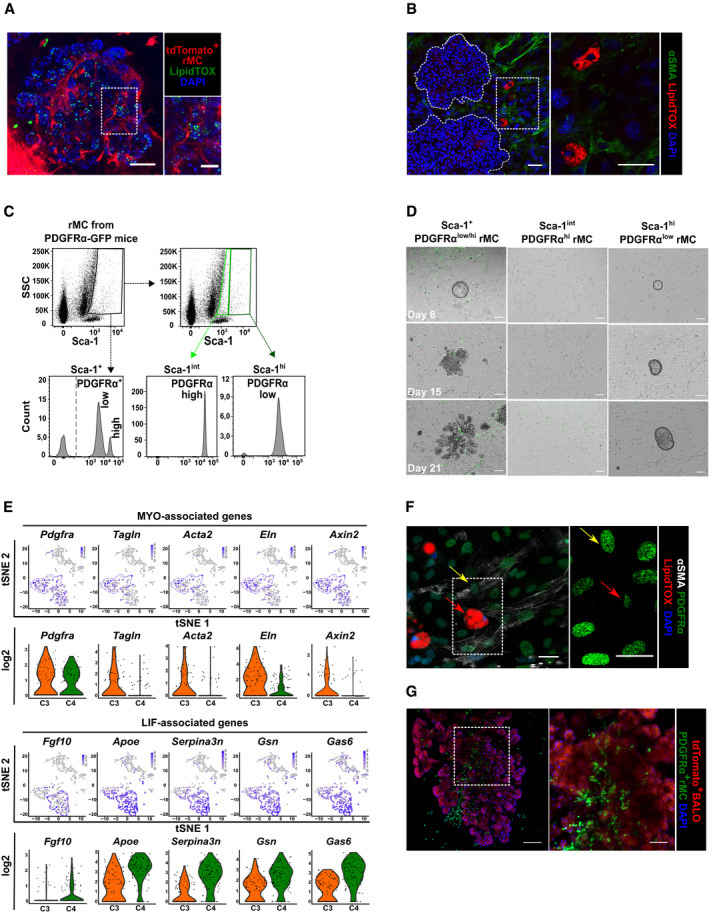
Representative images of day 21 BALO and tdTomato+ rMC stained with LipidTOX (green). Scale bar represents 100 μm.
Fluorescence images of αSMA (green) and neutral lipids (LipidTOX red) staining in WT‐derived rMC and BALO (dotted lines indicate single BALO or insert) at day 21 of culture. Scale bars represent 50 μm (left) and 25 μm (right).
Representative flow cytometric dot plots and histograms of PDGFRα expression in rMC (EpCAM−CD45−CD31−Sca‐1+) isolated from the lung homogenate of Pdgfra GFP reporter mice.
Representative images of BALO formation at day 8, 15, and 21 of co‐culture. WT BASCs were co‐cultivated with sorted rMC (total PDGFRα+ population) or rMC expressing either low or high levels of PDGFRα‐GFP. Scale bars represent 100 μm.
tSNE plots and violin plots depicting selected genes representing MYO (Pdgfrα, Tagln, Acta2, Eln, and Axin2) (top panels) and LIF‐associated genes (Fgf10, Apoe, Serpina3n, Gsn, and Gas6) (bottom panels). Each violin plot shows the frequency distribution of the mean transcript level (log2). C3 (MYO, orange) and C4 (LIF, green) refer to the scRNA‐Seq experiment in Fig 1G.
Fluorescence image of αSMA+PDGFRαhigh MYO (yellow arrows) and LipidTOX+PDGFRαlow LIF (red arrows) from sorted PDGFRα‐GFP rMC after 21 days of BALO culture. Scale bars represent 50 μm (left) and 25 μm (right).
Fluorescence image containing PDGFRαhigh MYO from sorted PDGFRα‐GFP rMC within BALO derived from tdTomato+ mice at day 21 of culture. Scale bars represent 100 μm (left) and 50 μm (right).
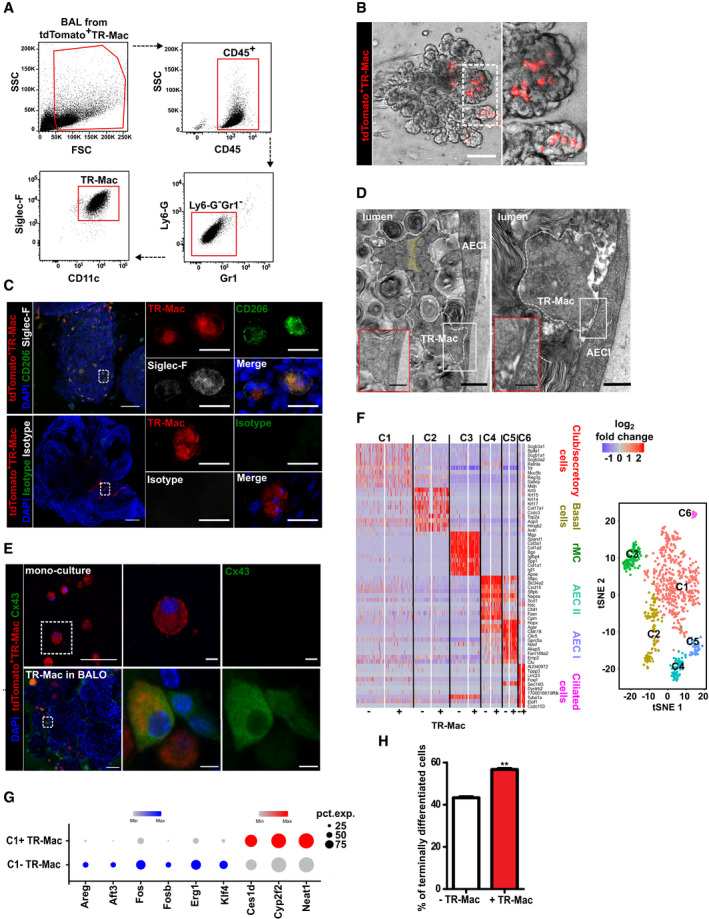
Gating strategy to define TR‐Mac from BAL of adult tdTomato+ mice.
Representative images of BALO after microinjection of tdTomato+ TR‐Mac at day 14. TR‐Mac are preferentially found in alveoli (right). Scale bars represent 100 μm (left) and 50 μm (right).
Fluorescence confocal images of CD206, Siglec‐F, and isotype control staining 14 days after tdTomato+ TR‐Mac microinjection in a day 28 BALO. Scale bars represent 100 μm (left) and 25 μm (right).
Electron microscopy depicting filopodium of TR‐Mac (white dashed lines) with a characteristic actin filament bundle (yellow background) (left panel) in contact with AEC I within BALO alveolar‐like structures. Uptake of surfactant by TR‐Mac is depicted by a (*). Scale bar indicates 1,000 nm (left, in insert: 500 nm) and 500 nm (right, in insert: 250 nm).
Representative confocal images of Cx43 staining in tdTomato+ TR‐Mac monoculture in Matrigel and tdTomato+ TR‐Mac microinjected at day 14 and analyzed in a mature day 21 BALO. Scale bars represent 50 μm (overview) and 5 μm (close up).
Heat map (left) and tSNE plot (right) of the comparative analysis of digested day 23 BALO cultures with (+) and without (−) microinjected TR‐Mac depicting six distinct clusters (C1, club/secretory cells, red; C2, basal cells, yellow; C3, rMC, green; C4, AEC II, blue; C5, AEC I, purple; and C6, ciliated cells, pink).
Expression data dot plots of genes found differentially regulated in cluster C1 between day 23 BALO with (C1+) and without (C1−) microinjected TR‐Mac. The circle size illustrates the number of cells expressing a specific gene.
Percentage of terminally differentiated cells (AEC I and ciliated cells) in day 23 BALO cultures with (+) and without (−) microinjected TR‐Mac.
- A
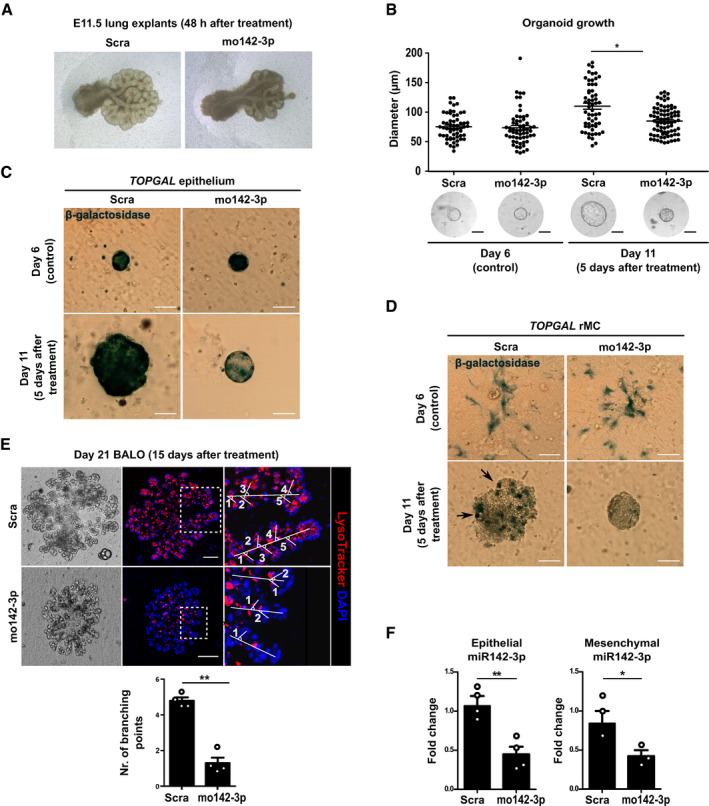
Representative images of E11.5 lung explants after treatment for 48 h with 100 μM Scra or mo142‐3p reveal reduced size and branching morphogenesis after miR‐142-3p knockdown.
- B
Organoid diameter (n = 30–50 per group) in μm before addition of 4 μM Scra or mo142‐3p at day 6 (control) and 5 days after treatment (at day 11 BALO culture) in n = 3 biological replicates.
- C, D
Representative images of β‐galactosidase staining in TOPGAL epithelium (C) and TOPGAL rMC (D) BALO cultures before (day 6, control) or 5 days after treatment with either 4 μM Scra or mo142‐3p (day 11 of co‐culture). BASCs and rMC were isolated from the lung homogenate of TOPGAL mice. β‐galactosidase+ rMC at day 11 of culture are indicated with arrows.
- E
Representative transmission and confocal images after LysoTracker staining indicating branching and number of branching points in n = 4 BALOs 15 days after treatment with 4 μM Scra or mo142‐3p (day 21 of co‐culture) in n = 3 biological replicates.
- F
mRNA levels of epithelial and mesenchymal miR‐142-3p expression in Scra and mo142‐3p-treated organoids 5 days after treatment (n = 3–4 biological replicates with pooled cells from 4 cultures per replicate).
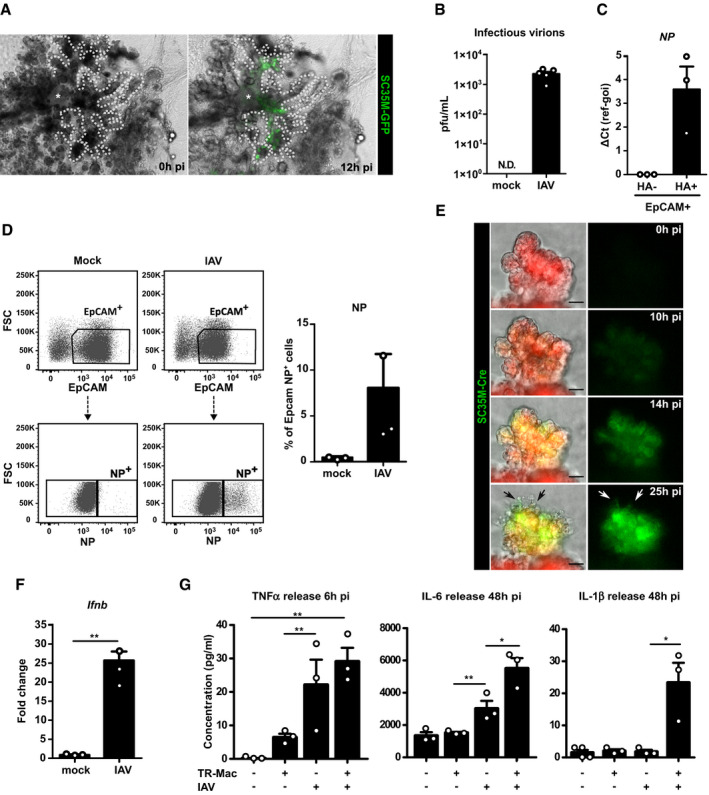
Representative images of day 21 BALO after microinjection of SC35M‐GFP IAV (green) into the central airway‐like (*) after 0 and 12 h pi visualize IVA spread to the alveolar‐like regions. Dotted lines illustrate BALO borders. Scale bars represent 100 μm.
Quantification of plaque‐forming units in supernatants from mock or SC35M IAV‐infected BALO 48 h after infection (n = 5 biological replicates). N.D.: not detectable.
Relative NP expression in PR8 IAV‐infected (HA+) or non‐infected (HA−) epithelial cells isolated from BALOs 48 h pi, FACS‐sorted according to EpCAM and HA expression (n = 3 biological replicates with pooled cells from 4 cultures per replicate).
Representative flow cytometric data showing the percentage of EpCAM+NP+ cells in mock‐ and SC35M IAV‐infected BALOs at 48 h pi in n = 3 biological replicates with pooled cells from 4 cultures per replicate.
Representative fluorescence images of a day 21 distal region in BALO generated from mTmG reporter mouse and infected by SC35M‐Cre IAV after 0, 10, 14, and 25 h. Arrows indicate cell death. Scale bars represent 25 and 10 μm in the insert.
mRNA expression of Ifnb in mock and PR8 IAV‐infected BALOs at 48 h pi (n = 3 biological replicates with pooled cells from 4 cultures per replicate).
Release of TNF‐α (6 h pi), IL‐6 (48 h pi), and IL‐1β (48 h pi) detected by Bio‐Plex® Multiplex immunoassay in the supernatant of mock and IAV‐infected BALO cultures with and without TR‐Mac (n = 3 biological replicates).
Comment in
-
BALO: a "mini lung" model to study cell-cell interactions.EMBO J. 2020 Nov 2;39(21):e106697. doi: 10.15252/embj.2020106697. Epub 2020 Oct 1. EMBO J. 2020. PMID: 33001445 Free PMC article.
Similar articles
-
Human airway organoid engineering as a step toward lung regeneration and disease modeling.Biomaterials. 2017 Jan;113:118-132. doi: 10.1016/j.biomaterials.2016.10.046. Epub 2016 Oct 28. Biomaterials. 2017. PMID: 27815996 Free PMC article.
-
Endothelialized Bronchioalveolar Lung Organoids Model Endothelial Cell Responses to Injury.Am J Respir Cell Mol Biol. 2025 Feb;72(2):124-132. doi: 10.1165/rcmb.2023-0373MA. Am J Respir Cell Mol Biol. 2025. PMID: 39226154
-
Engineering de novo assembly of fetal pulmonary organoids.Tissue Eng Part A. 2014 Nov;20(21-22):2892-907. doi: 10.1089/ten.TEA.2014.0085. Epub 2014 Jun 25. Tissue Eng Part A. 2014. PMID: 24825442 Free PMC article.
-
Organogenesis of adult lung in a dish: Differentiation, disease and therapy.Dev Biol. 2016 Dec 15;420(2):278-286. doi: 10.1016/j.ydbio.2016.10.002. Epub 2016 Oct 3. Dev Biol. 2016. PMID: 27713058 Review.
-
Bronchioalveolar stem cells in lung repair, regeneration and disease.J Pathol. 2020 Nov;252(3):219-226. doi: 10.1002/path.5527. Epub 2020 Oct 1. J Pathol. 2020. PMID: 32737996 Review.
Cited by
-
Advanced lung organoids for respiratory system and pulmonary disease modeling.J Tissue Eng. 2024 Feb 22;15:20417314241232502. doi: 10.1177/20417314241232502. eCollection 2024 Jan-Dec. J Tissue Eng. 2024. PMID: 38406820 Free PMC article. Review.
-
Novel Approach Methodologies in Modeling Complex Bioaerosol Exposure in Asthma and Allergic Rhinitis Under Climate Change.Expert Rev Mol Med. 2025 Mar 12;27:e13. doi: 10.1017/erm.2025.7. Expert Rev Mol Med. 2025. PMID: 40070355 Free PMC article. Review.
-
WASP: a versatile, web-accessible single cell RNA-Seq processing platform.BMC Genomics. 2021 Mar 18;22(1):195. doi: 10.1186/s12864-021-07469-6. BMC Genomics. 2021. PMID: 33736596 Free PMC article.
-
Alveolar macrophages in tissue homeostasis, inflammation, and infection: evolving concepts of therapeutic targeting.J Clin Invest. 2023 Oct 2;133(19):e170501. doi: 10.1172/JCI170501. J Clin Invest. 2023. PMID: 37781922 Free PMC article. Review.
-
Activation of TLRs by Opportunistic Fungi in Lung Organoids.Methods Mol Biol. 2023;2700:271-284. doi: 10.1007/978-1-0716-3366-3_16. Methods Mol Biol. 2023. PMID: 37603187
References
Publication types
MeSH terms
Substances
Grants and funding
LinkOut - more resources
Full Text Sources
Other Literature Sources
Medical
Molecular Biology Databases
