Withdrawal of medications leads to worsening of OGTT parameters in youth with impaired glucose tolerance or recently-diagnosed type 2 diabetes
- PMID: 32985775
- PMCID: PMC7642167
- DOI: 10.1111/pedi.13129
Withdrawal of medications leads to worsening of OGTT parameters in youth with impaired glucose tolerance or recently-diagnosed type 2 diabetes
Abstract
Background: The RISE Pediatric Medication Study compared strategies for preserving β-cell function, including a 9-month follow-up after treatment withdrawal to test treatment effect durability.
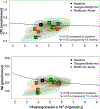
Objective: Evaluate OGTT measures of glucose and β-cell response through 12 months of intervention and 9 months of medication washout.
Participants: Youth (n = 91) aged 10 to 19 years with BMI ≥85th percentile and impaired glucose tolerance (IGT) or recently diagnosed type 2 diabetes (T2D).
Methods: A multicenter randomized clinical trial comparing insulin glargine for 3 months followed by metformin for 9 months (G→Met) or metformin alone (Met) for 12 months. We report within-group changes from baseline to end of medication intervention (M12), baseline to 9 months post-medication withdrawal (M21), and end of medication (M12) to M21. OGTT C-peptide index [CPI] paired with 1/fasting insulin evaluated β-cell response.
Results: At M12, both treatments were associated with stable fasting glucose (G→Met baseline 6.0 ± 0.1 vs M12 5.9 ± 0.2 mmol/L, P = .62; Met baseline 6.1 ± 0.2 vs M12 6.0 ± 0.2 mmol/L, P = .73) and 2-hour glucose (G→Met baseline 10.2 ± 0.4 vs M12 9.3 ± 0.5 mmol/L, P = .03; Met baseline 10.2 ± 0.4 vs M12 10.6 ± 0.6 mmol/L, P = .88). Following medication withdrawal, fasting glucose worsened (G→Met M21 8.6 ± 1.8, P = .004; Met M21 7.8 ± 0.7 mmol/L, P = .003), as did 2-hour glucose (G→Met M21 13.2 ± 1.4, P = .002; Met M21 13.1 ± 1.2 mmol/L, P = .006), associated with declines in β-cell response.
Conclusions: G→Met and Met were associated with stable glucose measures during 12 months of treatment in youth with IGT or recently diagnosed T2D. Glucose and β-cell response worsened post-medication withdrawal, suggesting treatment must be long-term or alternative treatments pursued.
Trial registration: ClinicalTrials.gov NCT01779375.
Keywords: glucose tolerance; impaired glucose tolerance; insulin glargine; insulin response; insulin secretion; insulin sensitivity; medication; metformin; pediatric; prediabetes; type 2 diabetes; β-cell.
© 2020 John Wiley & Sons A/S. Published by John Wiley & Sons Ltd.
Conflict of interest statement
Conflict of Interest Disclosure: S.A.A. and S.E.K. serve as paid consultants on advisory boards for Novo Nordisk. S.E.K. is a member of a steering committee for a Novo Nordisk sponsored clinical trial. S.A.A. is a participant in a Novo Nordisk-sponsored clinical trial. T.A.B. has received research support from Allergan and Apollo Endosurgery. No other potential conflicts of interest relevant to this article were reported.
Figures


Similar articles
-
Impact of Insulin and Metformin Versus Metformin Alone on β-Cell Function in Youth With Impaired Glucose Tolerance or Recently Diagnosed Type 2 Diabetes.Diabetes Care. 2018 Aug;41(8):1717-1725. doi: 10.2337/dc18-0787. Epub 2018 Jun 25. Diabetes Care. 2018. PMID: 29941500 Free PMC article. Clinical Trial.
-
Restoring Insulin Secretion (RISE): design of studies of β-cell preservation in prediabetes and early type 2 diabetes across the life span.Diabetes Care. 2014;37(3):780-8. doi: 10.2337/dc13-1879. Epub 2013 Nov 5. Diabetes Care. 2014. PMID: 24194506 Free PMC article. Clinical Trial.
-
Lack of Durable Improvements in β-Cell Function Following Withdrawal of Pharmacological Interventions in Adults With Impaired Glucose Tolerance or Recently Diagnosed Type 2 Diabetes.Diabetes Care. 2019 Sep;42(9):1742-1751. doi: 10.2337/dc19-0556. Epub 2019 Jun 9. Diabetes Care. 2019. PMID: 31178434 Free PMC article.
-
Baseline Predictors of Glycemic Worsening in Youth and Adults With Impaired Glucose Tolerance or Recently Diagnosed Type 2 Diabetes in the Restoring Insulin Secretion (RISE) Study.Diabetes Care. 2021 Sep;44(9):1938-1947. doi: 10.2337/dc21-0027. Epub 2021 Jun 15. Diabetes Care. 2021. PMID: 34131048 Free PMC article. Clinical Trial.
-
Impaired glucose tolerance and insulin resistance in heart failure: underrecognized and undertreated?J Card Fail. 2010 Sep;16(9):761-8. doi: 10.1016/j.cardfail.2010.05.027. Epub 2010 Jul 21. J Card Fail. 2010. PMID: 20797600 Review.
Cited by
-
Beta Cell Dysfunction in Youth- and Adult-Onset Type 2 Diabetes: An Extensive Narrative Review with a Special Focus on the Role of Nutrients.Nutrients. 2023 May 7;15(9):2217. doi: 10.3390/nu15092217. Nutrients. 2023. PMID: 37432389 Free PMC article. Review.
-
Metformin therapy in pediatric type 2 diabetes mellitus and its comorbidities: A review.Front Endocrinol (Lausanne). 2023 Feb 6;13:1072879. doi: 10.3389/fendo.2022.1072879. eCollection 2022. Front Endocrinol (Lausanne). 2023. PMID: 36814831 Free PMC article. Review.
-
Diabetic kidney disease in children and adolescents: an update.Pediatr Nephrol. 2022 Nov;37(11):2583-2597. doi: 10.1007/s00467-021-05347-7. Epub 2021 Dec 16. Pediatr Nephrol. 2022. PMID: 34913986 Free PMC article. Review.
References
-
- Weng J, Li Y, Xu W, Shi L, Zhang Q, Zhu D, et al. (2008) Effect of intensive insulin therapy on beta-cell function and glycaemic control in patients with newly diagnosed type 2 diabetes: a multicentre randomised parallelgroup trial. Lancet 371(9626):1753–1760. - PubMed
Publication types
MeSH terms
Substances
Associated data
Grants and funding
- UL1 TR000430/TR/NCATS NIH HHS/United States
- U01 DK094406/DK/NIDDK NIH HHS/United States
- UL1 TR001863/TR/NCATS NIH HHS/United States
- U01 DK094430/DK/NIDDK NIH HHS/United States
- UL1-TR-000430/NH/NIH HHS/United States
- P30 DK045735/DK/NIDDK NIH HHS/United States
- U01-DK-094467/NH/NIH HHS/United States
- UL1-TR-001857/NH/NIH HHS/United States
- UL1 TR001082/TR/NCATS NIH HHS/United States
- UL1-TR-001858/NH/NIH HHS/United States
- P30 DK017047/DK/NIDDK NIH HHS/United States
- UL1 TR001857/TR/NCATS NIH HHS/United States
- UL1-TR-001855/NH/NIH HHS/United States
- U01 DK094431/DK/NIDDK NIH HHS/United States
- VA/VA/United States
- P30-DK-097512/NH/NIH HHS/United States
- UL1-TR-001108/NH/NIH HHS/United States
- U01-DK-094438/NH/NIH HHS/United States
- TL1 TR001858/TR/NCATS NIH HHS/United States
- U01-DK-094406/NH/NIH HHS/United States
- UL1 TR001108/TR/NCATS NIH HHS/United States
- U01-DK-094430/NH/NIH HHS/United States
- U01 DK094438/DK/NIDDK NIH HHS/United States
- U01 DK094467/DK/NIDDK NIH HHS/United States
- P30 DK097512/DK/NIDDK NIH HHS/United States
- UL1-TR-001863/NH/NIH HHS/United States
- P30-DK-017047/NH/NIH HHS/United States
- K24 HL145076/HL/NHLBI NIH HHS/United States
- P30-DK-045735/NH/NIH HHS/United States
- U01-DK-094431/NH/NIH HHS/United States
- UL1-TR-001082/NH/NIH HHS/United States
- UL1 TR001855/TR/NCATS NIH HHS/United States
- P30-DK-020595/NH/NIH HHS/United States
- P30 DK020595/DK/NIDDK NIH HHS/United States
LinkOut - more resources
Full Text Sources
Medical
Miscellaneous

