

Differential effects of right and left heart failure on skeletal muscle in rats
- PMID: 32985798
- PMCID: PMC7749622
- DOI: 10.1002/jcsm.12612
Differential effects of right and left heart failure on skeletal muscle in rats
Abstract
Background: Exercise intolerance is a cardinal symptom in right (RV) and left ventricular (LV) failure. The underlying skeletal muscle contributes to increased morbidity in patients. Here, we compared skeletal muscle sarcopenia in a novel two-stage model of RV failure to an established model of LV failure.
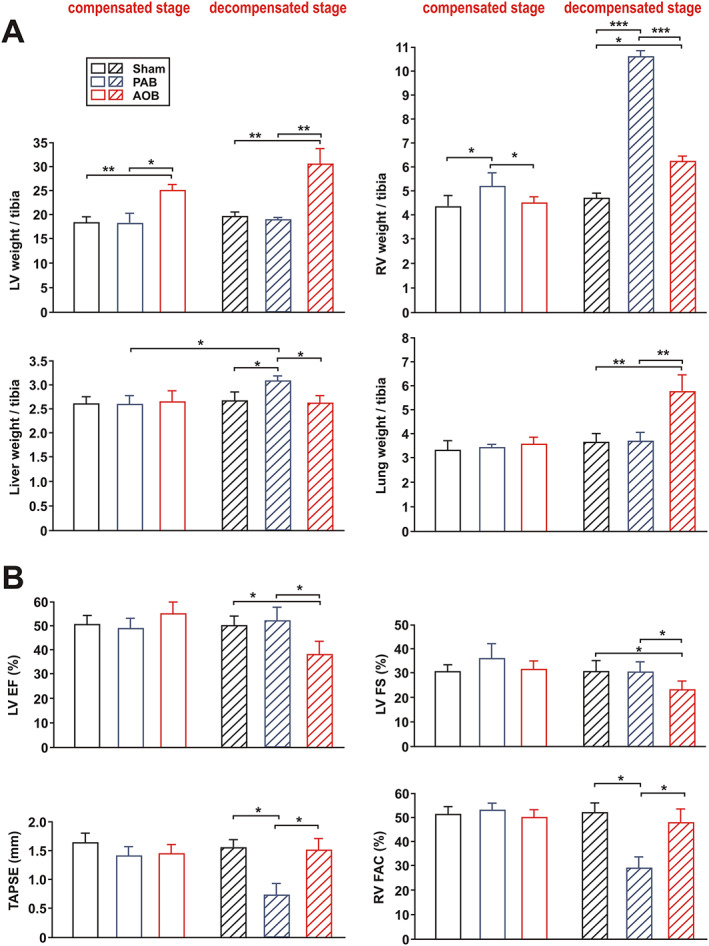
Methods: Pulmonary artery banding (PAB) or aortic banding (AOB) was performed in weanling rats, inducing a transition from compensated cardiac hypertrophy (after 7 weeks) to heart failure (after 22-26 weeks). Cardiac function was characterized by echocardiography. Skeletal muscle catabolic/anabolic balance and energy metabolism were analysed by histological and biochemical methods, real-time PCR, and western blot.
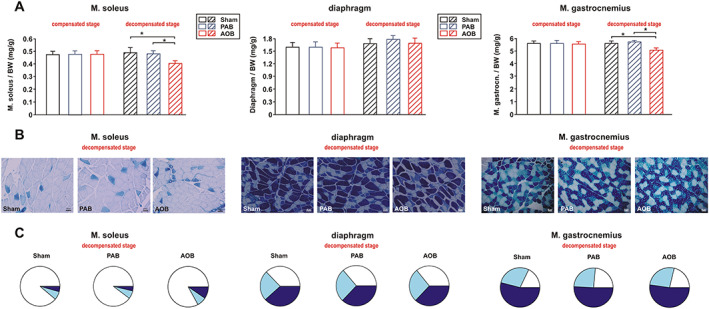
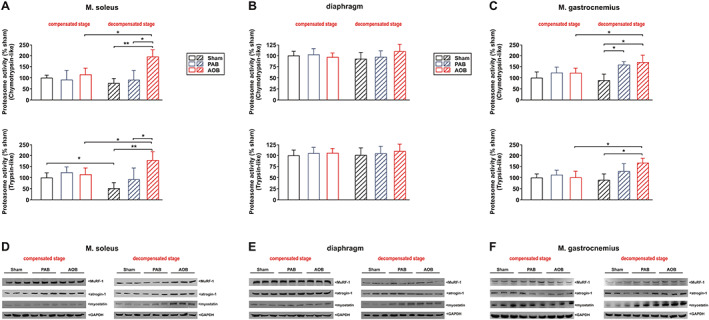
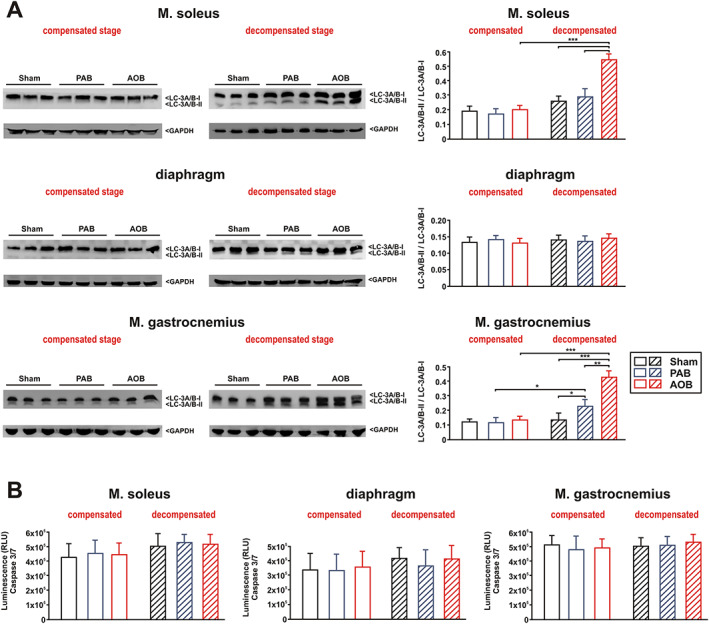
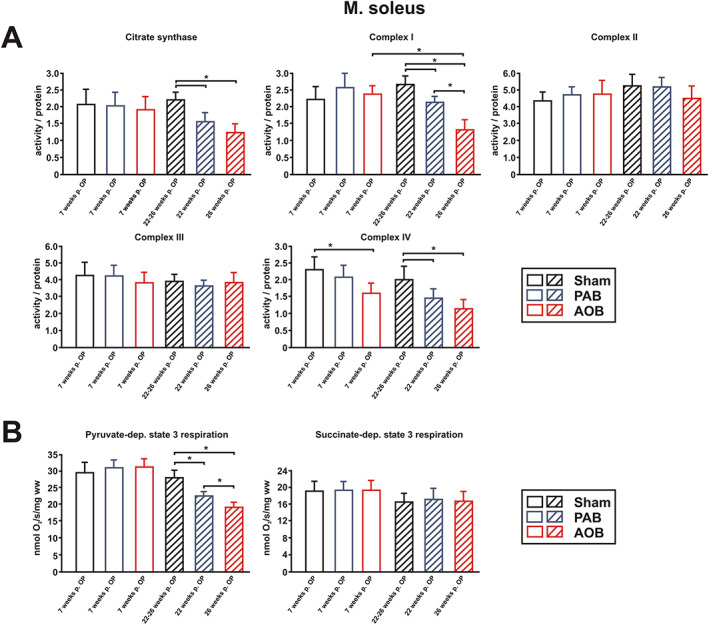
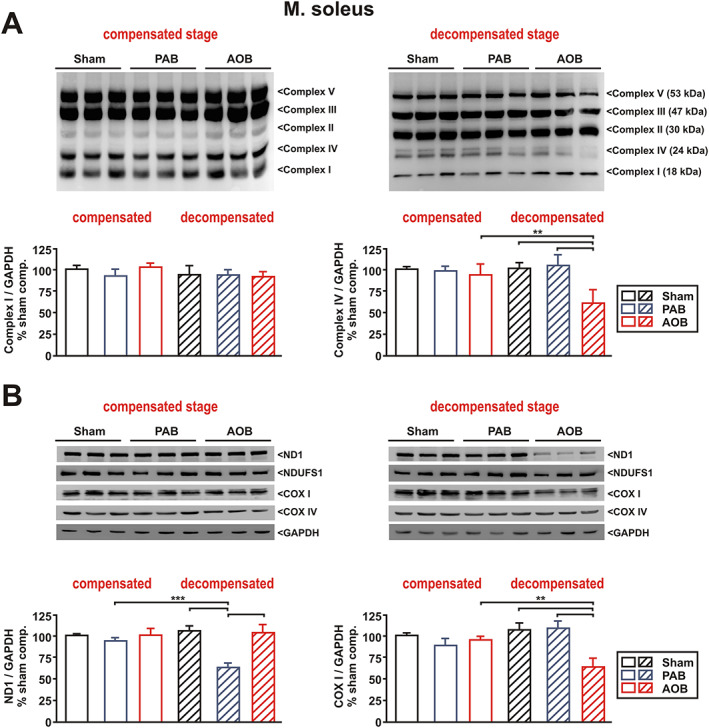
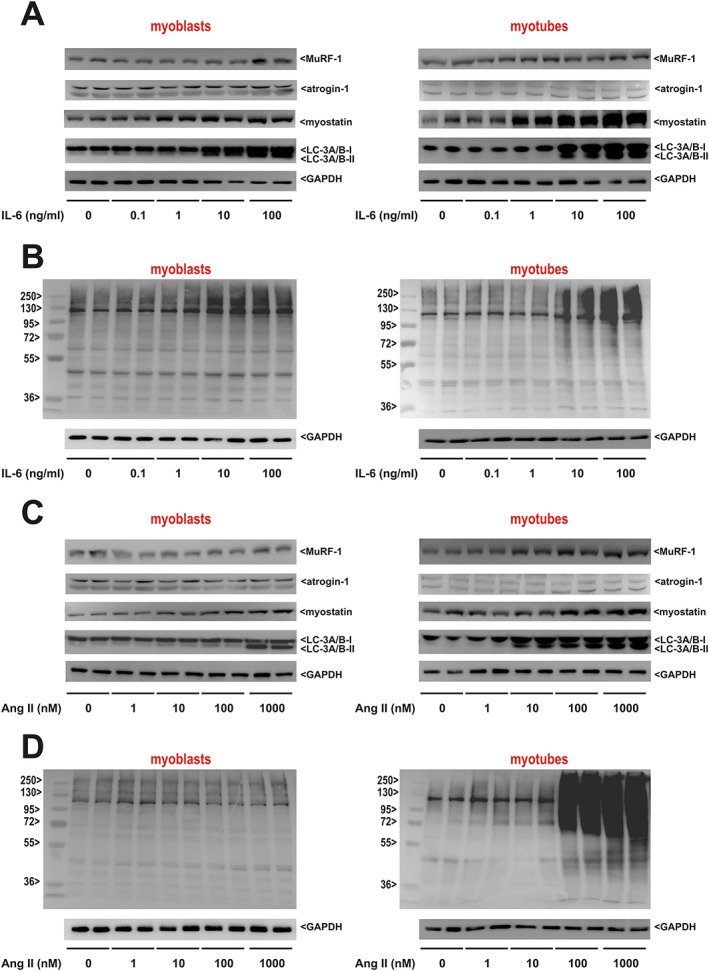
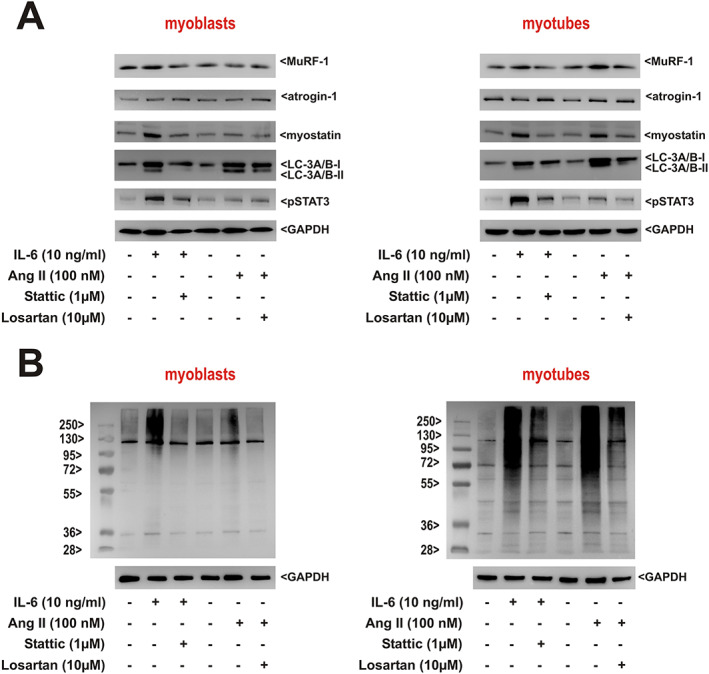
Results: Two clearly distinguishable stages of left or right heart disease with a comparable severity were reached. However, skeletal muscle impairment was significantly more pronounced in LV failure. While the compensatory stage resulted only in minor changes, soleus and gastrocnemius muscle of AOB rats at the decompensated stage demonstrated reduced weight and fibre diameter, higher proteasome activity and expression of the muscle-specific ubiquitin E3 ligases muscle-specific RING finger 1 and atrogin-1, increased expression of the atrophy marker myostatin, increased autophagy activation, and impaired mitochondrial function and respiratory chain gene expression. Soleus and gastrocnemius muscle of PAB rats did not show significant changes in muscle weight and proteasome or autophagy activation, but mitochondrial function was mildly impaired as well. The diaphragm did not demonstrate differences in any model or disease stage except for myostatin expression, which was altered at the decompensated stage in both models. Plasma interleukin (IL)-6 and angiotensin II were strongly increased at the decompensated stage (AOB > > PAB). Soleus and gastrocnemius muscle itself demonstrated an increase in IL-6 expression independent from blood-derived cytokines only in AOB animals. In vitro experiments in rat skeletal muscle cells suggested a direct impact of IL-6 and angiotensin II on distinctive atrophic changes.
Conclusions: Manifold skeletal muscle alterations are more pronounced in LV failure compared with RV failure despite a similar ventricular impairment. Most of the catabolic changes were observed in soleus or gastrocnemius muscle rather than in the constantly active diaphragm. Mitochondrial dysfunction and up-regulation of myostatin were identified as the earliest signs of skeletal muscle impairment.
Keywords: Left heart failure; Mitochondria; Muscle wasting; Proteasome; Right heart failure.
© 2020 The Authors. Journal of Cachexia, Sarcopenia and Muscle published by John Wiley & Sons Ltd on behalf of Society on Sarcopenia, Cachexia and Wasting Disorders.
Conflict of interest statement
None declared.
Figures
Similar articles
-
Comparison of the stage-dependent mitochondrial changes in response to pressure overload between the diseased right and left ventricle in the rat.Basic Res Cardiol. 2024 Aug;119(4):587-611. doi: 10.1007/s00395-024-01051-3. Epub 2024 May 17. Basic Res Cardiol. 2024. PMID: 38758338
-
Hypertrophy of the right ventricle by pulmonary artery banding in rats: a study of structural, functional, and transcriptomics alterations in the right and left ventricles.Front Physiol. 2023 Jul 27;14:1129333. doi: 10.3389/fphys.2023.1129333. eCollection 2023. Front Physiol. 2023. PMID: 37576341 Free PMC article.
-
Skeletal muscle mitochondrial dysfunction precedes right ventricular impairment in experimental pulmonary hypertension.Mol Cell Biochem. 2013 Jan;373(1-2):161-70. doi: 10.1007/s11010-012-1485-6. Epub 2012 Oct 26. Mol Cell Biochem. 2013. PMID: 23099843
-
Clinical aspects of left ventricular diastolic function assessed by Doppler echocardiography following acute myocardial infarction.Dan Med Bull. 2001 Nov;48(4):199-210. Dan Med Bull. 2001. PMID: 11767125 Review.
-
Myostatin from the heart: local and systemic actions in cardiac failure and muscle wasting.Am J Physiol Heart Circ Physiol. 2011 Jun;300(6):H1973-82. doi: 10.1152/ajpheart.00200.2011. Epub 2011 Mar 18. Am J Physiol Heart Circ Physiol. 2011. PMID: 21421824 Free PMC article. Review.
Cited by
-
Molecular mechanisms underlying sarcopenia in heart failure.J Cardiovasc Aging. 2024 Jan;4(1):7. doi: 10.20517/jca.2023.40. Epub 2023 Dec 31. J Cardiovasc Aging. 2024. PMID: 38455513 Free PMC article.
-
Caloric restriction reduces sympathetic activity similar to beta-blockers but conveys additional mitochondrio-protective effects in aged myocardium.Sci Rep. 2021 Jan 21;11(1):1931. doi: 10.1038/s41598-021-81438-7. Sci Rep. 2021. PMID: 33479375 Free PMC article.
-
Skeletal Muscle Pathology in Pulmonary Arterial Hypertension and Its Contribution to Exercise Intolerance.J Am Heart Assoc. 2025 Feb 18;14(4):e036952. doi: 10.1161/JAHA.124.036952. Epub 2025 Feb 8. J Am Heart Assoc. 2025. PMID: 39921526 Free PMC article. Review.
-
A common gene signature of the right ventricle in failing rat and human hearts.Nat Cardiovasc Res. 2024 Jul;3(7):819-840. doi: 10.1038/s44161-024-00485-1. Epub 2024 Jul 5. Nat Cardiovasc Res. 2024. PMID: 39196177 Free PMC article.
-
Increased Myocardial MAO-A, Atrogin-1, and IL-1β Expression in Transgenic Mice with Pancreatic Carcinoma-Benefit of MAO-A Inhibition for Cardiac Cachexia.Biomedicines. 2024 Sep 3;12(9):2009. doi: 10.3390/biomedicines12092009. Biomedicines. 2024. PMID: 39335522 Free PMC article.
References
-
- Lecker SH, Jagoe RT, Gilbert A, Gomes M, Baracos V, Bailey J, et al. Multiple types of skeletal muscle atrophy involve a common program of changes in gene expression. FASEB J 2004;18:39–51. - PubMed
-
- Mammucari C, Milan G, Romanello V, Masiero E, Rudolf R, Del Piccolo P, et al. FoxO3 controls autophagy in skeletal muscle in vivo. Cell Metab 2007;6:458–471. - PubMed
Publication types
MeSH terms
LinkOut - more resources
Full Text Sources
Medical
