

Disparities in SARS-CoV-2 Positivity Rates: Associations with Race and Ethnicity
- PMID: 32985959
- PMCID: PMC7875132
- DOI: 10.1089/pop.2020.0163
Disparities in SARS-CoV-2 Positivity Rates: Associations with Race and Ethnicity
Abstract
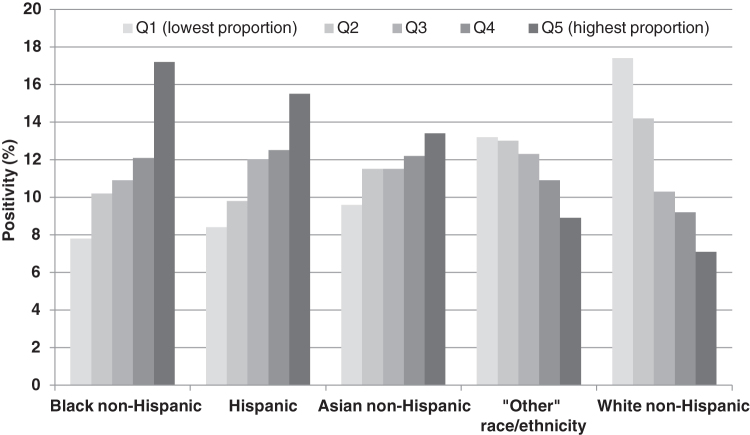
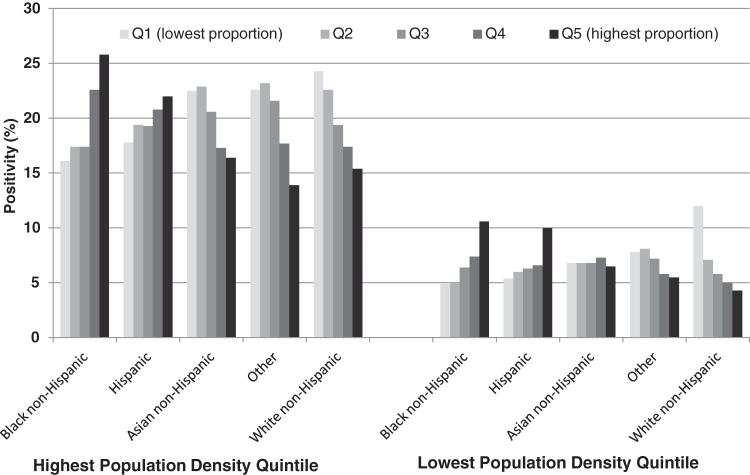
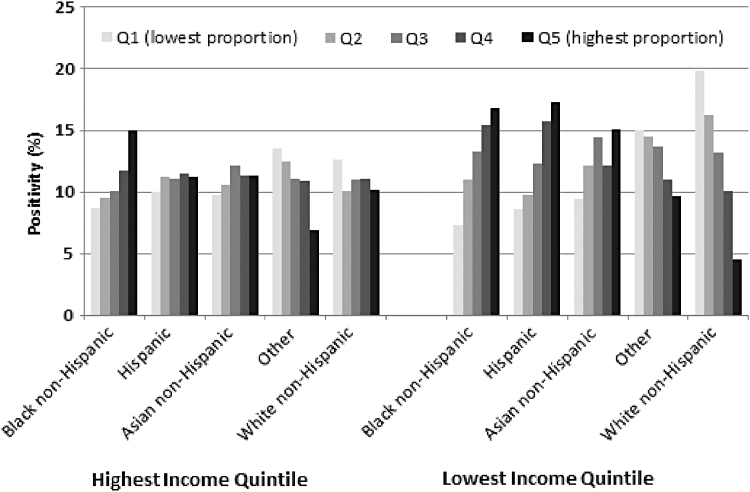
Numerous reports indicate that African Americans and Latinos are being affected disproportionately by coronavirus disease 2019 (COVID-19). Positivity rates have not been analyzed on scale because only 4 states report race/ethnicity as part of severe acute respiratory syndrome coronavirus 2 (SARS-CoV-2) testing. Previous studies also have had little ability to control for many known risk factors to better identify the effects of COVID-19 on racial and ethnic communities. Using test results from a large national reference laboratory database that included patients from all 50 states and the District of Columbia, this study compared positivity rates for SARS-CoV-2 nucleic acid amplification tests (NAAT) among various race/ethnicity groups by linking zip code-based race/ethnicity proportions from US Census data. Analysis of 2,331,175 unique patients tested March-May 2020 demonstrated an increasing trend in SARS-CoV-2 NAAT positivity across Black non-Hispanic community progressive quintiles (from 7.8% to 17.2%, P < 0.0001) and Hispanic community progressive quintiles (from 8.4% to 15.5%, P < 0.0001) and a decreasing trend across White non-Hispanic community progressive quintiles (from 17.4% to 7.1%, P < 0.0001). These trends in viral ribonucleic acid positivity remained in stratified analyses and in multivariable models that controlled for known risk factors including sex, population density, and the states initially hardest hit by COVID-19. These findings indicate that communities with the highest proportions of Black non-Hispanic and Hispanic populations have the highest SARS-CoV-2 NAAT positivity rates, even after controlling for other risk factors. More efforts are needed to mitigate the increased impact of COVID-19 on both the African American and Hispanic communities.
Keywords: COVID-19; SARS-CoV-2; ethnicity; race.
Conflict of interest statement
The authors declare that there are no conflicts of interest.
Figures
References
-
- Khunti K, Singh AK, Pareek M, Hanif W. Is ethnicity linked to incidence or outcomes of covid-19? BMJ 2020;369:m1548. - PubMed
-
- US Centers for Disease Control and Prevention Provisional death counts for coronavirus disease (COVID-19): weekly state-specific data updates by select demographic and geographic characteristics. 2020. https://www.cdc.gov/nchs/nvss/vsrr/covid_weekly/ Accessed June4, 2020
-
- Chicago Department of Public Health. Latest data. 2020. https://www1.nyc.gov/site/doh/covid/covid-19-data.page Accessed June24, 2020
Publication types
MeSH terms
LinkOut - more resources
Full Text Sources
Other Literature Sources
Medical
Miscellaneous