

Effects of Time-Restricted Eating on Weight Loss and Other Metabolic Parameters in Women and Men With Overweight and Obesity: The TREAT Randomized Clinical Trial
- PMID: 32986097
- PMCID: PMC7522780
- DOI: 10.1001/jamainternmed.2020.4153
Effects of Time-Restricted Eating on Weight Loss and Other Metabolic Parameters in Women and Men With Overweight and Obesity: The TREAT Randomized Clinical Trial
Erratum in
-
Error in Figure 2.JAMA Intern Med. 2020 Nov 1;180(11):1555. doi: 10.1001/jamainternmed.2020.6728. JAMA Intern Med. 2020. PMID: 33136126 Free PMC article. No abstract available.
-
Clarification of Messages Delivered to Participants During Trial of Time-Restricted Eating.JAMA Intern Med. 2021 Jun 1;181(6):883. doi: 10.1001/jamainternmed.2020.8941. JAMA Intern Med. 2021. PMID: 33616618 Free PMC article. No abstract available.
Abstract
Importance: The efficacy and safety of time-restricted eating have not been explored in large randomized clinical trials.
Objective: To determine the effect of 16:8-hour time-restricted eating on weight loss and metabolic risk markers.
Interventions: Participants were randomized such that the consistent meal timing (CMT) group was instructed to eat 3 structured meals per day, and the time-restricted eating (TRE) group was instructed to eat ad libitum from 12:00 pm until 8:00 pm and completely abstain from caloric intake from 8:00 pm until 12:00 pm the following day.
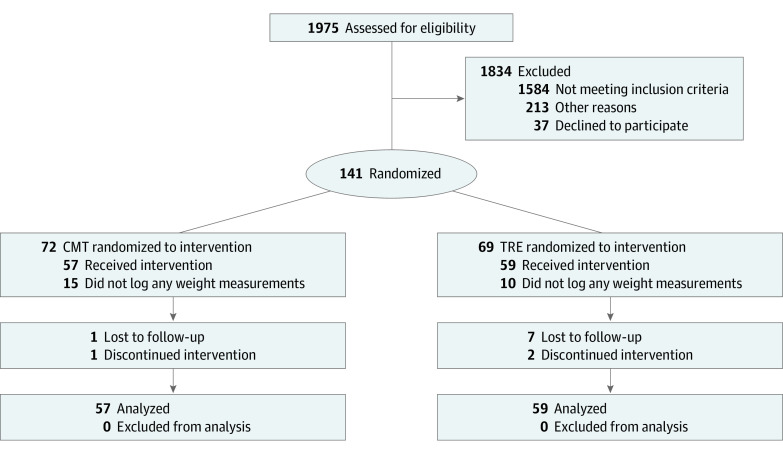
Design, setting, and participants: This 12-week randomized clinical trial including men and women aged 18 to 64 years with a body mass index (BMI, calculated as weight in kilograms divided by height in meters squared) of 27 to 43 was conducted on a custom mobile study application. Participants received a Bluetooth scale. Participants lived anywhere in the United States, with a subset of 50 participants living near San Francisco, California, who underwent in-person testing.
Main outcomes and measures: The primary outcome was weight loss. Secondary outcomes from the in-person cohort included changes in weight, fat mass, lean mass, fasting insulin, fasting glucose, hemoglobin A1c levels, estimated energy intake, total energy expenditure, and resting energy expenditure.
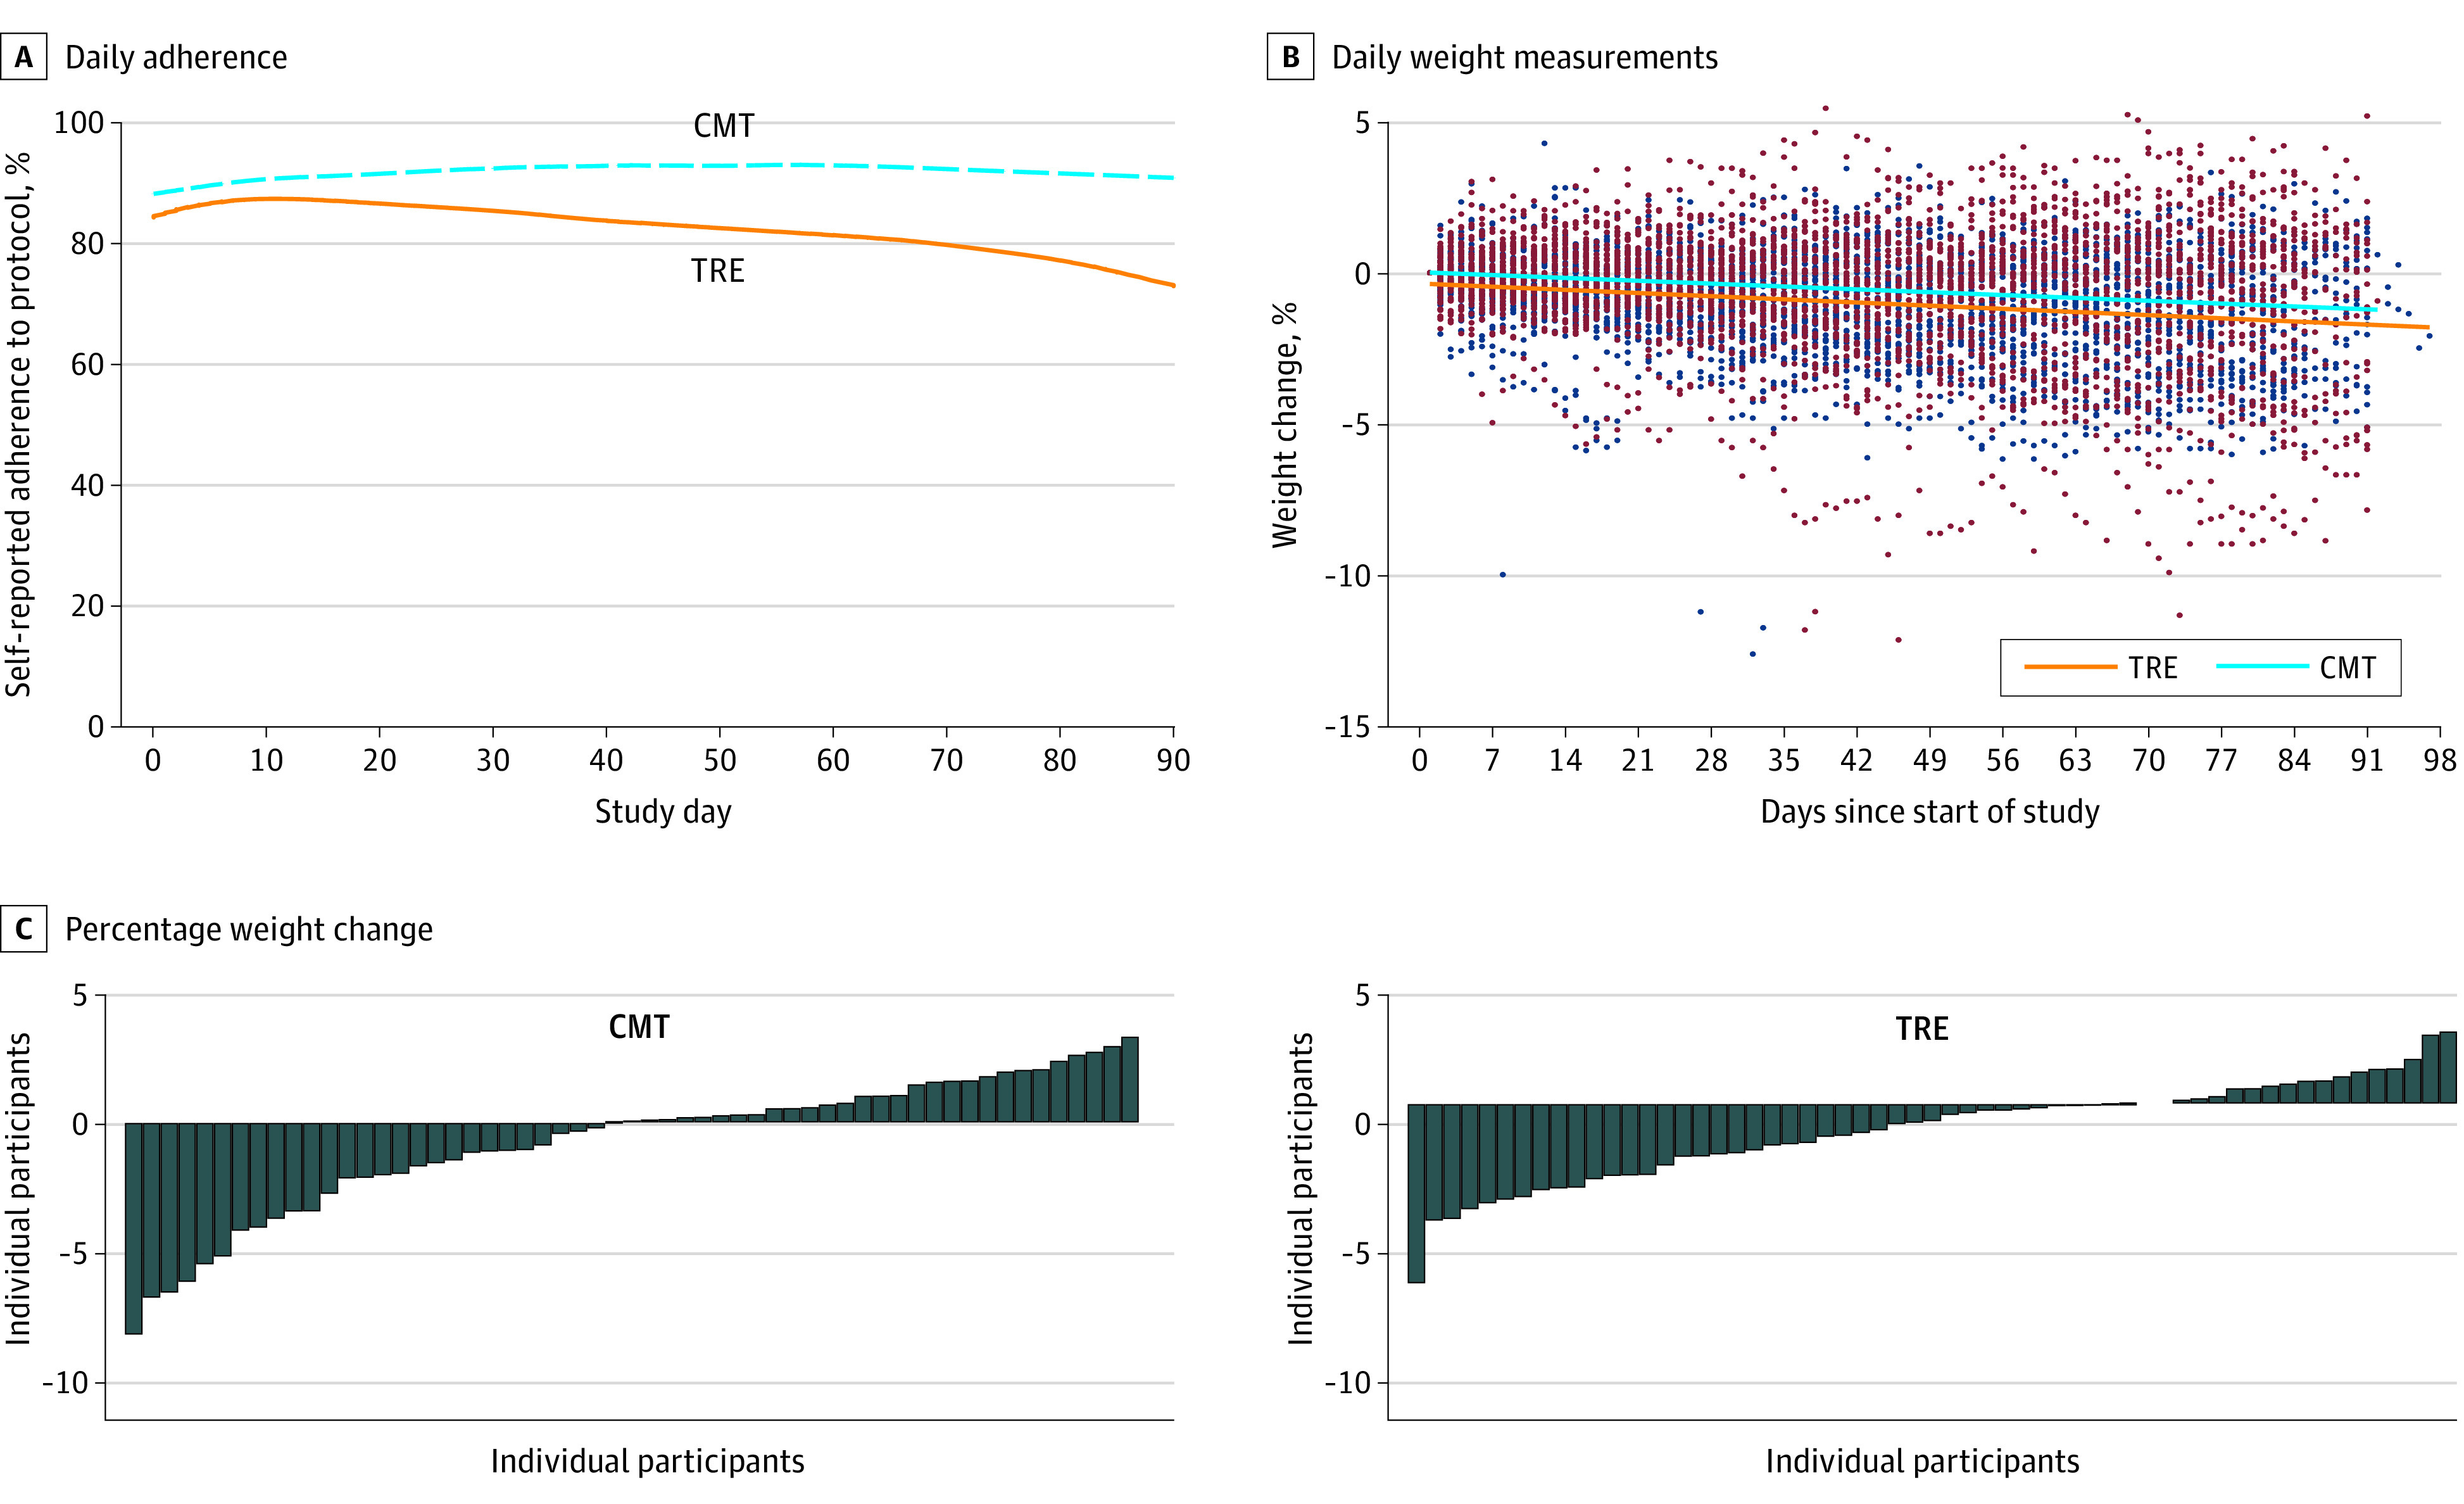
Results: Overall, 116 participants (mean [SD] age, 46.5 [10.5] years; 70 [60.3%] men) were included in the study. There was a significant decrease in weight in the TRE (-0.94 kg; 95% CI, -1.68 to -0.20; P = .01), but no significant change in the CMT group (-0.68 kg; 95% CI, -1.41 to 0.05, P = .07) or between groups (-0.26 kg; 95% CI, -1.30 to 0.78; P = .63). In the in-person cohort (n = 25 TRE, n = 25 CMT), there was a significant within-group decrease in weight in the TRE group (-1.70 kg; 95% CI, -2.56 to -0.83; P < .001). There was also a significant difference in appendicular lean mass index between groups (-0.16 kg/m2; 95% CI, -0.27 to -0.05; P = .005). There were no significant changes in any of the other secondary outcomes within or between groups. There were no differences in estimated energy intake between groups.
Conclusions and relevance: Time-restricted eating, in the absence of other interventions, is not more effective in weight loss than eating throughout the day.
Trial registration: ClinicalTrials.gov Identifiers: NCT03393195 and NCT03637855.
Conflict of interest statement
Figures
Comment in
-
How effective is time-restricted eating for weight loss?Nat Rev Endocrinol. 2020 Dec;16(12):677. doi: 10.1038/s41574-020-00434-5. Nat Rev Endocrinol. 2020. PMID: 33067546 No abstract available.
-
Caution Against Overinterpreting Time-Restricted Eating Results-Reply.JAMA Intern Med. 2021 Jun 1;181(6):878. doi: 10.1001/jamainternmed.2020.8928. JAMA Intern Med. 2021. PMID: 33616599 No abstract available.
-
Caution Against Overinterpreting Time-Restricted Eating Results.JAMA Intern Med. 2021 Jun 1;181(6):876-877. doi: 10.1001/jamainternmed.2020.8931. JAMA Intern Med. 2021. PMID: 33616602 No abstract available.
-
Caution Against Overinterpreting Time-Restricted Eating Results.JAMA Intern Med. 2021 Jun 1;181(6):877-878. doi: 10.1001/jamainternmed.2020.8934. JAMA Intern Med. 2021. PMID: 33616609 Free PMC article. No abstract available.
References
-
- Hales CM CM, Fryar CD, Ogden CL Prevalence of Obesity and Severe Obesity Among Adults: United States, 2017–2018. National Center for Health Statistics. 2020. - PubMed
-
- National Heart L, and Blood Institute. Managing overweight and obesity in adults: Systematic evidence review from the Obesity Expert Panel. https://wwwnhlbinihgov/sites/default/files/media/docs/obesity-evidence-review.pdf. 2013. Accessed November 1, 2013.
