Comparative Study
. 2020 Sep 28;15(9):e0239850.
doi: 10.1371/journal.pone.0239850. eCollection 2020.

A comparative study of single nucleotide variant detection performance using three massively parallel sequencing methods

Affiliations
Comparative Study

A comparative study of single nucleotide variant detection performance using three massively parallel sequencing methods

Linea Christine Trudsø et al. PLoS One. .

Abstract

Massively parallel sequencing (MPS) has revolutionised clinical genetics and research within human genetics by enabling the detection of variants in multiple genes in several samples at the same time. Today, multiple approaches for MPS of DNA are available, including targeted gene sequencing (TGS) panels, whole exome sequencing (WES), and whole genome sequencing (WGS). As MPS is becoming an integrated part of the work in genetic laboratories, it is important to investigate the variant detection performance of the various MPS methods. We compared the results of single nucleotide variant (SNV) detection of three MPS methods: WGS, WES, and HaloPlex target enrichment sequencing (HES) using matched DNA of 10 individuals. The detection performance was investigated in 100 genes associated with cardiomyopathies and channelopathies. The results showed that WGS overall performed better than those of WES and HES. WGS had a more uniform and widespread coverage of the investigated regions compared to WES and HES, which both had a right-skewed coverage distribution and difficulties in covering regions and genes with high GC-content. WGS and WES showed roughly the same high sensitivities for detection of SNVs, whereas HES showed a lower sensitivity due to a higher number of false negative results.


Conflict of interest statement

The authors have declared that no competing interests exist.

Figures

Fig 1
Fig 1. Flow diagram for the comparison of single nucleotide variant (SNV) detection performances of whole genome sequencing (WGS), whole exome sequencing (WES), and HaloPlex target enrichment sequencing (HES).
A: Pairwise comparisons. For each sample, SNVs from methods X and Y were compared. Fully exclusive (FE) variants were identified as SNVs that were only detected by one of the two methods compared. FE variants with high read depth and balanced allele balance were defined as high quality fully exclusive (HQFE) variants. B: Identification of missed variants (MVs). FE and HQFE variants for methods X and Y in regions sequenced by all methods were compared to those of the third method not used in the pairwise comparison (method Z). Method X FE and HQFE variants also identified by method Z were identified as MVs for Y, and method Y FE and HQFE variants also identified by method Z were identified as MVs for X.
Fig 2
Fig 2. Coverage distribution of the three sequencing methods.
The green histogram shows the coverage distribution for whole genome sequencing (WGS), the blue histogram shows the coverage distribution for whole exome sequencing (WES), and the yellow histogram shows the distribution for HaloPlex Enrichment sequencing (HES). For all three histograms, the red bars show counts of low-covered bases (<10x for WGS and <40x for WES and HES).
Fig 3
Fig 3. Percentage of low-covered bases per gene for each method.
The genes were ordered by the percentage of low-covered bases. The red dots represent whole genome sequencing (WGS), the green triangles represent whole exome sequencing (WES), and the blue squares represent HaloPlex target enrichment sequencing (HES). Gene names in both bold and italic are found in the ACMG SF v.2.0 list of genes published by the American College of Medical Genetics and Genomics (ACMG).
Fig 4
Fig 4. Venn diagram of overlapping single nucleotide variants (SNVs) in regions sequenced by all methods.
WGS: whole genome sequencing, WES: whole exome sequencing, HES: HaloPlex target enrichment sequencing, FE: fully exclusive variants, and HQFE: high quality fully exclusive variants.
Fig 5
Fig 5. Barplots of fully exclusive (FE) variants per gene.
The colours denote the methods that detected the variants. The FE variants were found within regions sequenced by all methods. Gene names in both italic and bold were found in the ACMG SF v.2.0 list of genes published by the American College of Medical Genetics and Genomics (ACMG). The genes were ordered according to the numbers of FE variants. WGS: Whole genome sequencing, WES: Whole exome sequencing, HES: HaloPlex target enrichment sequencing, MV: Missed variant.
Fig 6
Fig 6. Barplots of high quality fully exclusive (HQFE) variants per gene.
The colours denote the methods that detected the variants. The HQFE variants were found within regions sequenced with all methods. Gene names in both italic and bold were found in the ACMG SF v.2.0 list of genes published by the American College of Medical Genetics and Genomics (ACMG). The genes were ordered according to the numbers of HQFE variants. WGS: Whole genome sequencing, WES: Whole exome sequencing, HES: HaloPlex target enrichment sequencing, MV: Missed variant.
Fig 7
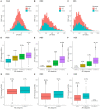
Fig 7. Read depth and allele balance plots.
A-C: Read depth (DP) distribution for SNVs detected by whole genome sequencing (WGS), whole exome sequencing (WES), and HaloPlex target enrichment sequencing (HES). D-F: Boxplots showing DP for heterozygous SNVs within each allele balance (AB—minor allele / total number of alleles) category for WGS, WES, and HES. Mean percentage of heterozygous SNVs within each AB category is shown above each boxplot. G-I: Boxplots showing DP for homozygous SNVs within each AB category for WGS, WES, and HES. Mean percentage of homozygous SNVs within each AB category is shown above each boxplot.

References

    1. Hertz CL, Christiansen SL, Ferrero-Miliani L, Dahl M, Weeke PE, LuCamp, et al. Next-generation sequencing of 100 candidate genes in young victims of suspected sudden cardiac death with structural abnormalities of the heart. Int J Legal Med. 2016;130(1):91–102. Epub 2015/09/19. 10.1007/s00414-015-1261-8 . - DOI - PubMed
    1. Espregueira Themudo G, Leerschool AR, Rodriguez-Proano C, Christiansen SL, Andersen JD, Busch JR, et al. Targeted exon sequencing in deceased schizophrenia patients in Denmark. Int J Legal Med. 2020;134(1):135–47. Epub 2019/11/28. 10.1007/s00414-019-02212-z . - DOI - PubMed
    1. Nikiforova MN, Wald AI, Roy S, Durso MB, Nikiforov YE. Targeted Next-Generation Sequencing Panel (ThyroSeq) for Detection of Mutations in Thyroid Cancer. The Journal of Clinical Endocrinology & Metabolism. 2013;98(11):E1852–E60. 10.1210/jc.2013-2292 %J The Journal of Clinical Endocrinology & Metabolism. - DOI - PMC - PubMed
    1. Flannick J, Mercader JM, Fuchsberger C, Udler MS, Mahajan A, Wessel J, et al. Exome sequencing of 20,791 cases of type 2 diabetes and 24,440 controls. Nature. 2019;570(7759):71–6. Epub 2019/05/24. 10.1038/s41586-019-1231-2 . - DOI - PMC - PubMed
    1. Lohr JG, Adalsteinsson VA, Cibulskis K, Choudhury AD, Rosenberg M, Cruz-Gordillo P, et al. Whole-exome sequencing of circulating tumor cells provides a window into metastatic prostate cancer. Nat Biotechnol. 2014;32(5):479–84. Epub 2014/04/23. 10.1038/nbt.2892 . - DOI - PMC - PubMed

Publication types