. 2021 Jan 4;218(1):e20181853.
doi: 10.1084/jem.20181853.

Lack of NFATc1 SUMOylation prevents autoimmunity and alloreactivity

Affiliations

Lack of NFATc1 SUMOylation prevents autoimmunity and alloreactivity

Yin Xiao et al. J Exp Med. .

Abstract

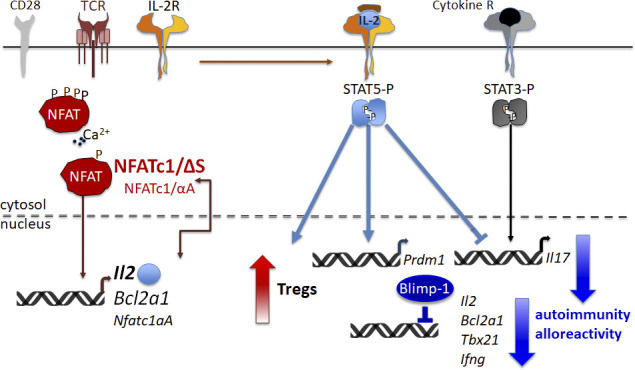
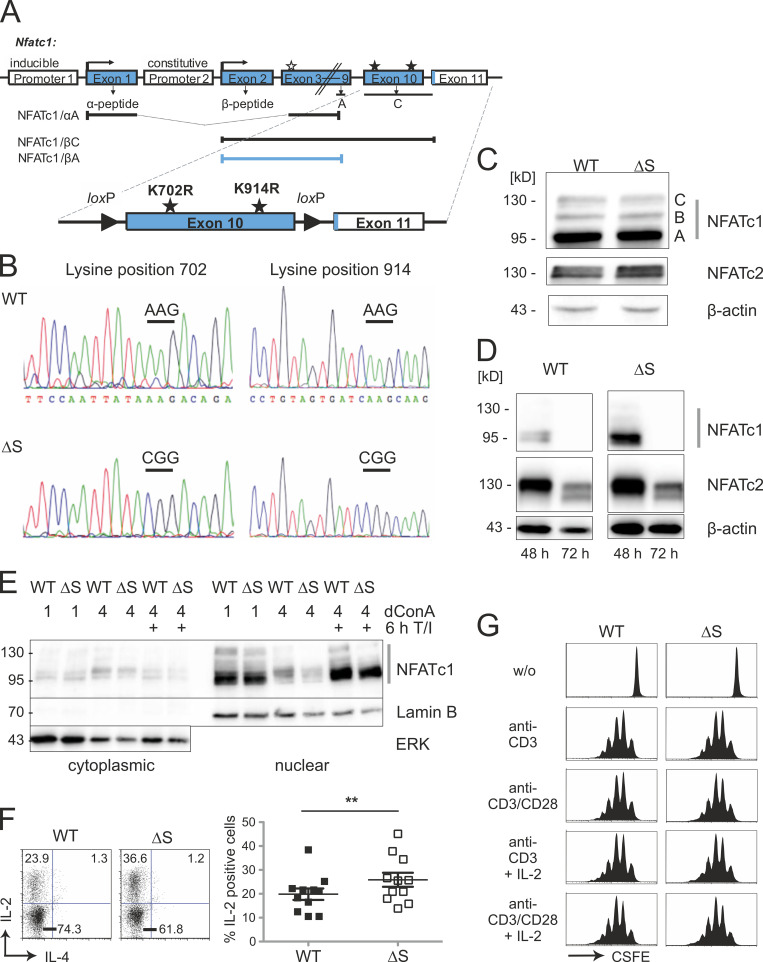
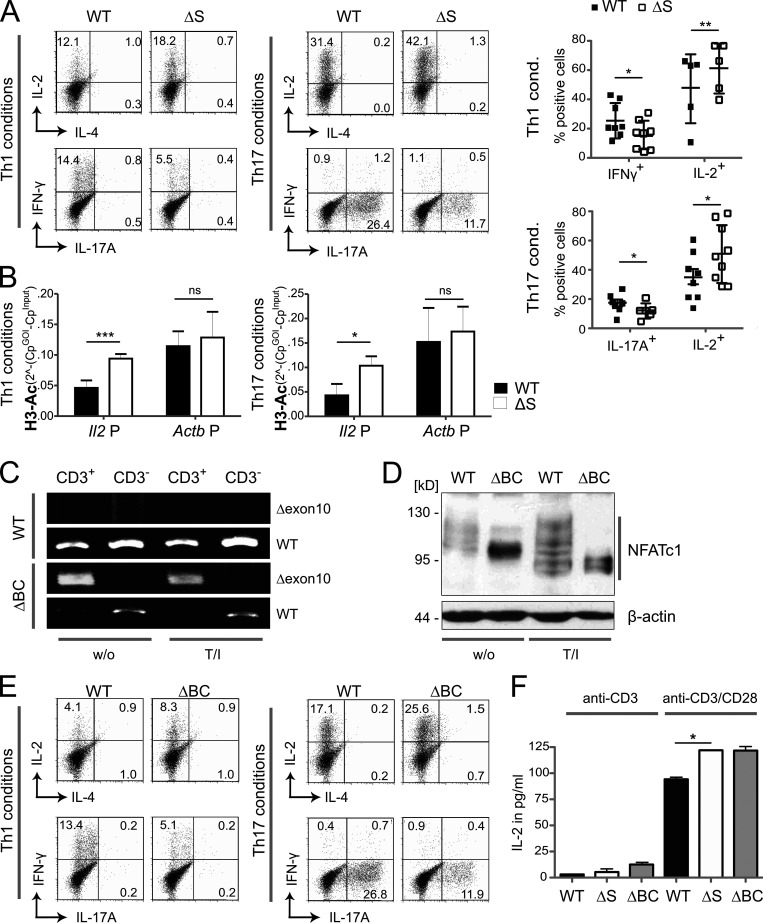
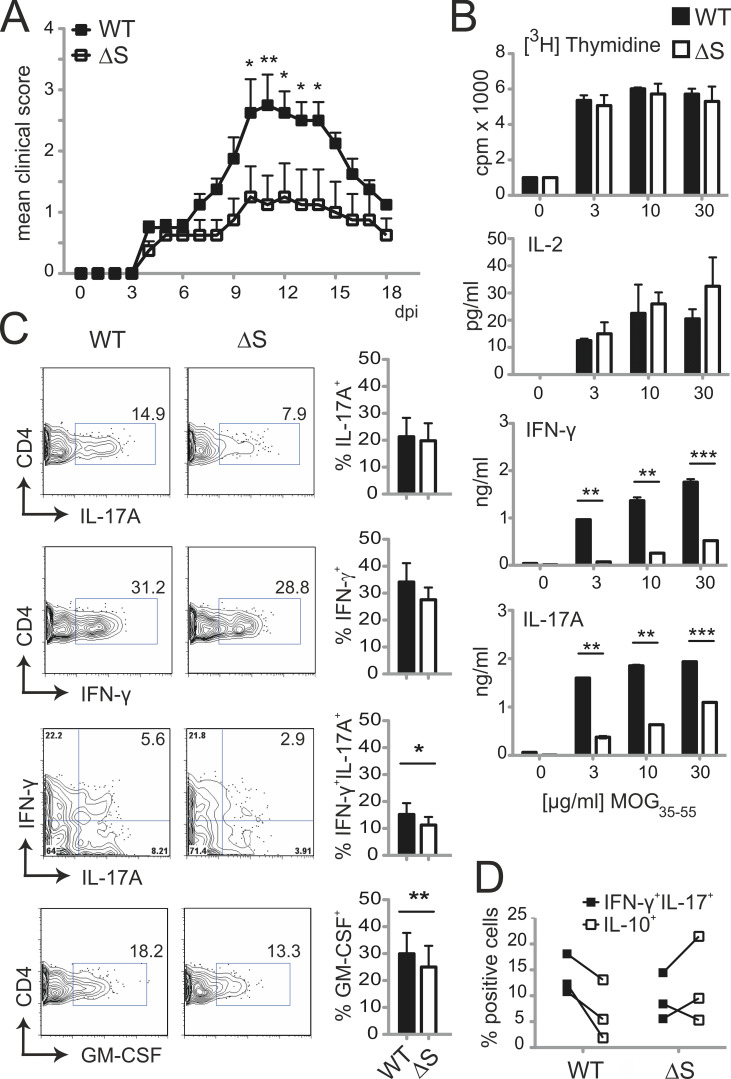
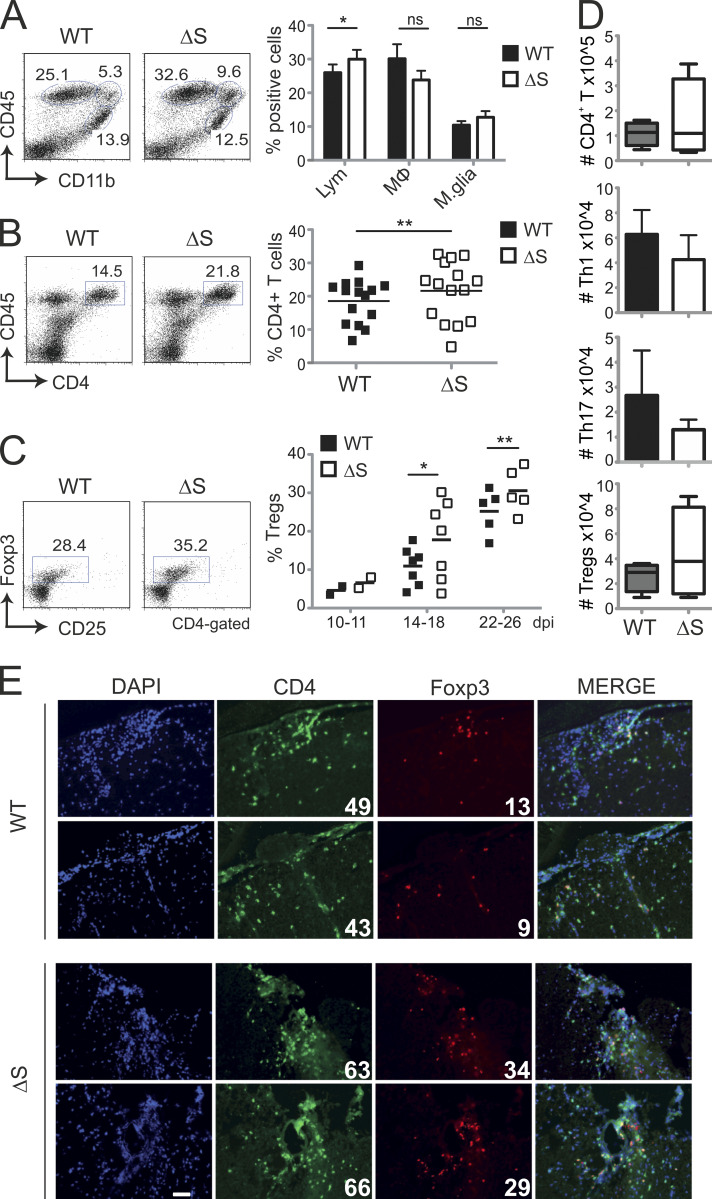
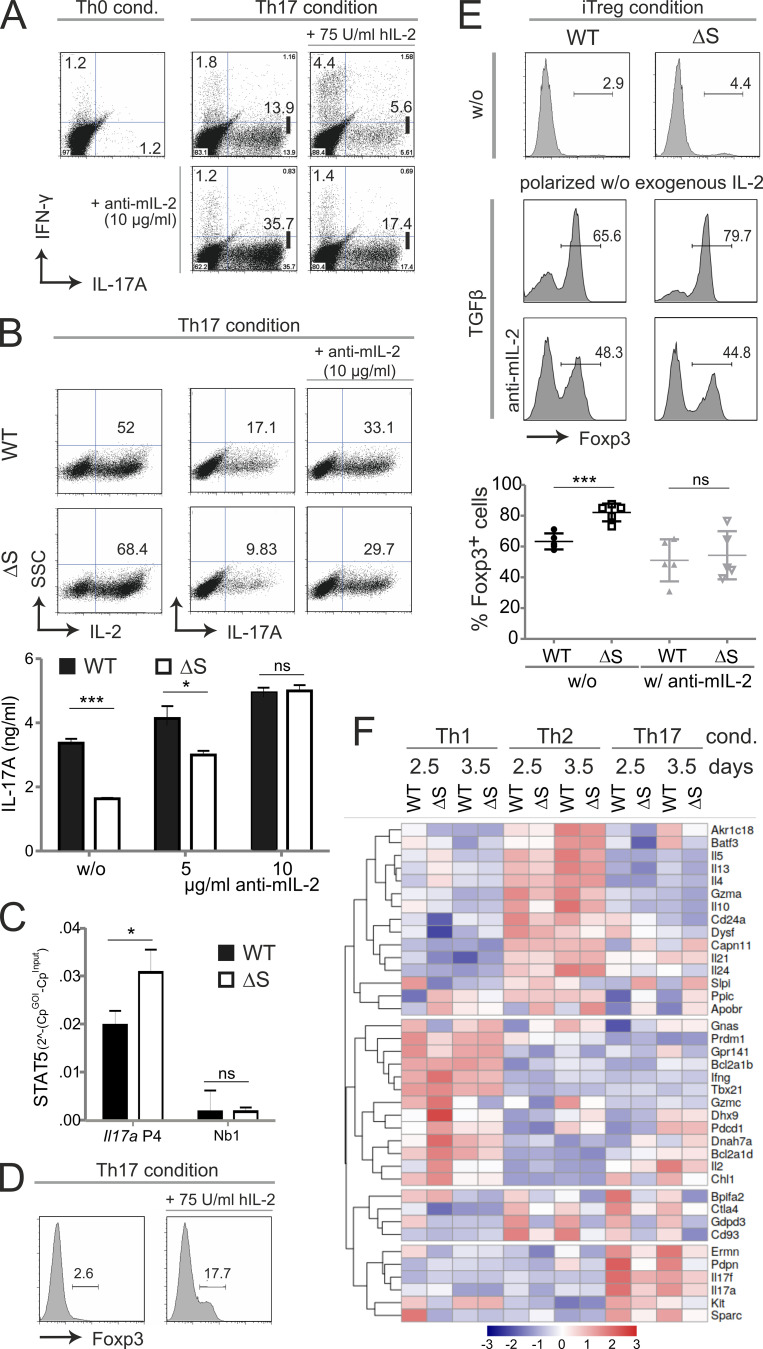
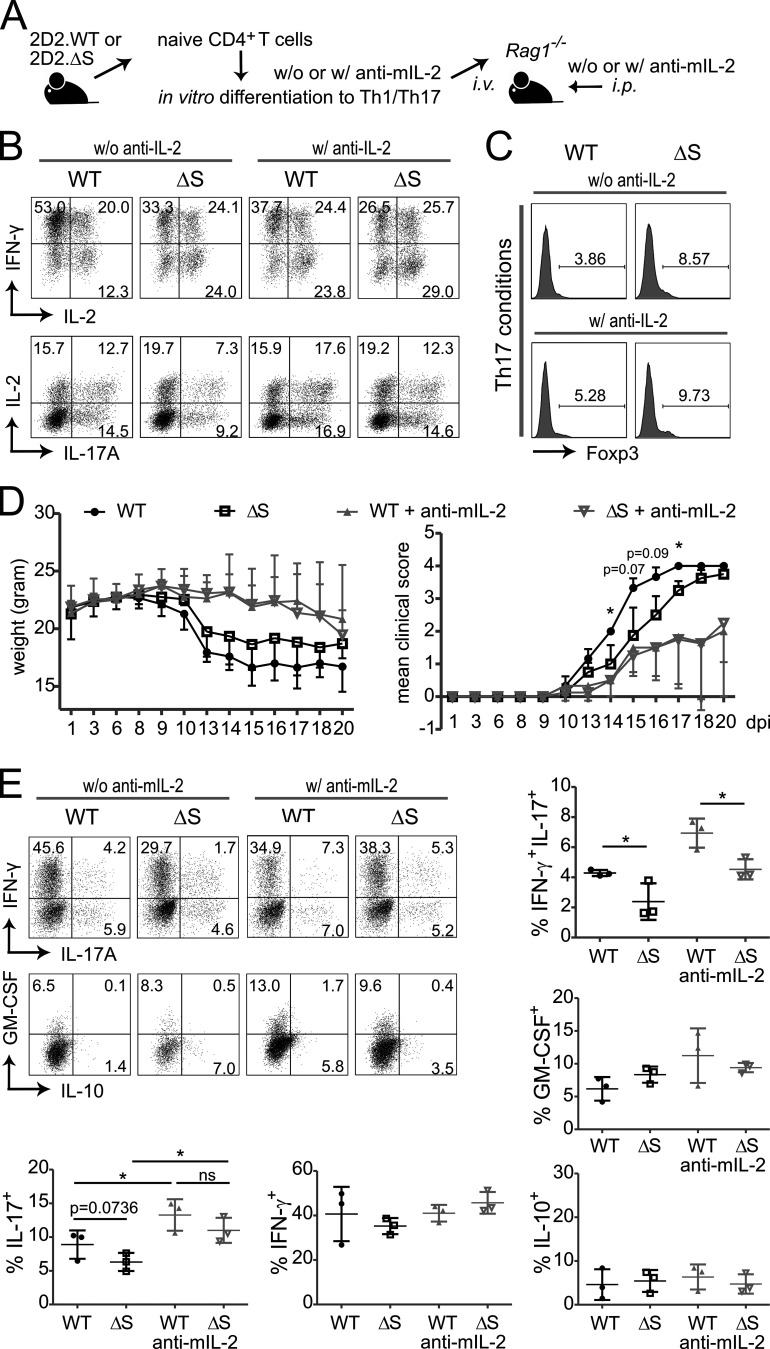
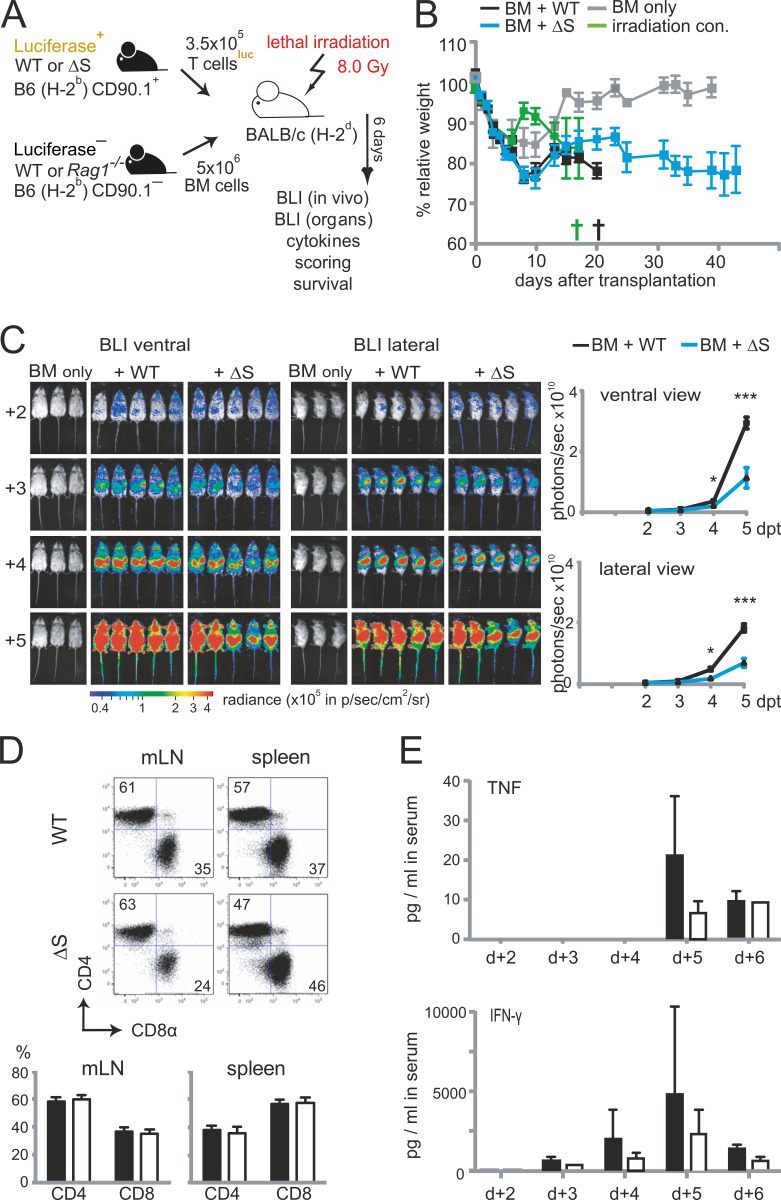
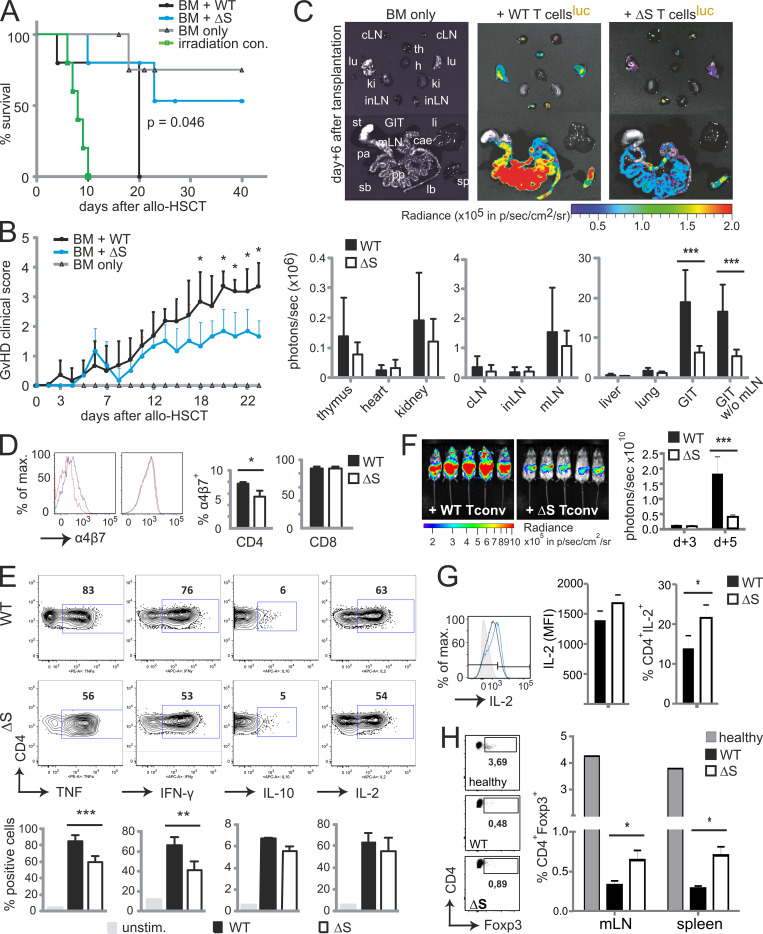
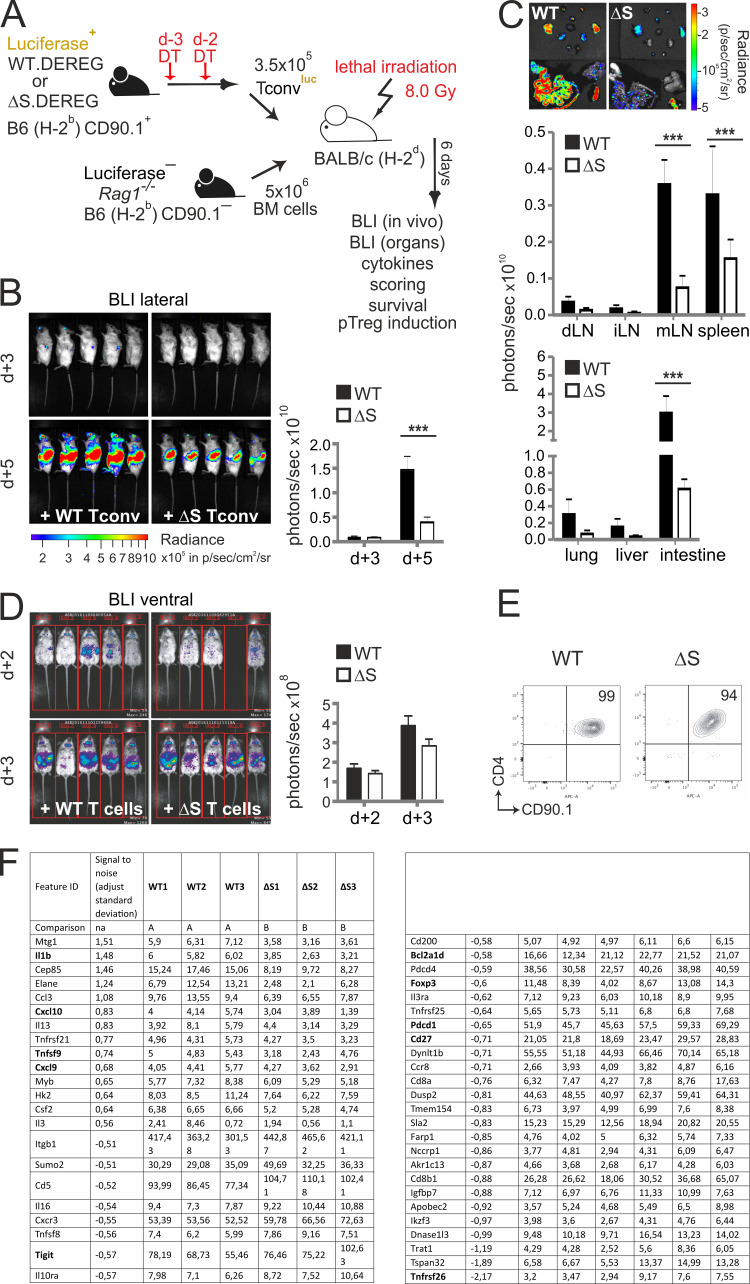
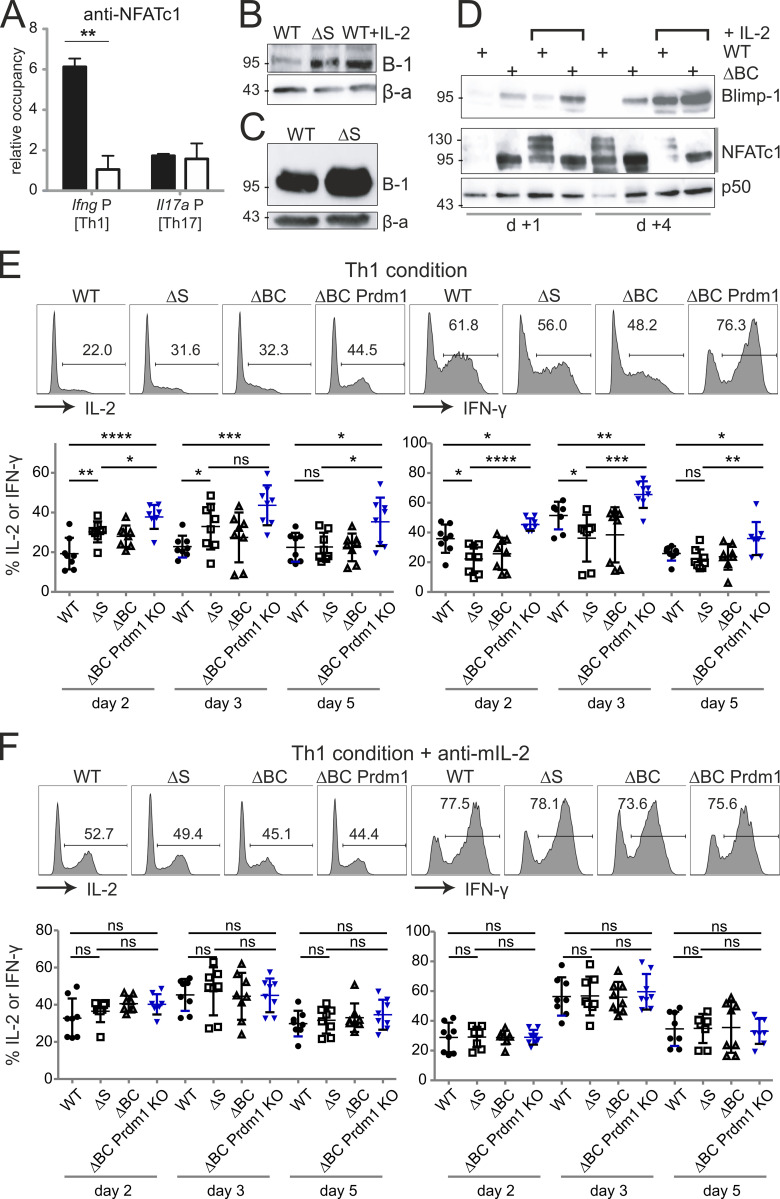
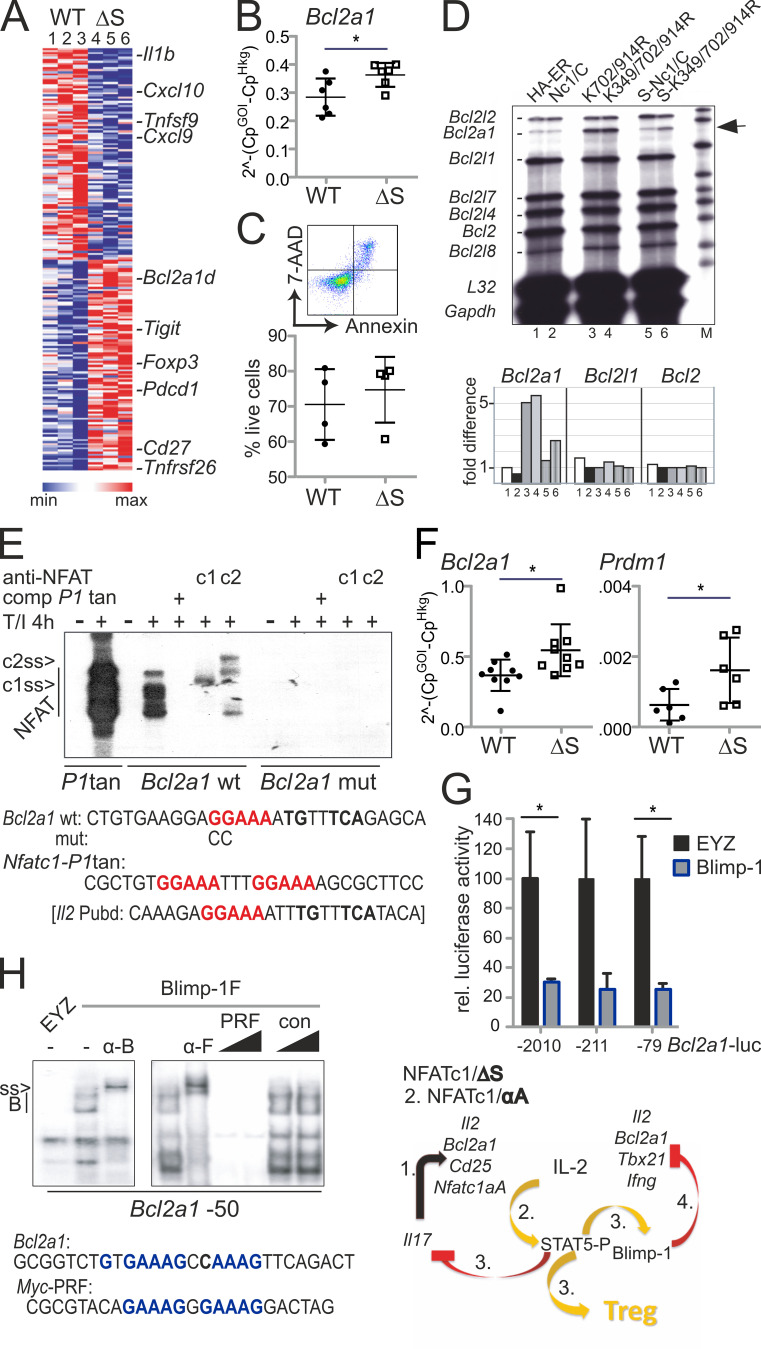
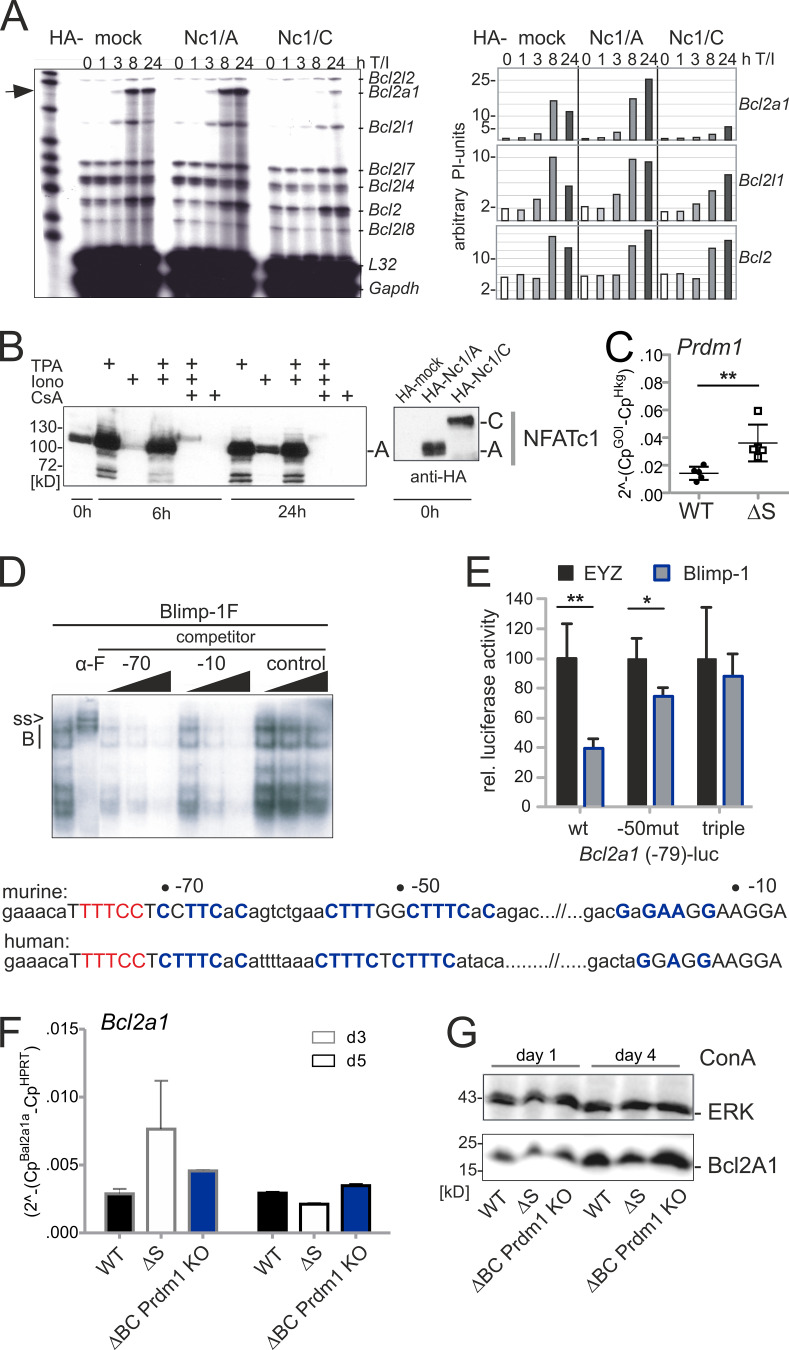
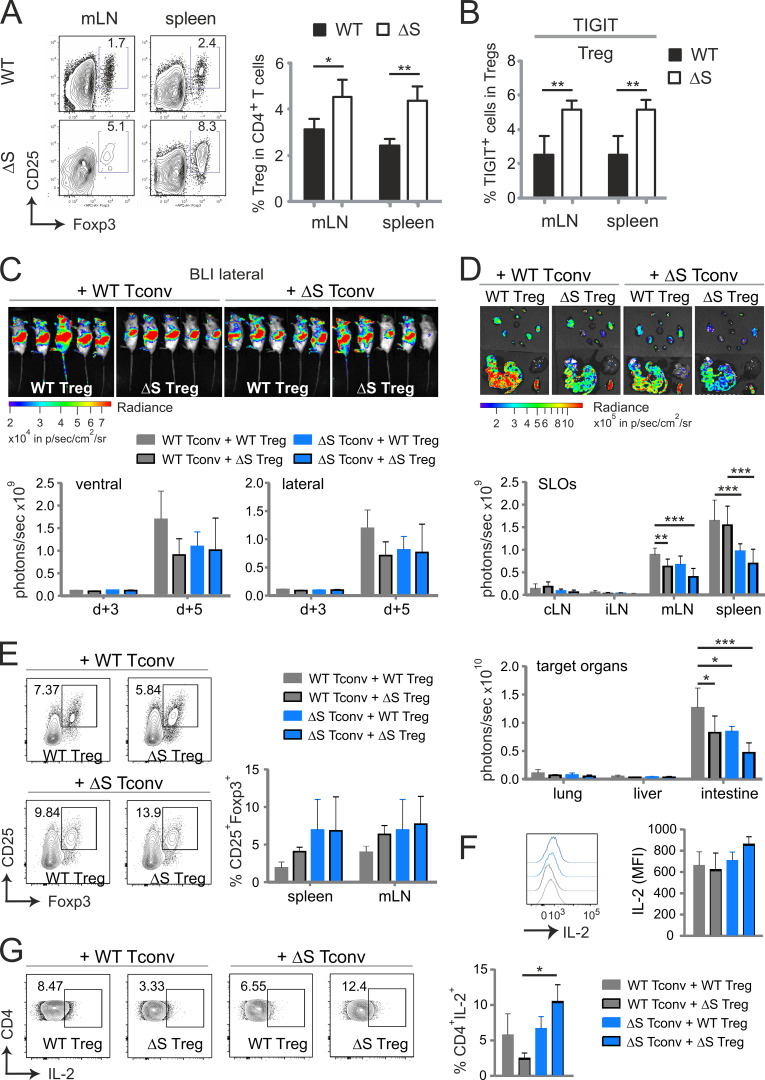
Posttranslational modification with SUMO is known to regulate the activity of transcription factors, but how SUMOylation of individual proteins might influence immunity is largely unexplored. The NFAT transcription factors play an essential role in antigen receptor-mediated gene regulation. SUMOylation of NFATc1 represses IL-2 in vitro, but its role in T cell-mediated immune responses in vivo is unclear. To this end, we generated a novel transgenic mouse in which SUMO modification of NFATc1 is prevented. Avoidance of NFATc1 SUMOylation ameliorated experimental autoimmune encephalomyelitis as well as graft-versus-host disease. Elevated IL-2 production in T cells promoted T reg expansion and suppressed autoreactive or alloreactive immune responses. Mechanistically, increased IL-2 secretion counteracted IL-17 and IFN-γ expression through STAT5 and Blimp-1 induction. Then, Blimp-1 repressed IL-2 itself, as well as the induced, proliferation-associated survival factor Bcl2A1. Collectively, these data demonstrate that prevention of NFATc1 SUMOylation fine-tunes T cell responses toward lasting tolerance. Thus, targeting NFATc1 SUMOylation presents a novel and promising strategy to treat T cell-mediated inflammatory diseases.


Conflict of interest statement

Disclosures: L. Dietz reported other funding from Pfizer Pharma GmbH outside the submitted work. No other disclosures were reported.

Figures

None
Graphical abstract
Figure 1.
Figure 1.
NFATc1 is normally expressed even with successful lysine arginine mutations or C-terminal deletion. (A) Strategy of creating a mouse expressing NFATc1/ΔS in conjunction with the possibility for NFATc1/ΔBC. Both relevant SUMO sites reside in exon 10, which translates into most of the exclusive amino acids of NFATc1/C, whereas only 15 amino acids are encoded in exon 11 (murine NFATc1/αC = 939 aa). The nondepicted NFATc1/B terminates roughly in the middle of exon 10 (at aa 827). The addition of loxP sites within introns 9 and 10 facilitates the specific loss of the long isoforms B and C. In the case of crossing with a Cre-deleter mouse, only NFATc1/αA, initiated at the inducible promoter P1, and constitutive P2-dependent NFATc1/βA can be expressed. (B) Representative sequencing data of Nfatc1 from mouse tail DNA revealed point mutations leading to lysine → arginine exchanges at position 702 and 914 in Nfatc1deltaSUMO mice (n = 3). (C and D) Immunoblot analysis of whole-cell extracts, prepared from spleen and LNs of WT and Nfatc1deltaSUMO mice, detecting expression of NFATc1 isoforms as well as NFATc2 in comparison to β-actin; total lymphocytes stimulated for 6 h by T/I (C) or CD4+ T cells stimulated by anti-CD3/CD28 plus IL-2 for 48 and 72 h (D). (E) Protein expression of WT NFATc1 and NFATc1/ΔS in nuclear and cytoplasmic extracts. CD4+ T cells from spleen and LNs were stimulated with ConA for 1 or 4 d and restimulated for 6 h with T/I as indicated (immunoblots exist in several further variations). (F) Intracellular IL-2 expression in WT and NFATc1/ΔS+ CD4+ T cells, stimulated for 8 h with T/I. Representative flow cytometry plots and comparison of 11 individual mice/group; Student’s t test ± SEM (**, P < 0.005). (G) Proliferation of NFATc1/ΔS or WT CD4+ T cells, stimulated with either anti-CD3 or anti-CD3/CD28 in the presence or absence of exogenous IL-2, and analyzed by CFSE dilution (n = 3).
Figure 2.
Figure 2.
Inhibiting NFATc1 SUMOylation triggers CD4+ T cells to express more IL-2 but less IFN-γ and IL-17A. (A) Th1 and Th17 in vitro differentiation of naive CD4+ T cells from WT and Nfatc1deltaSUMO mice. On day 3, CD4+ T cells were restimulated with T/I followed by intracellular cytokine staining of IL-2 and IL-4 or IL-17A and IFN-γ. Representative flow cytometry plots and comparison of WT versus Nfatc1deltaSUMO CD4+ T cells (Student’s t test ± SEM; n = 10). (B) Chromatin of Th1 and Th17, prepared as for A, was precipitated by anti–H3-Ac. Isolated genomic DNA was subjected to PCR with primers specific for the Il2 and Actb promoters. Student’s two-tailed t test (*, P < 0.05; **, P < 0.005; ***, P < 0.001); mean + SD; n > 3. (C) RT-PCR with primers specific for exon 9 + 11 (Δexon10) showed deletion of the C terminus of Nfatc1 mRNA in CD3+ T cells of Nfatc1deltaBC [Nfatc1deltaSUMO × Cd4cre] but not in CD3 cells nor in WT cells. Primers binding to exon 9 + 10 detected WT Nfatc1 mRNA; n > 3. (D) Immunoblot analysis of unstimulated (w/o) and 6 h stimulated (T/I) CD4+ T cells from WT and Nfatc1deltaBC mice illustrated the differential isoform expression of NFATc1/ΔBC; n > 3. (E) Th1 and Th17 in vitro differentiation of naive CD4+ T cells from WT and Nfatc1deltaBC mice. Analyses as in A; n > 10. (F) ELISA of IL-2 in the supernatant of CD4+ T cells, derived from WT, Nfatc1deltaSUMO, and Nfatc1deltaBC mice and stimulated by anti-CD3 or anti-CD3/CD28 for 48 h. Student’s t test (*, P < 0.05; **, P < 0.005); n = 3.
Figure S1.
Figure S1.
Lymphoid compartments appear unaltered in Nfatc1deltaSUMO mice in steady state. (A) Total cell number in thymus, spleen, and LNs of WT versus Nfatc1deltaSUMO mice (mean + SD, n > 3). (B) Determination of the number of B and T cells in spleen and LN of WT and Nfatc1deltaSUMO mice by surface staining to B220 and CD3ɛ and flow cytometry. (C and D) Distribution of CD4+ and CD8+ T cells (C) as well as frequency of CD25+ Foxp3+ T reg cells within the CD4+ T cell compartment (D) in thymus, spleen, and LNs of WT versus Nfatc1deltaSUMO mice analyzed by flow cytometry. (E) Detection of the activation status of CD4+ T cells in untreated WT versus Nfatc1deltaSUMO mice, given by representative flow cytometry for resting (CD62L+) and activated (CD69+) CD4+ T cells in spleen or LN. (F) Capacity of CD4+CD25+ T regs, isolated from WT and Nfatc1deltaSUMO mice, to suppress WT CD4+ T cells, stimulated on irradiated splenic cells with anti-CD3. The ratio of T conv over T regs are indicated. Bars show mean + SD of three experiments.
Figure 3.
Figure 3.
Nfatc1deltaSUMO mice are less susceptible to EAE and produce fewer proinflammatory cytokines. (A) WT (n = 4) and Nfatc1deltaSUMO (n = 4) mice were immunized subcutaneously on day 0 with 50 µg MOG35–55 peptide in CFA. Mice were injected i.p. with 200 ng/mouse of pertussis toxin on days 0 and 2. EAE development in mice was assessed by a 0–6 disease scoring system over a period of 18 d. Shown is one representative clinical score of 10 individual EAE experiments. Statistical analysis of mean daily score was evaluated by Mann–Whitney U test followed by Bonferroni posttest (*, P < 0.05; **, P < 0.005). (B) MOG35–55 restimulation (0, 3, 10, and 30 µg/ml) of splenic/inguinal LN cells from EAE-diseased WT or Nfatc1deltaSUMO mice for 3 d. Proliferation was quantified by 3[H]thymidine incorporation. Bars indicate mean of stimulation index (SI) + SD, pooled from three experiments. IL-2, IL-17A, and IFN-γ secretion was analyzed by ELISA. Bars show mean + SD, pooled from two experiments. Statistical differences were determined by two-way ANOVA (**, P < 0.005; ***, P < 0.001). (C) Analysis of cytokine production of CNS-infiltrated CD4+ T cells (CD4 gate) at peak of EAE (day 15 after induction). CNS infiltrates of EAE mice were isolated and restimulated with T/I for 5 h followed by intracellular cytokine staining. Shown are representative plots for WT or Nfatc1deltaSUMO mice and the statistical evaluation of cytokine-positive cells of eight mice per group (IL-17A, IFN-γ, and IL-17A/IFN-γ) and three mice per group (GM-CSF). Statistical differences were determined by Student’s t test; *, P < 0.05; **, P < 0.005; mean ± SEM. (D) Intracellular staining of IL-10 versus IL-17A plus IFN-γ in CD4+ T (gate) cells in CNS infiltrates of individual EAE mice as in C.
Figure 4.
Figure 4.
EAE-diseased Nfatc1deltaSUMO mice exhibit more T regs in the CNS. (A) Flow cytometric analysis of CNS-infiltrating cells isolated from EAE-diseased WT and Nfatc1deltaSUMO mice: lymphocytes (CD45highCD11b), macrophages and neutrophils (CD45highCD11bhigh), and microglia cells (CD45lowCD11bhigh). Shown are representative flow cytometry plots and the statistical evaluation of 15 mice/group. Student’s t test; *, P < 0.05. Mean + SEM. (B) Frequency of CD4+ T cells within CNS infiltrates of EAE-diseased WT and Nfatc1deltaSUMO mice. Shown are representative flow cytometry plots and the compilation of 15 mice/group. Student’s t test; **, P < 0.005. Mean + SEM. (C) Detection of T regs in the CNS of WT and Nfatc1deltaSUMO mice after EAE induction by flow cytometry. CNS infiltrates were stained for CD4, CD25, and intracellular Foxp3 on the indicated days after EAE induction. Shown are representative plots and the statistical evaluation. Differences between groups were calculated with Student’s t test; *, P < 0.05; **, P < 0.005. Mean + SEM. (D) Absolute cell numbers (number in CNS-collected cells × percent CD4+ [n = 4] × percent IFN-γ+ [n = 3], IL-17+ [n = 3], or Foxp3+ [n = 4]) were determined on days 22–26. (E) Immunofluorescence staining of spinal cord cryosections of WT and Nfatc1deltaSUMO EAE-induced mice (magnification, 40×; scale bar, 20 µm). Sections were stained with anti-CD4 (Alexa Fluor 488), anti-Foxp3 (Cy3), and DAPI. Shown are two individual spinal cords for both genotypes each. White numbers indicate counted (in a blinded manner) CD4+ and Foxp3+ cells.
Figure 5.
Figure 5.
NFATc1/ΔS-induced overexpression of IL-2 limits IL-17A production and favors Foxp3 expression. (A) Th17 differentiation of naive CD4+ WT T cells with the addition of human IL-2 (75 U/ml) and/or anti-murine IL-2–neutralizing antibodies (10 µg/ml). On day 3, Th17 cells were restimulated with T/I followed by intracellular cytokine staining of IL-17A and IFN-γ. Shown are representative flow cytometry plots of Th0 (control) and Th17 cultures of three individual experiments. (B) Th17 differentiation of naive CD4+ T cells gained from WT and Nfatc1deltaSUMO mice under normal and mIL-2–neutralizing conditions as performed for A. Representative flow cytometry plots of intracellular staining of IL-2 and IL-17A of three individual experiments. Amount of secreted IL-17 was determined from the supernatants of Th17 cultures (n = 6) with increasing concentrations of anti–mIL-2. (C) ChIP assay of Th17-differented cells for STAT5 bound to Il17 promoter (site 4) and a nonbinding site (n = 4). (D) Foxp3+ expression was evaluated in WT CD4+ T cells after the addition of IL-2 (75 U/ml rhIL-2) to otherwise Th17-inducing conditions; analyzed by intracellular flow cytometry on day 3. (E) Naive CD4+ T cells from WT and Nfatc1deltaSUMO mice were polarized to iT regs by supplementation with TGFβ, but without the addition of exogenous IL-2; parallel cultures were in the presence of 10 µg/ml anti–mIL-2. On day 3, cells were analyzed by intracellular flow cytometry of Foxp3. Data are shown as representative flow cytometry plots for Foxp3+ cells. Statistics were evaluated from five individual experiments. Statistical evaluation for B, C, and E was achieved by Student’s t test, two-tailed (*, P < 0.05; ***, P < 0.001); mean + SD. (F) CD4+ T cells, isolated from LN and spleen, were differentiated for Th1, Th2, and Th17. On days 2.5 and 3.5, RNA was extracted and subjected to NGS. The heatmap shows 38 differentially expressed genes within all WT versus NFATc1/ΔS+ T cells of both days determined using the edgeR’s glm model.
Figure S2.
Figure S2.
Expression analyses of in vitro differentiated Th1, Th2, and Th17. (A) For NSG analyses, naive CD4+ T cells from WT and Nfatc1deltaSUMO mice were skewed toward Th1, Th2, and Th17. Differentiation was verified on day 2.5, as some CD4+ T cells were restimulated with T/I followed by intracellular cytokine staining of IL-2 and the key cytokines IFN-γ, IL-4, or IL-17A. (B, D, and E) Heatmaps calculated for Th1 (B), Th2 (D), or Th17 (E) individually between WT and NFATc1/ΔS+ (P = 0.02, log fold-change 1.2). A comparison of the differently expressed genes in the respective subset is given for the two other subsets. (C) Pathway enrichment analysis for NGS data of Th1, day 2.5, conducted using clusterProfiler; top 10 pathways are shown. Red (up-regulation) and blue (down-regulation) dots in the category netplot depict the log fold-changes of gene expression in NFATc1/ΔS+ Th1. (F) In vitro stimulation of CD4+ T cells under Th2 differentiating conditions and intracellular expression of IL-2 and IL-13 after 3 d and additional 5 h of T/I restimulation; n = 5. Student’s t test (*, P < 0.05); mean + SD.
Figure 6.
Figure 6.
IL-2–dependently, NFATc1/ΔS+ Th1 and Th17 transmit less EAE than WT counterparts. (A) Passive EAE approach by transfer of 2D2+ Th1 and Th17 cells, differentiated in vitro for 3 d and combined for transfer into lymphocyte-deficient mice. 5 × 10⁶ Th1/Th17 cells were injected i.v. into three Rag1−/− mice per group. Parallel cultures and transplanted mice were treated with anti–mIL-2. Three independent experiments were performed. (B) Th1 and Th17 in vitro differentiation, with (w/) and without (w/o) anti–mIL-2, of naive CD4+ T cells from 2D2.WT and 2D2.Nfatc1deltaSUMO mice ahead of transfer. On day 3, a fraction of the cells were restimulated with T/I followed by intracellular cytokine staining of IL-2 and IFN-γ or IL-2 and IL-17A. Representative flow cytometry plots and comparison of WT versus Nfatc1deltaSUMO CD4+ T cells. (C) CD4+ T cells from Th17-skewing conditions were checked for Foxp3 expression by flow cytometry. (D) Weight and clinical scores of mice after passive EAE induction described in A; Mann–Whitney U test; *, P < 0.05. (E) Analysis of IFN-γ versus IL-17 and GM-CSF versus IL-10 expression in CNS-infiltrating CD4+ T cells (CD4 gate) 20 d after induction and restimulated with T/I for 5 h ex vivo. Shown are representative plots and the statistical evaluation of cytokine-positive cells of three mice per group. Statistical differences were determined by Student’s t test; *, P < 0.05.
Figure S3.
Figure S3.
Transfer of T cells from Nfatc1deltaSUMO mice leads to less acute GvHD compared with WT T cells. (A) Preclinical model of aGvHD after MHC-mismatched allo-HCT. BALB/c (H-2d) mice were lethally irradiated with a single dose of 8.0 Gy and transplanted with 5 × 10⁶ CD90.2+ BM cells and 1.2 × 10⁶ CD90.1+ luc+ T cells from C57BL/6 donors (H-2b). (B) Body weight changes of host BALB/c mice (n = 5), irradiated (irradiation control) and transplanted with allogeneic BM (BM only), BM plus allogeneic WT (BM + WT), or BM plus allogeneic Nfatc1deltaSUMO (BM + ΔS) mice. (C) Representative in vivo BLI of mice transplanted with B6.CD90.2+ BM (BM only), BM plus B6.CD90.1+ luc+ WT T cells, and BM plus B6.CD90.1+ luc+ NFATc1/ΔS+ T cells. Statistical significance was calculated using two-way ANOVA; *, P < 0.05; ***, P < 0.001. (D) Frequency of splenic donor CD4+ and CD8+ T cells after 6 d, analyzed by flow cytometry and quantified from n = 15. (E) Analysis of serum IFN-γ and TNFα on days 2–6 after allo-HCT using cytometric bead array (n = 5, mean + SD).
Figure 7.
Figure 7.
NFATc1/ΔS in T cells ameliorates acute GvHD after allogeneic HCT. (A) Cumulative survival of irradiated BALB/c mice (irradiation control), with transfer of B6.BM cells (BM only) or B6.BM cells plus B6.CD90.1+luc+ T cells from WT (BM + WT) or Nfatc1deltaSUMO (BM + ΔS) mice, respectively. Median survival: BM only, undefined; irradiation control, 8 d; BM + WT, 20 d; BM + ΔS, undefined. P = 0.046 between WT and ΔS (log-rank test). (B) Clinical GvHD scoring (score 0–8; Cooke et al., 1996) of the recipient mice listed under A. Mann–Whitney U test; *, P < 0.05. (C) Representative ex vivo BLI data from internal organs and quantification of allogenic luc+ WT versus NFATc1/ΔS+ T cells 6 d after the transfer. Data are compiled from at least two independent experiments with five mice per group per experiment (n = 10). Two-way ANOVA; ***, P < 0.001. (D) Analysis of α4β7 integrin expression on CD90.1+ donor WT versus NFATc1/ΔS+ CD4+ and CD8+ T cells 6 d after allo-HCT in spleen and mesenteric LNs measured by flow cytometry; data from three individual recipient mice are summarized (n = 6). Statistical significance was calculated using Student’s t test; *, P < 0.05. (E) Representative intracellular flow cytometry detecting cytokine expression of splenic CD90.1+CD4+ WT and NFATc1/ΔS+ donor T cells 6 d after allo-HCT (upper). Total spleen cells were restimulated for 6 h with T/I. Quantification of data from (n = 10). Statistical significance was calculated using two-way ANOVA; **, P < 0.01; ***, P < 0.001. (F) In vivo BLI of mice transplanted with B6.CD90.2+ BM plus B6.CD90.1+luc+ WT T conv or plus CD90.1+luc+ NFATc1/ΔS+ T cells. T conv, derived from DT-treated DEREG+ mice, were completely T reg free. Statistical significance was calculated using Mann–Whitney U test; ***, P < 0.001. (G) Mean fluorescent intensity (MFI) and percentage of splenic IL-2–expressing cells after 6 d, analyzed by flow cytometry and quantified from n = 5; Mann–Whitney U test *, P < 0.05. (H) Representative flow cytometry of YFP (DEREG) detecting Foxp3 expression in splenic CD4+ cells 6 d after aGvHD induction. CD4+ T cells from an untreated (healthy) WT DEREG mouse served as control. Mann–Whitney U test; *, P < 0.05.
Figure S4.
Figure S4.
Pure NFATc1/ΔS+ T conv cause less aGvHD than WT T conv. (A) Preclinical model of aGvHD after MHC-mismatched allo-HCT and T conv in the complete absence of T regs. Mice had been intercrossed to DEREG. They were treated by DT 3 and 2 d before sacrifice. BALB/c (H-2d) mice were lethally irradiated with a single dose of 8.0 Gy and transplanted with 5 × 10⁶ BM cells from CD90.2+ Rag1−/− mice and 3 × 10⁵ CD90.1+ luc+ T conv from WT or Nfatc1deltaSUMO C57BL/6 donors (H-2b). (B) Representative in vivo BLI of mice as in A. Quantification was done on days 3 and 5 after aGvHD induction. Statistical significance was calculated using two-way ANOVA; ***, P < 0.001; n = 5. (C) Representative ex vivo BLI of SLOs and target organs of mice treated as indicated in A. Quantification was done on day 6 after aGvHD induction. Statistical significance was calculated using two-way ANOVA; ***, P < 0.001; n = 5. (D) In vivo BLI of mice transplanted with BM cells and luc+ CD90.1+ WT versusluc+ CD90.1+ NFATc1/ΔS+ T cells monitored before sacrifice for NGS (Fig. 9 A) on day 4. (E) Purity of splenic CD4+ CD90.1+ T cells after FACS and before RNA extraction and NGS. (F) Marker selection of genes (∼50 of the first 100) up- and down-regulated each by NFATc1/ΔS upon isolation of allo-HCT recipients.
Figure 8.
Figure 8.
Deficiency of NFATc1 SUMOylation provokes Blimp-1 expression. (A) Th1- and Th17-differentiated cells of WT and Nfatc1deltaSUMO mice were analyzed on day 3 of culture by ChIP with anti-NFATc1. Relative occupancy of NFATc1 at the Ifng promoter region (Th1 cells) or at the Il17a promoter (Th17 cells) was calculated by the ΔΔCt method. Bars show mean + SD of two individual experiments. Two-way ANOVA followed by Bonferroni posttest; **, P < 0.005. (B) Immunoblot of ConA-stimulated CD3+ T cells from WT and Nfatc1deltaSUMO mice, WT cells in parallel with the addition of exogenous IL-2 (n > 3). (C) Blimp-1 expression in CD90.1+ CD4+ T cells, regained after transplantation of BM plus WT or NFATc1/ΔS+ T cells on day 6 and detected by immunoblot (n = 3). (D) Blimp-1 expression in CD4+ T cells from WT and Nfatc1deltaBC mice, stimulated for 1 or 4 d by ConA, with or without the addition of IL-2 (n > 3). Blimp-1, NFATc1, and NFATc1/ΔBC were detected by immunoblot. (E and F) CD4+ T cells from WT, Nfatc1deltaSUMO, Nfatc1deltaBC, and Nfatc1deltaBC.Prdm1fl/fl mice were stimulated under Th1-differentiating conditions without (w/o; E) or with (w/; F) anti–mIL-2 for 2, 3, and 5 d and evaluated for intracellular IL-2 and IFN-γ by flow cytometry. Representative plots of day 3 and quantification of n = 8 for each time point are shown. Student’s t test (comparing every two groups); *, P < 0.05; **, P < 0.005; ***, P < 0.001; ****, P < 0.0001.
Figure 9.
Figure 9.
Bcl2A1 is up-regulated by NFATc1/ΔS and repressed by Blimp-1. (A) Heatmap of 200 genes whose expression changed in CD4+ CD90.1+ WT versus NFATc1/ΔS+ T cells (signal to noise, SD adjusted) regained from aGvHD-induced mice on day 4. Shown is the relative difference in RPKM (Morpheus; Broad Institute). (B) Bcl2a1 RNA expression in Th1-skewed cells, measured by qRT-PCR. n = 6, statistical evaluation by Student’s t test; *, P < 0.05. (C) Frequency of 7-AAD+ Annexin+ Th1 cells; n = 4. (D) Detection of Bcl2a1 mRNA in relation to other members of the Bcl2 family and control genes L32 and Gapdh by RNase protection assay using the mApo2 template set (5 µg RNA/lane). EL-4 cells had been retrovirally infected with NFATc1/C-ER and its ΔSUMO and N-terminal SUMO fusion mutants and stimulated with 5-hydroxytamoxifen and T/I for 24 h. 1–6 below phosphoImager values correspond to the lanes of the autoradiography. Shown is one representative from three independent experiments. (E) EMSA with NFAT binding sites-containing probes from the Nfatc1 promoter P1 (tandem site) and Bcl2a1 promoters. Nuclear extracts were prepared from EL-4 cells, stimulated with T/I for 4 h. NFATc1 and NFATc2-specific antibodies supershift the respective proteins (c1ss and c2ss). Consensus nucleotides for NFAT-binding are indicated in red, for AP1 in bold only. (F) Bcl2a1 (n = 9) and Prdm1 (n = 6) RNA expression in CD4+ T cells, collected on day 4 of spleen and intestine of mice induced for aGvHD by WT versus NFATc1/ΔS CD3+ T cells, measured by qRT-PCR. Student’s t test *, P < 0.05. (G) Bcl2a1 promoter activity in response to Blimp-1 was evaluated after transfection with pEYZ/MCS or pEYZ/Blimp-1F along with Bcl2a1 promoter (length indicated)-driven luciferase reporter plasmids in HEK 293T cells. After 36 h, luciferase activity was measured. Data are represented as the mean ± SE. Statistical significance was calculated using Student’s t test; *, P < 0.05. (H) EMSA with oligonucleotides containing Blimp-1 binding from the Myc (PRF) and Bcl2a1 (−50) promoters, using nuclear extracts from HEK 293T cells transiently transfected with Flag-tagged Blimp-1. Blimp-1 was supershifted by either anti-Blimp (α-B) or its tag Flag (α-F). Consensus nucleotides for Blimp-1 binding are indicated in blue. Right: Summary of the hypothesized sequential events downstream of endogenous NFATc1/ΔS expression.
Figure S5.
Figure S5.
NFATc1/A transactivates Bcl2a1, whereas Blimp-1 suppresses it. (A) Detection of Bcl2a1 mRNA in relation to other members of the Bcl2 family and control genes L32 and Gapdh by RNase protection assay using the mApo2 template set. EL-4 cells had been retrovirally infected with HA-EGZ, HA-NFATc1/A, or HA-NFATc1/C (see B [anti-HA] for expression), stimulated with T/I for indicated times. Shown is one representative from two independent experiments. (B) Immunoblot of EL-4 cells, stimulated as indicated to detect endogenous NFATc1/αA by anti-NFATc1 or retrovirally expressed (n > 3) exogenous HA-NFATc1/αA and –c1/αC by anti-HA (n = 2). (C) Prdm1 RNA expression in Th1-skewed cells, measured by qRT-PCR. n = 5, Student’s t test; **, P < 0.005. (D) EMSA with radiolabeled oligonucleotide representing a Blimp-1–binding site of the Bcl2a1 promoter (−50), and competition with increasing amounts of cold oligonucleotides representing the other two Blimp-1–binding sites (−70 and −10) as well as an unrelated probe, using nuclear extracts from HEK 293T cells transiently transfected with Flag-tagged Blimp-1. Blimp-1 was supershifted (ss) by using anti-Flag (α-F) antibody (n > 3). Nucleotides of the proximal Bcl2a1 promoter indicate the consensus nucleotides for Blimp-1 binding in blue and for NFAT in red. (E) Bcl2a1 minimal promoter activity in HEK 293T depending on Blimp-1. pEYZ/MCS or pEYZ/Blimp-1F was transiently cotransfected with luciferase reporter construct driven by an intact Bcl2a1 promoter (WT), singly mutated for the −50 site (−50mut) or a variant in which all three Blimp-sites had been erased (triple). After 36 h, luciferase activity was measured. Data are represented as the mean ± SE. Statistical significance was calculated using Student’s t test; *, P < 0.05; **, P < 0.01. (F) CD4+ T cells from WT, Nfatc1deltaSUMO, and Nfatc1deltaBC.Prdm1fl/fl mice were stimulated under Th1-differentiating conditions for 3 and 5 d and evaluated for Bcl2a1 RNA expression by qRT-PCR. Quantification of triplicates of two mice per genotype for each time point are shown; mean + SD. (G) Combined splenic and LN-derived T cells from two WT, two Nfatc1deltaSUMO, or two Nfatc1deltaBC.Prdm1fl/fl mice were stimulated by ConA for 1 and 4 d. Immunoblot analysis of whole-cell extracts, detected Bcl2A1 and ERK (one experiment).
Figure 10.
Figure 10.
Protection from GvHD is encoded in NFATc1/ΔS+ T conv as well as in NFATc1/ΔS+ T regs. (A) Detection of CD25+ Foxp3+ cells as percentage of CD4+CD90.1+ in spleen and mesenteric LNs of aGvHD-induced mice on day 6. Transplanted allogenic luc+ T cells were derived from WT versus Nfatc1deltaSUMO mice. Statistical significance was calculated using Student’s t test; *, P < 0.05; **, P < 0.01. (B) Evaluation of surface expression of TIGIT on CD4+CD90.1+ T conv (no TIGIT detectable) and CD4+CD90.1+ Foxp3+ T regs regained from spleen and mesenteric lymph nodes of aGvHD-induced mice on day 6 by flow cytometry. Statistical significance was calculated with Student’s t test; **, P < 0.01. (C–F) Allogenic pure CD90.1+ luc+ WT versus NFATc1/ΔS+ T conv from pretreated DEREG+ mice were transferred together with BM CD90.2+ luc and CD90.1+ luc WT versus NFATc1/ΔS+ T regs in all possible combinations. (C and D) Representative in vivo BLI (C) and ex vivo BLI data from internal organs (D). In vivo data were quantified on days 3 and 5 after aGvHD induction, ex vivo on day 6. Two-way ANOVA; *, P < 0.05; **, P < 0.005; ***, P < 0.001. (E) Estimation of CD25+ Foxp3+ (CD4 gate) T reg frequencies in the presence of WT versus NFATc1/ΔS+ T conv by flow cytometry 6 d after T conv transfer. (F) IL-2 expression per CD4+ T cell (mean fluorescent intensity [MFI]) 6 d after T conv transfer. (G) Frequencies of splenic IL-2+ CD4+ T cells 6 d after T conv transfer, analyzed by flow cytometry and quantified from n = 4; two-way ANOVA; *, P < 0.05.

Similar articles

Cited by

References

    1. Abbas, A.K., Trotta E., Simeonov D.R., Marson A., and Bluestone J.A.. 2018. Revisiting IL-2: Biology and therapeutic prospects. Sci. Immunol. 3. eaat1482. 10.1126/sciimmunol.aat1482 - DOI - PubMed
    1. Bai, X.F., Liu J.Q., Liu X., Guo Y., Cox K., Wen J., Zheng P., and Liu Y.. 2000. The heat-stable antigen determines pathogenicity of self-reactive T cells in experimental autoimmune encephalomyelitis. J. Clin. Invest. 105:1227–1232. 10.1172/JCI9012 - DOI - PMC - PubMed
    1. Beilhack, A., Schulz S., Baker J., Beilhack G.F., Wieland C.B., Herman E.I., Baker E.M., Cao Y.A., Contag C.H., and Negrin R.S.. 2005. In vivo analyses of early events in acute graft-versus-host disease reveal sequential infiltration of T-cell subsets. Blood. 106:1113–1122. 10.1182/blood-2005-02-0509 - DOI - PMC - PubMed
    1. Berberich-Siebelt, F., Berberich I., Andrulis M., Santner-Nanan B., Jha M.K., Klein-Hessling S., Schimpl A., and Serfling E.. 2006. SUMOylation interferes with CCAAT/enhancer-binding protein beta-mediated c-myc repression, but not IL-4 activation in T cells. J. Immunol. 176:4843–4851. 10.4049/jimmunol.176.8.4843 - DOI - PubMed
    1. Berberich-Siebelt, F., Klein-Hessling S., Hepping N., Santner-Nanan B., Lindemann D., Schimpl A., Berberich I., and Serfling E.. 2000. C/EBPbeta enhances IL-4 but impairs IL-2 and IFN-gamma induction in T cells. Eur. J. Immunol. 30:2576–2585. 10.1002/1521-4141(200009)30:9<2576::AID-IMMU2576>3.0.CO;2-N - DOI - PubMed

Publication types

MeSH terms

Substances