

The Spatial Frequency Content of Urban and Indoor Environments as a Potential Risk Factor for Myopia Development
- PMID: 32986814
- PMCID: PMC7533745
- DOI: 10.1167/iovs.61.11.42
The Spatial Frequency Content of Urban and Indoor Environments as a Potential Risk Factor for Myopia Development
Abstract
Purpose: To examine the hypothesis that the spatial frequency spectra of urban and indoor environments differ from the natural environment in ways that may promote the development of myopia.
Methods: A total of 814 images were analyzed from three datasets; University of California Berkeley (UCB), University of Texas (UT), and Botswana (UPenn). Images were processed in Matlab (Mathworks Inc) to map the camera color characteristics to human cone sensitivities. From the photopic luminance images generated, two-dimensional spatial frequency (SF) spectra were calculated and converted to one-dimensional spectra by rotational averaging. The spatial filtering profile of a 0.4 Bangerter foil, which has been shown to induce myopia experimentally, was also determined.
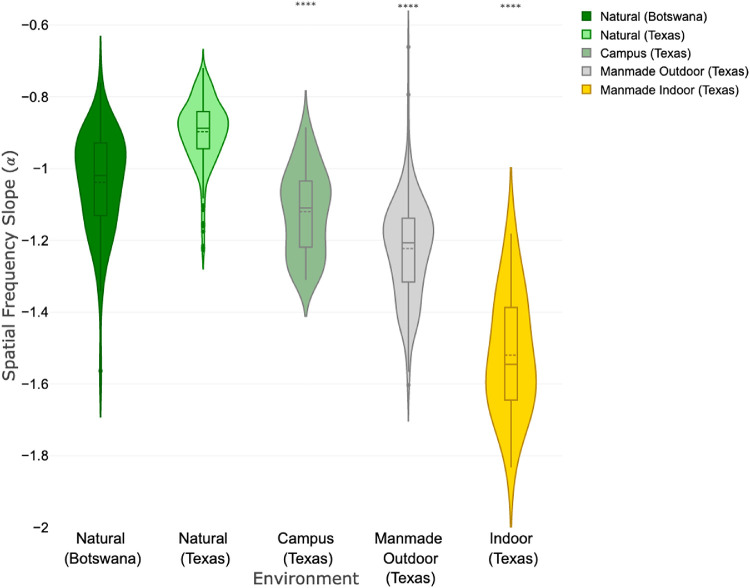
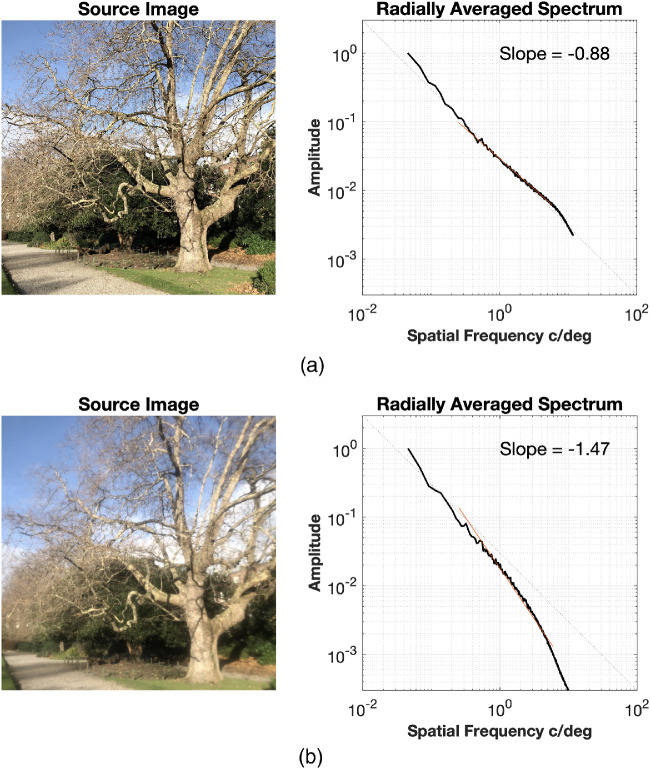
Results: The SF slope for natural scenes followed the recognized 1/fα relationship with mean slopes of -1.08, -0.90, and -1.04 for the UCB, UT and UPenn image sets, respectively. Indoor scenes had a significantly steeper slope (-1.48, UCB; -1.52, UT; P < 0.0001). Urban environments showed an intermediate slope (-1.29, UCB; -1.22, UT) that was significantly different from the slopes derived from the natural scenes (P < 0.0001). The change in SF content between natural outdoor scenes and indoors was comparable to that induced by a 0.4 Bangerter foil, which reduced the SF slope of a natural scene from -0.88 to -1.47.
Conclusions: Compared to natural outdoor images, man-made outdoor and indoor environments have spatial frequency characteristics similar to those known to induce form-deprivation myopia in animal models. The spatial properties of the man-made environment may be one of the missing drivers of the human myopia epidemic.
Conflict of interest statement
Disclosure:
Figures


References
-
- Holden BA, et al. .. Global Prevalence of Myopia and High Myopia and Temporal Trends from 2000 through 2050. Ophthalmology. 2016; 123: 1–7. - PubMed
-
- Cao K, Wan Y, Yusufu M, Wang N. Significance of Outdoor Time for Myopia Prevention: A Systematic Review and Meta-Analysis Based on Randomized Controlled Trials. Ophthalmic Res. 2020; 63: 97–105. - PubMed
MeSH terms
Grants and funding
LinkOut - more resources
Full Text Sources
Other Literature Sources
