. 2021 Mar 9;38(3):876-890.
doi: 10.1093/molbev/msaa248.

Population Genomics Reveals Incipient Speciation, Introgression, and Adaptation in the African Mona Monkey (Cercopithecus mona)

Affiliations

Population Genomics Reveals Incipient Speciation, Introgression, and Adaptation in the African Mona Monkey (Cercopithecus mona)

Adeola Oluwakemi Ayoola et al. Mol Biol Evol. .

Abstract

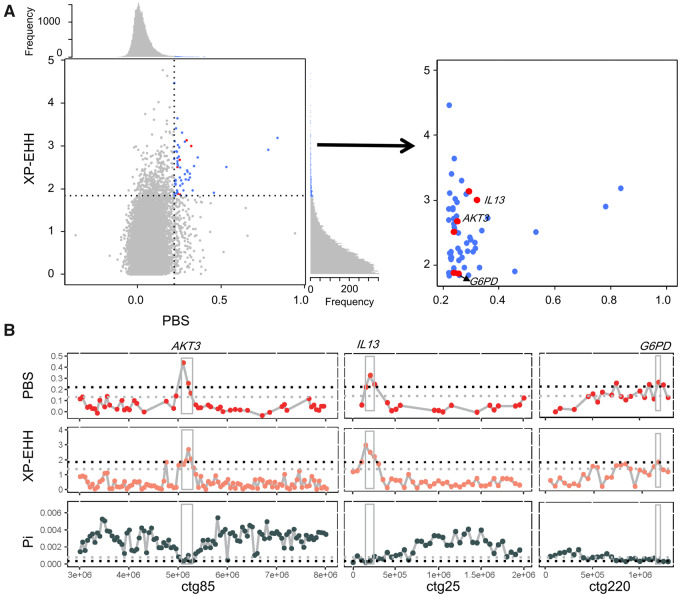
Guenons (tribe Cercopithecini) are the most widely distributed nonhuman primate in the tropical forest belt of Africa and show considerable phenotypic, taxonomic, and ecological diversity. However, genomic information for most species within this group is still lacking. Here, we present a high-quality de novo genome (total 2.90 Gb, contig N50 equal to 22.7 Mb) of the mona monkey (Cercopithecus mona), together with genome resequencing data of 13 individuals sampled across Nigeria. Our results showed differentiation between populations from East and West of the Niger River ∼84 ka and potential ancient introgression in the East population from other mona group species. The PTPRK, FRAS1, BNC2, and EDN3 genes related to pigmentation displayed signals of introgression in the East population. Genomic scans suggest that immunity genes such as AKT3 and IL13 (possibly involved in simian immunodeficiency virus defense), and G6PD, a gene involved in malaria resistance, are under positive natural selection. Our study gives insights into differentiation, natural selection, and introgression in guenons.

Keywords: genome sequencing; guenons; incipient speciation; introgression; natural selection.


Figures

Fig. 1.
Fig. 1.
(A) Image of typical Cercopithecus mona taken at Osun-Osogbo Sacred Grove protected area. (B) Comparative genomics analysis among C. mona and six related primates. Node bars refer to 95% confidence intervals of divergence time and blue triangles indicate fossil-based calibration points (see Materials and Methods).
Fig. 2.
Fig. 2.
Population structure and demographic history of Cercopithecus mona. (A) Sample locations. Rectangles represent sample sites of C. mona used for genome resequencing in this study, and their colors correspond to clades recovered from phylogenetic and population structure analyses. Circle dots refer to mitochondrial genome sequences of other species downloaded from NCBI (supplementary table S10, Supplementary Material online). The geographic locations were described in the original study (Guschanski et al. 2013). (B) Maximum-likelihood tree of C. mona based on all concatenated SNPs. WCa (purple), WCb (red), and East (yellow) indicate three clades referring to West Central clades a and b and East clade, respectively. Outgroup is Cercopithecus mitis (not shown). (C) PCA results. (D) STRUCTURE analyses with K = 2–5. (E) Demographic history inferred from G-PhoCS results. Widths of branches are proportional to effective population size (Ne). Horizontal dashed lines denote posterior estimates for divergence times in thousand years before present, associated mean values are shown in bold, and 95% confidence intervals are given in parentheses. Arrows and numbers indicate direction and percentage of gene flow. (F) PSMC analyses (using a generation time of 8.5 years and an autosomal mutation rate of 8.415 × 10−9 per base pair per generation) show dynamic changes in effective population size. Last Glacial Period (20–70 ka) is shaded in light blue.
Fig. 3.
Fig. 3.
Selected genes in Cercopithecus mona East lineage. (A) Scatter plots of XP-EHH against PBS. Data points in blue correspond to genomic windows in top 1% PBS (=0.2190) and top 1% XP-EHH (=1.8369) ratio distribution. Windows also in low 1% Pi ratio distribution are marked in red, which represent candidate selective regions. Genes involved in SIV and malaria resistances are given. (B) Genes with strong selective sweep signals in C. mona East lineage. Gray and black dashed lines in PBS and XP-EHH indicate top 5% and 1% ratio distributions, respectively, whereas in Pi indicate lower 5% and 1% ratio distributions, respectively.
Fig. 4.
Fig. 4.
Phylogenetic relationships reveal hybridization of East population of Cercopithecus mona with others. (A) Phylogenetic tree of mitochondrial genomes. Details on phylogeny are provided in supplementary figure S10, Supplementary Material online. GenBank ID is provided in supplementary table S10, Supplementary Material online. Numbers beside nodes indicate 95% CIs of divergence time in unit of million years. Tip labels of C. mona consist of species codes followed by locality codes: East (Yellow) and West (WCa, Purple; WCb, Red). Individuals in black were downloaded from NCBI (supplementary table S10, Supplementary Material online). The two samples marked with asterisk are likely specimen mix-up as described in Guschanski et al. (2013). (B) Species tree according to previous studies based on mitochondrial DNA, X-chromosome sequences, Y-chromosome sequences, and karyotypes (Tosi et al. 2005; Moulin et al. 2008; Tosi 2017). Below is relationship according to mitochondrial phylogeny in (A).
Fig. 5.
Fig. 5.
Analysis of introgressed regions. (A) Sketch showing introgression from an unknown Cercopithecus mona group lineage into East population of C. mona, with scale to the left indicating divergence time ka or Ma. (B, C) Genomic introgressed regions and median joining haplotype network tree of PTPRK and BNC2. Number in parentheses on each branch is mutation number. Haplotypes inside gray circle are potential introgressed haplotypes in East population, purple circle embodies other haplotypes. Right of each network is alignment of different haplotypes, with gray rectangle representing potential introgressed haplotypes in East population and purple rectangle representing other haplotypes.

References

    1. Allen WL, Stevens M, Higham JP.. 2014. Character displacement of Cercopithecini primate visual signals. Nat Commun. 5(1):4266. - PMC - PubMed
    1. Altschul SF, Gish W, Miller W, Myers EW, Lipman DJ.. 1990. Basic local alignment search tool. J Mol Biol. 215(3):403–410. - PubMed
    1. Anandam MV, Bennett EL, Davenport TRB, Davies NJ, Detwiler KM, Engelhardt A, Eudey AAG, Gadsby EL, Groves CP, Healy A, et al. 2013. Species accounts of Cercopithecidae. In: Mittermeier R, Rylands A, Wilson D, editors. Handbook of the mammals of the world. Vol. 3. Primates. Barcelona (Spain: ): Lynx. p. 628–753.
    1. Ansari A, Silvestri G, Peeters M, Ma D, Liegeois F, Apetrei C.. 2014. Simian immunodeficiency virus infections in the wild. In: Ansari A, Silvestri G, editors. Natural hosts of SIV. New York: Elsevier. p. 37–67.
    1. Anthony NM, Johnson-Bawe M, Jeffery K, Clifford SL, Abernethy KA, Tutin CE, Lahm SA, White LJT, Utley JF, Wickings EJ, et al. 2007. The role of Pleistocene refugia and rivers in shaping gorilla genetic diversity in central Africa. Proc Natl Acad Sci U S A. 104(51):20432–20436. - PMC - PubMed

Publication types

LinkOut - more resources