

Influence of gene expression on survival of clear cell renal cell carcinoma
- PMID: 32986937
- PMCID: PMC7666730
- DOI: 10.1002/cam4.3475
Influence of gene expression on survival of clear cell renal cell carcinoma
Abstract
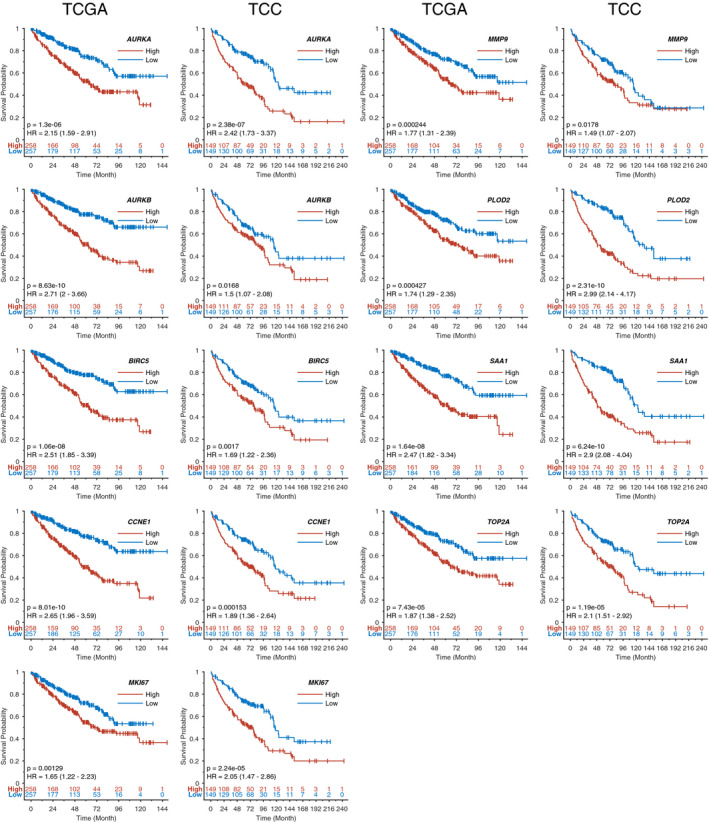
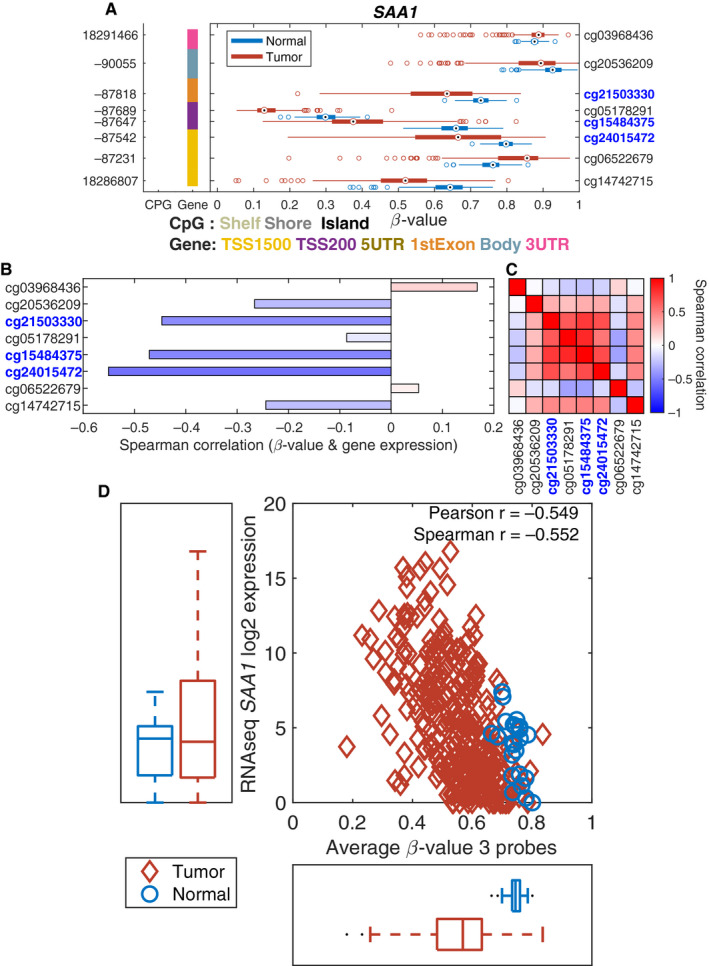
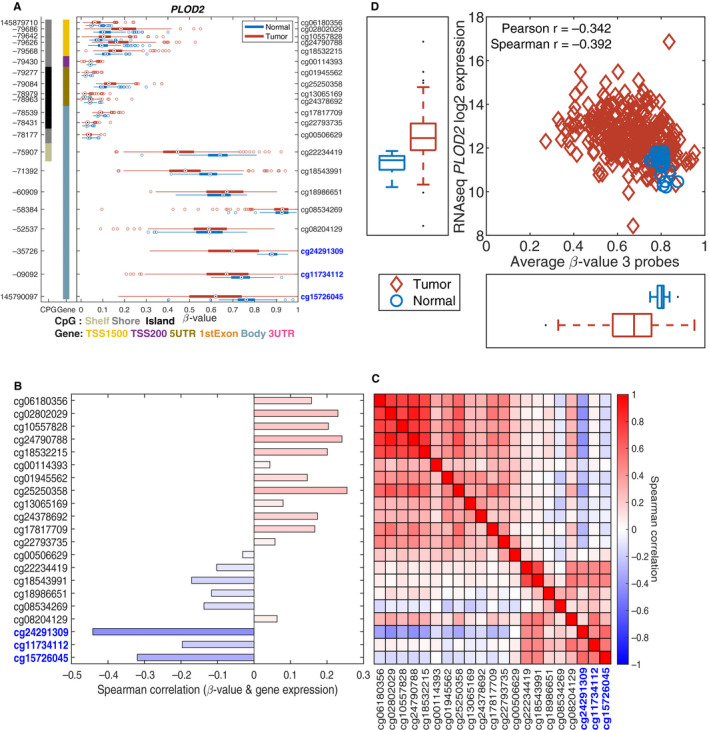
Approximately 10%-20% of patients with clinically localized clear cell renal cell carcinoma (ccRCC) at time of surgery will subsequently experience metastatic progression. Although considerable progression was seen in the systemic treatment of metastatic ccRCC in last 20 years, once ccRCC spreads beyond the confines of the kidney, 5-year survival is less than 10%. Therefore, significant clinical advances are urgently needed to improve overall survival and patient care to manage the growing number of patients with localized ccRCC. We comprehensively evaluated expression of 388 candidate genes related with survival of ccRCC by using TCGA RNAseq (n = 515), Total Cancer Care (TCC) expression array data (n = 298), and a well characterized Moffitt RCC cohort (n = 248). We initially evaluated all 388 genes for association with overall survival using TCGA and TCC data. Eighty-one genes were selected for further analysis and tested on Moffitt RCC cohort using NanoString expression analysis. Expression of nine genes (AURKA, AURKB, BIRC5, CCNE1, MK167, MMP9, PLOD2, SAA1, and TOP2A) was validated as being associated with poor survival. Survival prognostic models showed that expression of the nine genes and clinical factors predicted the survival in ccRCC patients with AUC value: 0.776, 0.821 and 0.873 for TCGA, TCC and Moffitt data set, respectively. Some of these genes have not been previously implicated in ccRCC survival and thus potentially offer insight into novel therapeutic targets. Future studies are warranted to validate these identified genes, determine their biological mechanisms and evaluate their therapeutic potential in preclinical studies.
Keywords: biomarkers; clear cell renal cell carcinoma; gene expression; survival.
© 2020 The Authors. Cancer Medicine published by John Wiley & Sons Ltd.
Conflict of interest statement
No author has COI.
Figures


Similar articles
-
An eleven metabolic gene signature-based prognostic model for clear cell renal cell carcinoma.Aging (Albany NY). 2020 Nov 18;12(22):23165-23186. doi: 10.18632/aging.104088. Epub 2020 Nov 18. Aging (Albany NY). 2020. PMID: 33221754 Free PMC article.
-
A four-gene signature predicts survival in clear-cell renal-cell carcinoma.Oncotarget. 2016 Dec 13;7(50):82712-82726. doi: 10.18632/oncotarget.12631. Oncotarget. 2016. PMID: 27779101 Free PMC article.
-
A novel prognostic model based on immunogenomics for clear cell renal cell carcinoma.Int Immunopharmacol. 2021 Jan;90:107119. doi: 10.1016/j.intimp.2020.107119. Epub 2020 Nov 24. Int Immunopharmacol. 2021. PMID: 33243605
-
The biological roles and clinical implications of microRNAs in clear cell renal cell carcinoma.J Cell Physiol. 2018 Jun;233(6):4458-4465. doi: 10.1002/jcp.26347. Epub 2017 Dec 26. J Cell Physiol. 2018. PMID: 29215721 Review.
-
Exploring necrosis-associated mitochondrial gene signatures: revealing their role in prognosis and immunotherapy of renal clear cell carcinoma.Clin Exp Med. 2024 Jul 18;24(1):161. doi: 10.1007/s10238-024-01426-9. Clin Exp Med. 2024. PMID: 39023752 Free PMC article. Review.
Cited by
-
A Positive Feedback Loop between Inactive VHL-Triggered Histone Lactylation and PDGFRβ Signaling Drives Clear Cell Renal Cell Carcinoma Progression.Int J Biol Sci. 2022 May 13;18(8):3470-3483. doi: 10.7150/ijbs.73398. eCollection 2022. Int J Biol Sci. 2022. PMID: 35637958 Free PMC article.
-
Label-free quantitative proteomics reveals the mechanisms of Aurora kinase B in renal cell carcinoma.SAGE Open Med. 2024 Mar 20;12:20503121241228474. doi: 10.1177/20503121241228474. eCollection 2024. SAGE Open Med. 2024. PMID: 38516642 Free PMC article.
-
Immunogenomic Analyses of the Prognostic Predictive Model for Patients With Renal Cancer.Front Immunol. 2021 Oct 12;12:762120. doi: 10.3389/fimmu.2021.762120. eCollection 2021. Front Immunol. 2021. PMID: 34712244 Free PMC article.
-
The Role of Artificial Intelligence in the Diagnosis and Prognosis of Renal Cell Tumors.Diagnostics (Basel). 2021 Jan 30;11(2):206. doi: 10.3390/diagnostics11020206. Diagnostics (Basel). 2021. PMID: 33573278 Free PMC article. Review.
-
The intrarenal landscape of T cell receptor repertoire in clear cell renal cell cancer.J Transl Med. 2022 Dec 3;20(1):558. doi: 10.1186/s12967-022-03771-3. J Transl Med. 2022. PMID: 36463235 Free PMC article.
References
Publication types
MeSH terms
Substances
Grants and funding
LinkOut - more resources
Full Text Sources
Medical
Miscellaneous
