. 2021 Jan:335:113483.
doi: 10.1016/j.expneurol.2020.113483. Epub 2020 Sep 25.

Acute intermittent hypoxia boosts spinal plasticity in humans with tetraplegia

Affiliations

Acute intermittent hypoxia boosts spinal plasticity in humans with tetraplegia

Lasse Christiansen et al. Exp Neurol. 2021 Jan.

Abstract

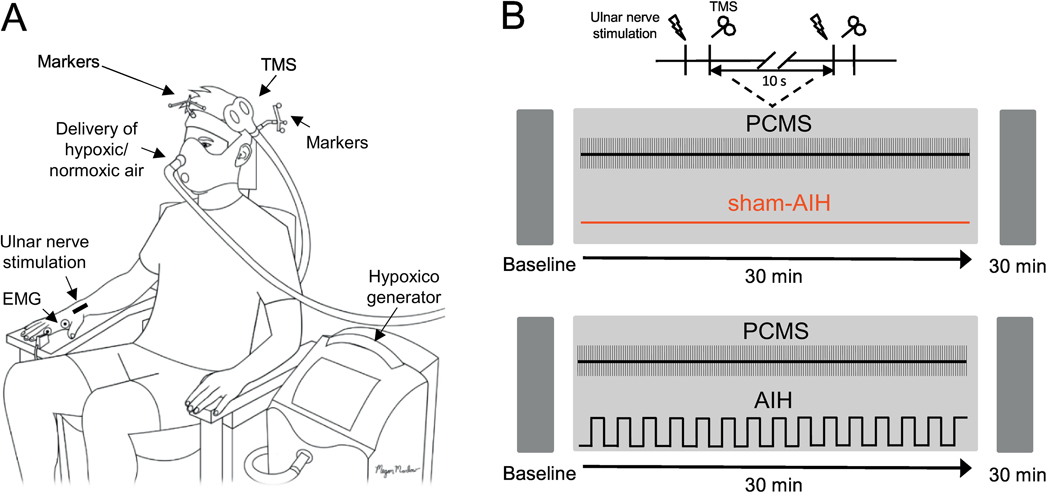
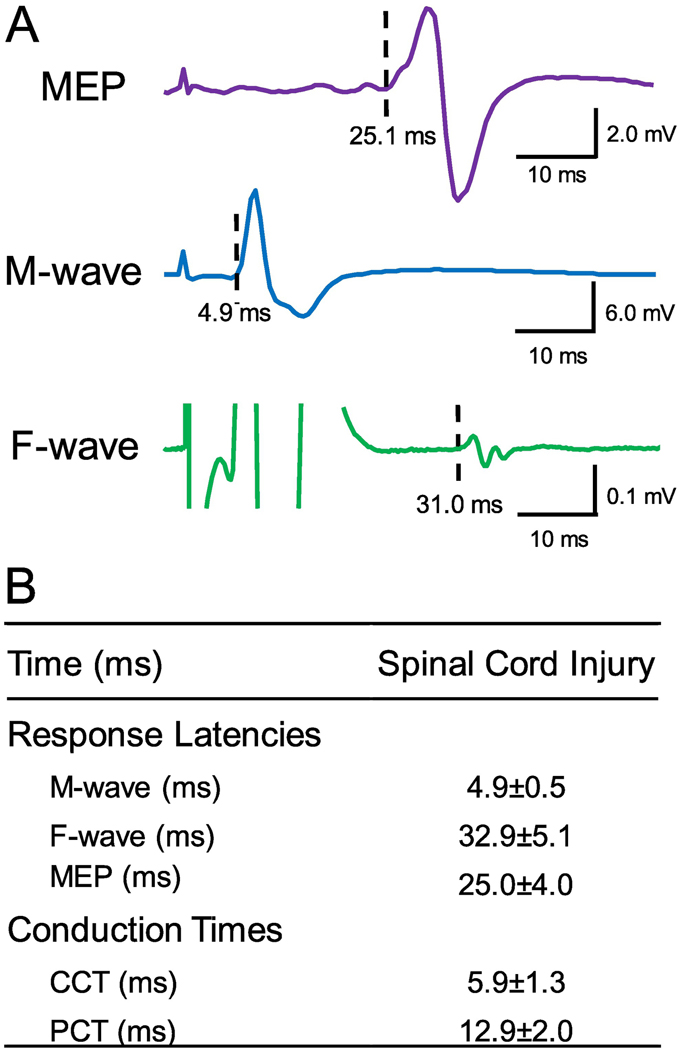
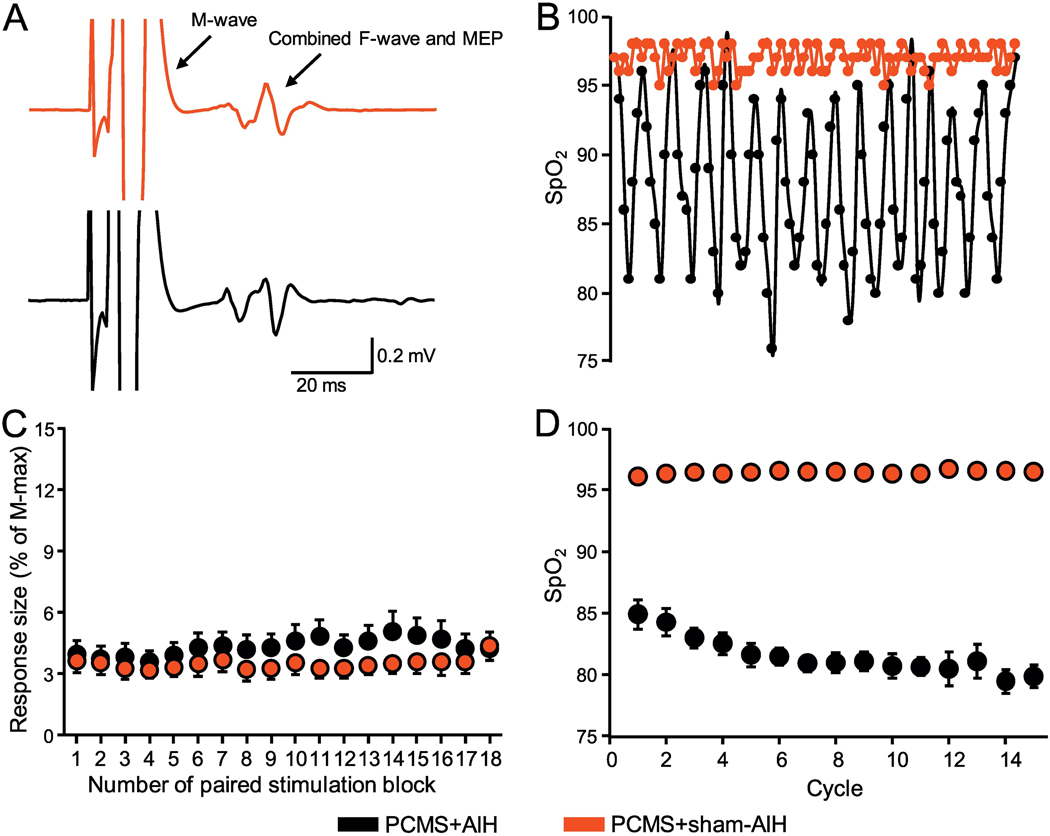
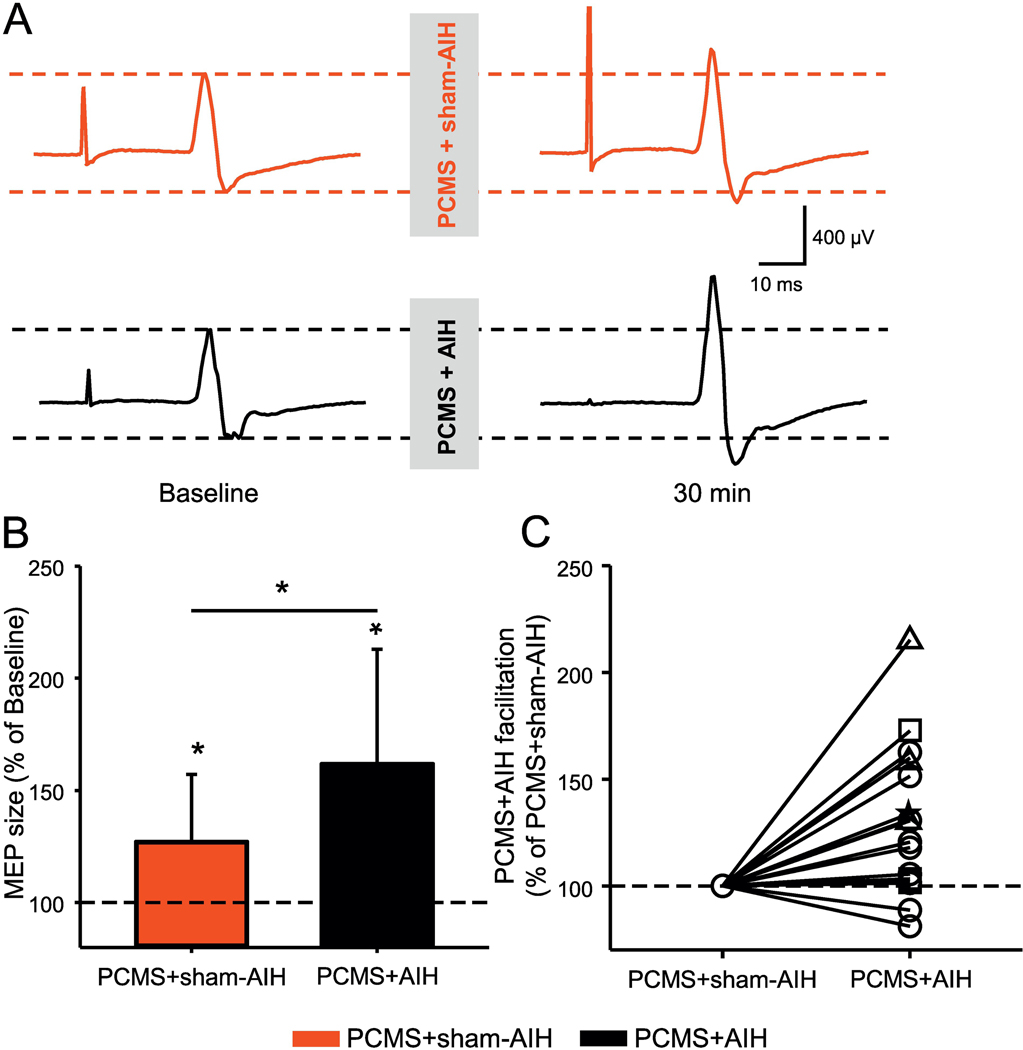
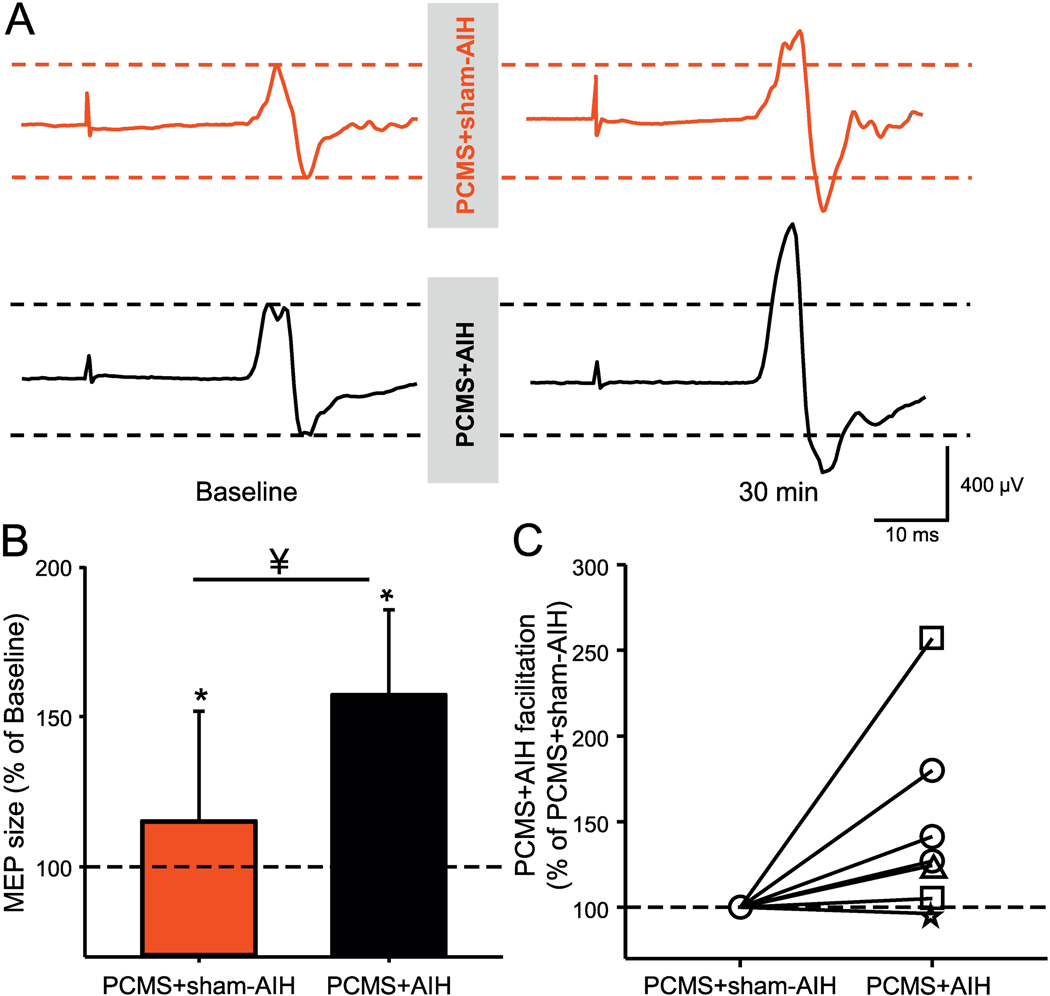
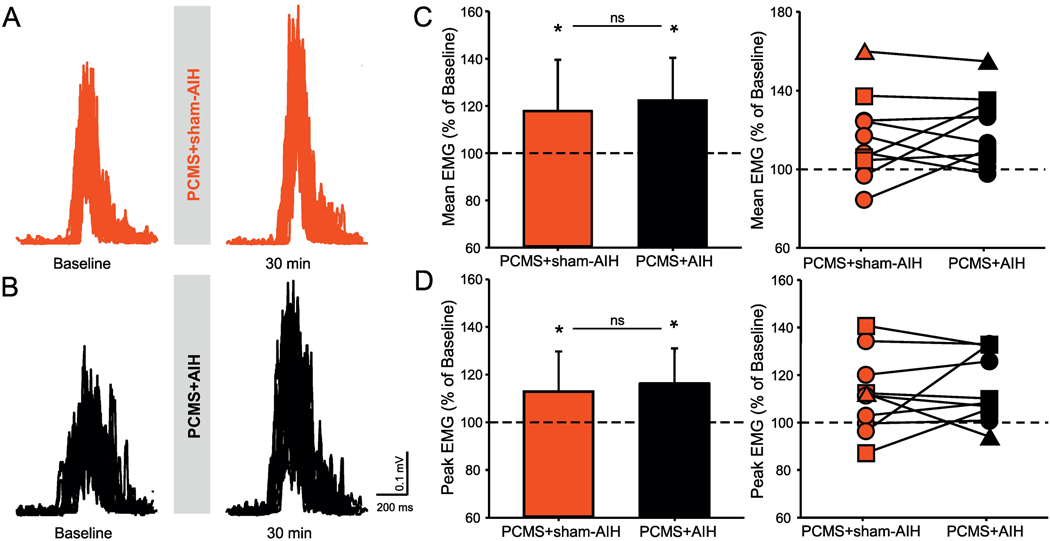
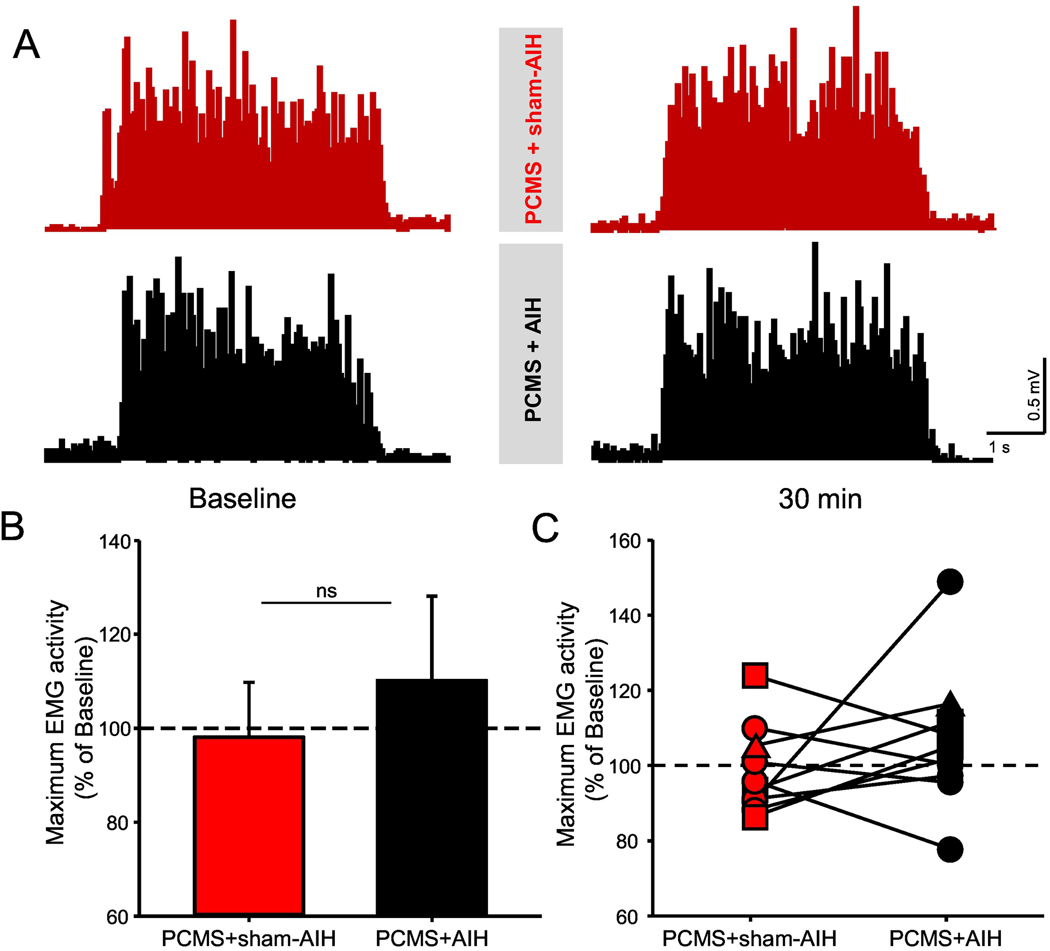
Paired corticospinal-motoneuronal stimulation (PCMS) elicits spinal synaptic plasticity in humans with chronic incomplete cervical spinal cord injury (SCI). Here, we examined whether PCMS-induced plasticity could be potentiated by acute intermittent hypoxia (AIH), a treatment also known to induce spinal synaptic plasticity in humans with chronic incomplete cervical SCI. During PCMS, we used 180 pairs of stimuli where corticospinal volleys evoked by transcranial magnetic stimulation over the hand representation of the primary motor cortex were timed to arrive at corticospinal-motoneuronal synapses of the first dorsal interosseous (FDI) muscle ~1-2 ms before the arrival of antidromic potentials elicited in motoneurons by electrical stimulation of the ulnar nerve. During AIH, participants were exposed to brief alternating episodes of hypoxic inspired gas (1 min episodes of 9% O2) and room air (1 min episodes of 20.9% O2). We examined corticospinal function by measuring motor evoked potentials (MEPs) elicited by cortical and subcortical stimulation of corticospinal axons and voluntary motor output in the FDI muscle before and after 30 min of PCMS combined with AIH (PCMS+AIH) or sham AIH (PCMS+sham-AIH). The amplitude of MEPs evoked by magnetic and electrical stimulation increased after both protocols, but most after PCMS+AIH, consistent with the hypothesis that their combined effects arise from spinal plasticity. Both protocols increased electromyographic activity in the FDI muscle to a similar extent. Thus, PCMS effects on spinal synapses of hand motoneurons can be potentiated by AIH. The possibility of different thresholds for physiological vs behavioral gains needs to be considered during combinatorial treatments.

Keywords: Acute intermittent hypoxia; Paired stimulation; Plasticity; Spinal cord injury.


Figures

Figure 1.
Figure 1.. Experimental set-up.
(A) Participants were seated in a customized chair during paired corticospinal-motoneuronal stimulation (PCMS) combined with acute intermittent hypoxia (PCMS+AIH) and sham AIH (PCMS+sham-AIH). PCMS was delivered using transcranial magnetic stimulation (TMS) over the hand representation of the primary motor cortex and supramaximal peripheral nerve stimulation (PNS) over the ulnar nerve with 180 pairs of stimuli delivered every 10 s (0.1 Hz). The position of the TMS coil was monitored using a frameless stereotaxic system and electromyographic (EMG) activity was recorded from the first dorsal interosseous (FDI) muscle to record electrophysiological outcomes. AIH was administered by using the Hypoxico Inc. (EVEREST SUMMIT II, New York) and the protocol consisted of 15 cycles of 1 min of inspiring ambient air with 1 min of hypoxic air. (B) Timeline of the experimental procedures. Electrophysiological outcomes were measured before (Baseline) and 30 min after each protocol.
Figure 2.
Figure 2.. Response latencies.
(A) Raw traces showing a motor-evoked potential (MEP), an F-wave, and the maximal motor response (M-max) for representative subject from the FDI muscle. (B) MEP, F-wave, and M-max latencies were used to calculate central (CCT) and peripheral conduction time (PCT) used to estimate time the arrival of pre- and postsynaptic volleys at the cortico-motoneuronal synapses for PCMS in SCI subjects.
Figure 3.
Figure 3.. Monitoring during protocols.
(A) Raw traces from the FDI muscle during PCMS+sham-AIH and PCMS+AIH. Note that the M-wave is followed by an F-wave that is likely to be combined with a MEP elicited by TMS. (B) SpO2 from a representative participant during the PCMS+sham-AIH (red) and PCMS+AIH (black) protocols. The AIH protocol consisted of 15 cycles of 1 min of inspiring ambient air (20.9% O2) with 1 min of hypoxic air (9.4% O2). (C) The abscissa shows the number of pairs of stimuli during each protocol (a total of 180 pairs of stimuli). At each point, the average of 10 responses is shown. The ordinate shows the size of the conditioned response expressed as % of the M-max in SCI participants during PCMS+sham-AIH and PCMS+AIH. (D) Group data showing the SpO2 observed during the 15 cycles in the PCMS+sham-AIH (red) and PCMS+AIH (black) protocol.
Figure 4.
Figure 4.. MEPs elicited by TMS.
(A) Representative MEP traces recorded from the FDI muscle in a SCI participant before and 30 min after PCMS+sham-AIH (red traces) and PCMS+AIH (black traces). Waveforms represent the average of 20 MEPs. (B) Graph shows group data (n=16). The abscissa shows the protocols tested (PCMS+sham-AIH=red bar and PCMS+AIH=black bar) and the ordinate shows the size of MEPs expressed as a % of MEPs at baseline. (C) Graph shows individual data (AIS A=triangle, AIS B=star, AIS C=square, and AIS D=circle). The ordinate shows the % of changes in MEP amplitude after PCMS+AIH expressed as % of the changes after PCMS+sham-AIH. The dotted line indicates the baseline. Error bars indicate SDs. *p<0.05, comparison with baseline; ¥p<0.05, comparison between PCMS+sham-AIH and PCMS+AIH protocols.
Figure 5.
Figure 5.. MEPs elicited by electrical stimulation at the cervicomedullary level.
(A) Raw MEPs traces recorded from the FDI muscle of a representative SCI participant before and 30 min after PCMS+sham-AIH (red traces) and PCMS+AIH (black traces). Waveforms represent the average of 20 MEPs. (B) The graph shows group data (n=9) with the abscissa showing the protocols tested (PCMS+sham-AIH=red bar and PCMS+AIH=black bar) and the ordinate showing the size of MEPs expressed as % of MEPs at baseline. (C) Graph shows individual data (AIS A=triangle, AIS B=star, AIS C=square, and AIS D=circle). The ordinate shows the % of changes in MEP amplitude after PCMS+AIH expressed as a % of the facilitation after PCMS+sham-AIH. The dotted line indicates the baseline. Error bars indicate SDs. *p<0.05, comparison with baseline; ¥p<0.05, comparison between PCMS+sham-AIH and PCMS+AIH protocols.
Figure 6.
Figure 6.. Small level of voluntary contraction.
Representative EMG traces recorded during small level of voluntary contraction in a participant with SCI before and after (A) PCMS+sham-AIH (red traces) and (B) PCMS+AIH (black traces). Graphs show the group (n=10) and individual (AIS A=triangle, AIS C=square, and AIS D=circle) data. The abscissa shows the protocols tested (PCMS+sham-AIH=red bars and PCMS+AIH=black bars) and the ordinate shows the mean (C) and peak (D) EMG activity expressed as % of baseline EMG in the FDI muscle during small level of voluntary contractions (10% MVC) tested. The dotted line indicates the baseline. Error bars indicate SDs. *p<0.05, comparison with baseline.
Figure 7.
Figure 7.. Maximum voluntary contraction (MVC).
(A) Representative EMG traces recorded during MVC (measured as the highest mean rectified EMG activity found in 1 s during the MVC burst) in a participant with SCI before and after PCMS+sham-AIH (red traces) and PCMS+AIH (black traces). (B) Graph shows the group data (n=10). The abscissa shows the protocols tested (PCMS+sham-AIH=red bars and PCMS+AIH=black bars) and the ordinate shows the mean EMG activity expressed as % of baseline during MVC. (C) Graph shows individual data (AIS A=triangle, AIS C=square, and AIS D=circle). The ordinate shows the magnitude change in MVC after 30 min of PCMS+sham-AIH (red circles) and PCMS+AIH (black circles). The dotted line indicates the baseline. Error bars indicate SDs. *p<0.05, comparison with baseline.

References

    1. Angeli CA, Edgerton VR, Gerasimenko YP, Harkema SJ, 2014. Altering spinal cord excitability enables voluntary movements after chronic complete paralysis in humans. Brain 137, 1394–1409. - PMC - PubMed
    1. Arvanian VL, Mendell LM, 2001. Removal of NMDA receptor Mg(2+) block extends the action of NT-3 on synaptic transmission in neonatal rat motoneurons. J Neurophysiol 86, 123–129. - PubMed
    1. Bach KB, Mitchell GS, 1996. Hypoxia-induced long-term facilitation of respiratory activity is serotonin dependent. Respiration physiology 104, 251–260. - PubMed
    1. Baker-Herman TL, Fuller DD, Bavis RW, Zabka AG, Golder FJ, Doperalski NJ, Johnson RA, Watters JJ, Mitchell GS, 2004. BDNF is necessary and sufficient for spinal respiratory plasticity following intermittent hypoxia. Nat Neurosci 7, 48–55. - PubMed
    1. Baker-Herman TL, Mitchell GS, 2002. Phrenic long-term facilitation requires spinal serotonin receptor activation and protein synthesis. The Journal of neuroscience : the official journal of the Society for Neuroscience 22, 6239–6246. - PMC - PubMed

Publication types

MeSH terms