. 2020 Nov:357:104210.
doi: 10.1016/j.cellimm.2020.104210. Epub 2020 Sep 5.

Multiple genetic programs contribute to CD4 T cell memory differentiation and longevity by maintaining T cell quiescence

Affiliations

Multiple genetic programs contribute to CD4 T cell memory differentiation and longevity by maintaining T cell quiescence

Nianbin Song et al. Cell Immunol. 2020 Nov.

Abstract

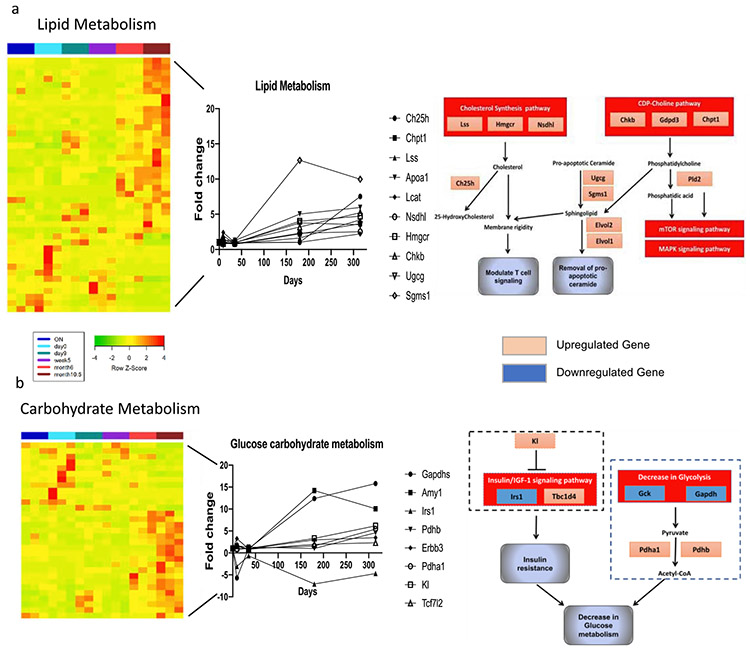
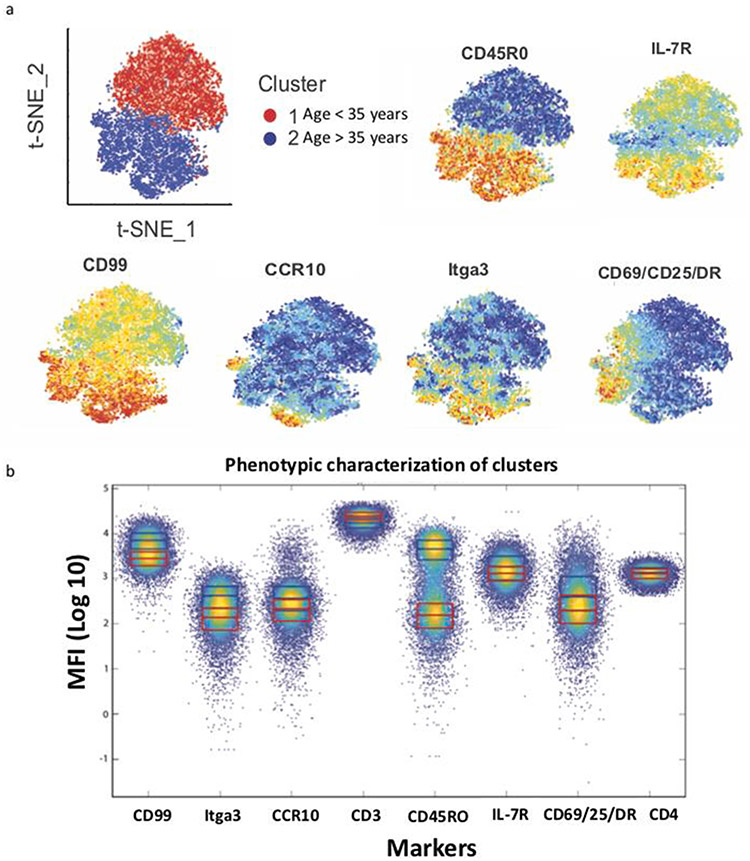
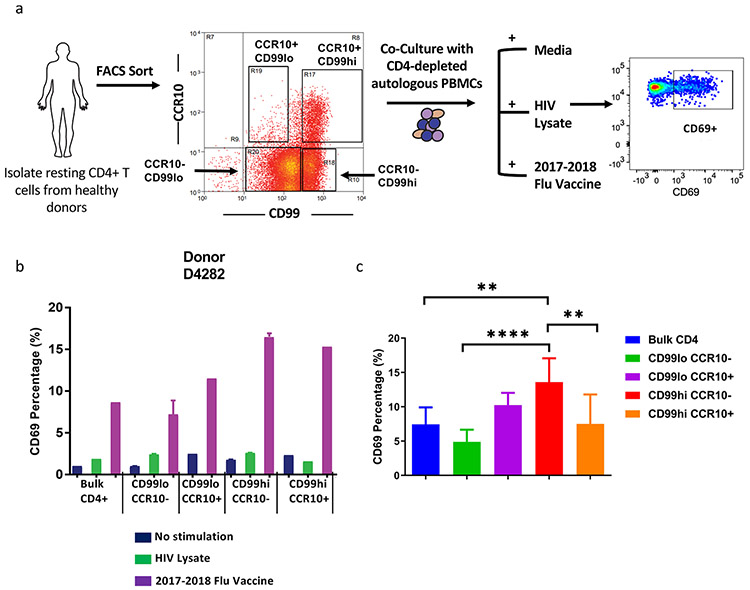
While memory T-cells represent a hallmark of adaptive immunity, little is known about the genetic mechanisms regulating the longevity of memory CD4 T cells. Here, we studied the dynamics of gene expression in antigen specific CD4 T cells during infection, memory differentiation, and long-term survival up to nearly a year in mice. We observed that differentiation into long lived memory cells is associated with increased expression of genes inhibiting cell proliferation and apoptosis as well as genes promoting DNA repair response, lipid metabolism, and insulin resistance. We identified several transmembrane proteins in long-lived murine memory CD4 T cells, which co-localized exclusively within the responding antigen-specific memory CD4 T cells in human. The unique gene signatures of long-lived memory CD4 T cells, along with the new markers that we have defined, will enable a deeper understanding of memory CD4 T cell biology and allow for designing novel vaccines and therapeutics.

Keywords: CD4 T cell; Cell longevity; Gene; Genetic programs; Memory T cell; Memory cell markers.


Conflict of interest statement

Declaration of Competing Interest

The authors declare that they have no known competing financial interests or personal relationships that could have appeared to influence the work reported in this paper.

Figures

Fig. 1.
Fig. 1.. Dynamics of gene expression patterns in DO11.10 CD4 T cells.
a) Schematics of the experimental design. 6000 DO11.10 Tg cells, specific to the OVA (323–339) epitope in complex with H-2d, were adoptively transferred into 8-week old BALB/c recipient mice 24 h before immunization with Vaccinia-OVA virus. Dynamics of gene expression were studied in FACS-sorted CD4 KJ1.26+ CD44+ T cells from lymph nodes and spleens of the recipient mice at day 9, 5 weeks (35 days), 6 months (180 days) and 10.5 months (320 days) post immunization. FACS-sorted CD4 KJ1.26+ CD44 T cells from age-matched naïve mice served as age control for day 0 and 10.5 months in microarray experiments. For each time point, cell samples were pooled from 5 mice for each cage with 3 cages in total, thus 3 biological replicates were used for statistics in microarray. b). Selection of gene clusters based on expression dynamics. The microarray data was submitted into Expander software, which grouped all the genes into 16 clusters based on their expression patterns on day 0, day 9, week 5, month 6, and month 10.5 post immunization. The y-axis shown in each cluster is the fold changes of the relative intensities of genes normalized by log2.
Fig. 2.
Fig. 2.. Expression dynamics and functions of genes in three gene ontology (GO) terms.
Genes that were differentially expressed between 10.5 months post immunization and day 0 were submitted to DAVID database to identify those associated with the five GO terms enriched in “memory specific clusters” in Fig. 1b. Global expression heatmaps of genes associated with GO terms “cell proliferation” (a), “DNA repair” (b) or “apoptosis” (c) were created with a row Z-Score ranges from −4 to 4(left panel). A few representative genes from each GO term gene group were selected with fold changes in their expression levels at different time points comparing to day 0 (middle panel). The potential function and related pathways of these selected genes were depicted (right panel). Genes were differentially (fold change > 2, p-value < 0.05) upregulated (pink box), downregulated (blue box) or not differentially expressed (white box) in 10.5 months post immunization compared to day 0. Genes in red circle have been shown in literature to be able to form complexes. Arrows between genes/pathways indicate positive regulation and lines with blunt end between genes/pathways indicate negative regulation by literature references.
Fig. 3.
Fig. 3.. Expression dynamics and functions of genes in two gene ontology (GO) terms.
Genes that were differentially expressed between 10.5 months post immunization and day 0 were submitted to DAVID database to identify those associated with the five GO terms enriched in “memory specific clusters” in Fig. 1b. Global expression heatmaps of genes associated with GO terms “lipid metabolism”(a) or “carbohydrate metabolism”(b) were created with a row Z-Score ranges from −4 to 4 (left panel). A few representative genes from each GO term gene group were selected with fold changes in their expression levels at different time points comparing to day 0 (middle panel). The potential function and related pathways of these selected genes were depicted (right panel). Genes were differentially (fold change > 2, p-value < 0.05) upregulated (pink box), downregulated (blue box) in 10.5 months post immunization compared to day 0. Genes in dotted square are viewed as a whole mechanism impacting other pathways. Arrows between genes/pathways indicate positive regulation and lines with blunt end between genes/pathways indicate negative regulation by literature references.
Fig. 4.
Fig. 4.. Expression of selected membrane associated proteins in quiescent H5N1 specific memory CD4 T cells in DR1 mice
a) DR1 mice were injected with H5N1 vaccine and CpG i.p., and 4 months later, draining lymph nodes were extracted and cells incubated for 7 days without any stimulation, or stimulated by either H5N1 HA1 protein or H5N1 vaccine in the media. The cells were then stained with H5N1 (Left top panels) or CLIP tetramers (Left bottom panels), as well as CD44 and other antibodies for flow cytometry analysis. Dots show the CD44hi Tetramer+ lymphocytes after exclusion of macrophages, B cells and CD8+ T cells. The flow data from 4 repeated experiments is summarized on the right panel, p = 0.88. b) Expression dynamics of several selected membrane associated genes during memory CD4 T cell development (c) Expression of different selected membrane/surface markers on CD4 CD44hi H5N1 tetramer+ memory cells in spleen (orange), CD4 CD44hi H5N1 tetramer+ activated cells (red) and CD4 CD44lo naïve cells (blue). The cells are from the CD4 CD44hi Tetramer+ population (for activated CD4 T cells and CD4 memory T cells) or CD4CD44lo population (for naïve CD4 T cells) shown in Supplemental figure 9. d) Summary of MFI levels in protein expression among memory CD4 T cells, activated CD4 T cells and naïve T cells from 3 repeated experiments. Data are presented as mean ± standard deviation. Asterisks denote statistical significance: **** P < .0001, *** P < .001, ** P < .01, * P < .05, Student’s two-tailed paired ratio T-test.
Fig. 5.
Fig. 5.. Several putative long-term memory markers from the murine microarray analysis exclusively co-localize with existing human memory marker CD45R0.
a) The percentage of CD99hi, CCR10+, Itga3+ and IL7R+ expression gated on resting CD4 T cells of 12 healthy donors. b) Resting CD4T cells that either expressed high levels of the putative memory markers from our microarray analysis – CD99 (CD99hi), CCR10, or Itga3 – were assayed for the presence or absence of canonical memory marker CD45R0. Notably, nearly 100% of cells expressing these putative markers also expressed CD45R0 (CD45R0+). c) Cells that either express or lack CD45R0, indicated as CD45R0 in the figure (i.e. CD45RA+), were assayed for relative frequencies of CD99hi, CCR10+, Itga3+ and IL7R+. The percentages and MFI of CD99, CCR10 and Itga3 positive populations in either CD45R0+ or CD45R0 compartments reveal an enrichment of these markers in the CD45R0+ compartment, to a degree comparable to that of IL-7Rhi cells. Data are presented as mean or mean ± standard deviation. Asterisks denote statistical significance: **** P < .0001, *** P < .001, Student’s two-tailed paired ratio T-test, n = 12.
Fig. 6.
Fig. 6.. Expression of memory markers increase with aging in human cohorts.
a) The median expression levels of various protein markers for CD4 memory T cells stained by flow cytometry were summarized for comparison between two cohorts of individuals with different age ranges (> =35 years or < 35 years). Cluster 1 represents protein expression levels in cohorts of healthy donors (age < 35 years) while cluster 2 represents protein expression levels in cohorts of healthy donors (age > = 35 years). The protein expression levels used by ExCyt for t-SNE analysis were based on CD45RO expression from flow cytometry staining of CD4 T cells in two cohorts of healthy human individuals with varied age and gender (N = 12). b) CD99, CCR10, Itga3 and IL7R all have higher expression levels in healthy donors with age > =35 years, and notably all co-localize with cells expressing high levels of CD45R0.
Fig. 7.
Fig. 7.. CD4 T cells that have high expression levels of adhesion molecule CD99 exhibit enhanced responsiveness to in vitro flu vaccine challenge than the bulk CD4 T cell population, and depleting cells expressing high levels of this marker blunts the anti-flu recall response.
a) Four different CD4 T cell subsets (CD99lo CCR10, CD99lo CCR10+, CD99hi CCR10, CD99hi CCR10+) were sorted based on the expression of CD99 and CCR10 and cultured with media alone, HIV lysate or the 2017–2018 attenuated flu vaccine in vitro with CD4-depleted autologous PBMCs for 17–19 h. The percentage of CD69+ cells was used as readout for activation. b) The percentages of CD69+ CD4 T cells from different sorted subsets in a representative healthy donor under three different in vitro stimulation conditions are shown. All healthy human donors were vaccinated with 2017–2018 flu vaccine a year ago before donating blood. The error bars represent mean ± SD. c) Summary of responses from stimulated four sorted subsets to 2017–2018 flu vaccine in three healthy donors. Error bars represent mean ± SD. ** P < .01, **** P < .0001. Student’s two-tailed paired ratio T-test.

Similar articles

Cited by

References

    1. Akondy RS, Fitch M, Edupuganti S, Yang S, Kissick HT, Li KW, Youngblood BA, Abdelsamed HA, McGuire DJ, Cohen KW, et al., Origin and differentiation of human memory CD8 T cells after vaccination, Nature 552 (2017) 362–367. - PMC - PubMed
    1. Appay V, Bosio A, Lokan S, Wiencek Y, Biervert C, Kusters D, Devevre E, Speiser D, Romero P, Rufer N, Leyvraz S, Sensitive gene expression profiling of human T cell subsets reveals parallel post-thymic differentiation for CD4 + and CD8+ lineages, J Immunol 179 (2007) 7406–7414. - PubMed
    1. Araki K, Turner AP, Shaffer VO, Gangappa S, Keller SA, Bachmann MF, Larsen CP, Ahmed R, mTOR regulates memory CD8 T-cell differentiation, Nature 460 (2009) 108–112. - PMC - PubMed
    1. Bian A, Neyra JA, Zhan M, Hu MC, Klotho, stem cells, and aging, Clin Interv Aging 10 (2015) 1233–1243. - PMC - PubMed
    1. Bietz A, Zhu H, Xue M, Xu C, Cholesterol Metabolism in T Cells, Front Immunol 8 (2017) 1664. - PMC - PubMed

Publication types