. 2020 Sep 24;12(10):2749.
doi: 10.3390/cancers12102749.

HSPA2 Chaperone Contributes to the Maintenance of Epithelial Phenotype of Human Bronchial Epithelial Cells but Has Non-Essential Role in Supporting Malignant Features of Non-Small Cell Lung Carcinoma, MCF7, and HeLa Cancer Cells

Affiliations

HSPA2 Chaperone Contributes to the Maintenance of Epithelial Phenotype of Human Bronchial Epithelial Cells but Has Non-Essential Role in Supporting Malignant Features of Non-Small Cell Lung Carcinoma, MCF7, and HeLa Cancer Cells

Damian Robert Sojka et al. Cancers (Basel). .

Abstract

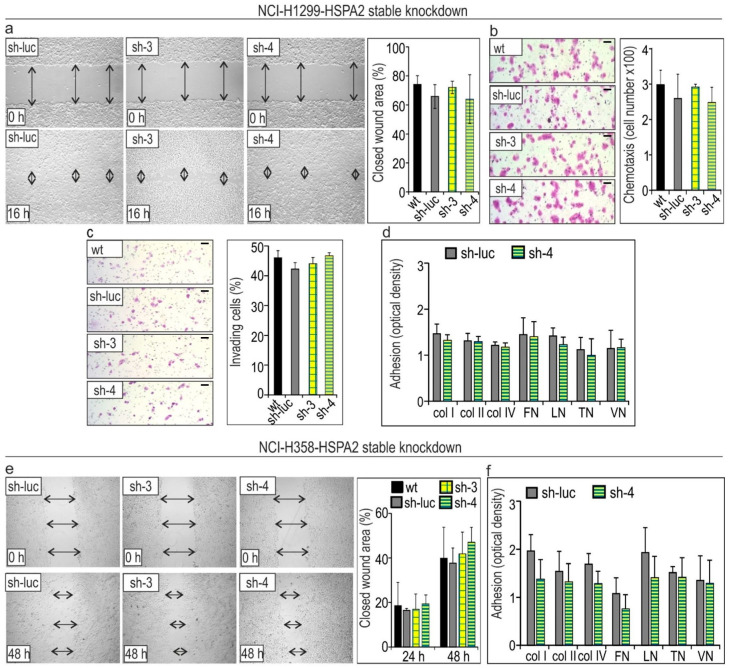
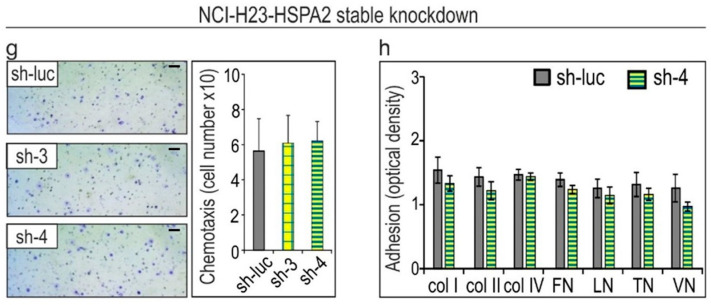
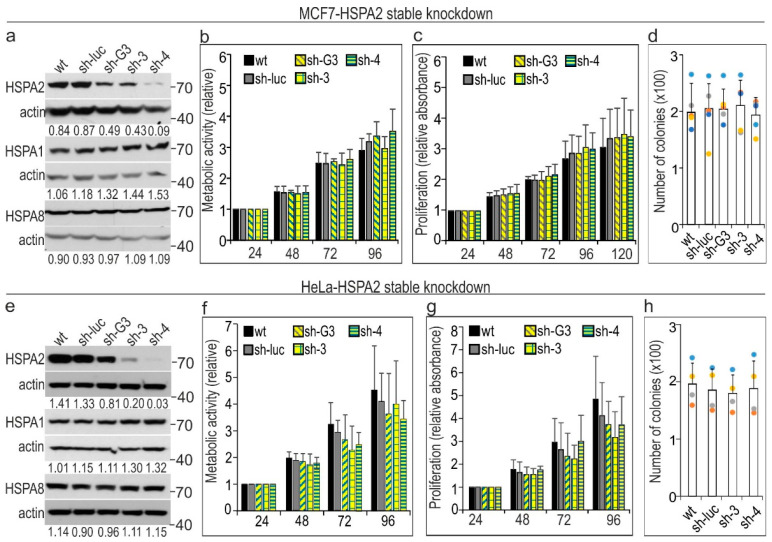
Heat Shock Protein A2 (HSPA2) is a member of the HSPA (HSP70) chaperone family and has a critical role for male fertility. HSPA2 is present in a number of somatic organs. Limited evidence suggests that HSPA2 may be involved in regulating epithelial cell differentiation. HSPA2 also emerged as a cancer-related chaperone; however, no consensus on its functional significance has been reached so far. In this study, we compared the phenotypic effects of HSPA2 deficit in non-transformed human bronchial epithelial cells (HBEC), and in lung, breast, and cervical cancer cells. We used various techniques to inhibit the HSPA2 gene expression in order to examine the impact of HSPA2 deficiency on cell growth, migration, adhesion, and invasion. Our results show that HBEC but not cancer cells are sensitive to HSPA2 deficit. HSPA2 knockdown in HBEC cells impaired their clone-forming ability and adhesiveness. Thus, our results indicate that epithelial cells can rely on a specific activity of HSPA2, but such dependence can be lost in epithelial cells that have undergone malignant transformation.

Keywords: HSP70; HSPA2; adhesion; breast cancer; bronchial epithelial cells; cell growth; cervical cancer; heat shock protein; malignant phenotype; non-small cell lung carcinoma.


Conflict of interest statement

The authors declare no conflict of interest.

Figures

Figure 1
Figure 1
Heat Shock Protein A2 (HSPA2) level in wild-type cells (wt; black bars), modified control cells (sh-luc, CRISPR-ctr; gray bars), and HSPA2-deficient cells (sh-G3, sh-3, sh-4; yellow and green bars patterns, CRISPR-A2; green bar). sh-G3, sh-3, sh-4, and sh-luc cells were modified using the lentiviral vectors encoding the HSPA2-targetting and non-targeting shRNA sequences, respectively. CRISPR-ctr and CRISPR-A2 were generated using the CRISPR/Cas9 gene editing method. (a) Immunoblots showing HSPA2 level in wild- type cells. Representative immunoblots are shown (n = 3; molecular weight in kDa is indicated); actin was used as a protein loading control. Numbers below each lane represent the protein ratio normalized to the actin level. (b) Densitometric analysis of immunoblots (BEAS-2B, n = 4; NCI-H1299, n = 8; NCI-H23, n = 3; NCI-H358, n = 4; NCI-H520, n = 5; MCF7, n = 5; HeLa, n = 3) was performed using ImageJ Software. The relative protein level is shown after normalization to reporter protein level (actin). Statistical significance was calculated in relation to modified control using two-tailed t-test. CRISPR-A2, cells transfected with gene editing CRISPR/Cas9 (clustered regularly interspaced short palindromic repeats and CRISPR-associated protein 9) plasmids; CRISPR-ctr, control cells transfected with negative control plasmid. * p < 0.05 versus sh-luc or CRISPR-ctr cells, statistical significance was calculated using the two-tailed t-test.
Figure 1
Figure 1
Heat Shock Protein A2 (HSPA2) level in wild-type cells (wt; black bars), modified control cells (sh-luc, CRISPR-ctr; gray bars), and HSPA2-deficient cells (sh-G3, sh-3, sh-4; yellow and green bars patterns, CRISPR-A2; green bar). sh-G3, sh-3, sh-4, and sh-luc cells were modified using the lentiviral vectors encoding the HSPA2-targetting and non-targeting shRNA sequences, respectively. CRISPR-ctr and CRISPR-A2 were generated using the CRISPR/Cas9 gene editing method. (a) Immunoblots showing HSPA2 level in wild- type cells. Representative immunoblots are shown (n = 3; molecular weight in kDa is indicated); actin was used as a protein loading control. Numbers below each lane represent the protein ratio normalized to the actin level. (b) Densitometric analysis of immunoblots (BEAS-2B, n = 4; NCI-H1299, n = 8; NCI-H23, n = 3; NCI-H358, n = 4; NCI-H520, n = 5; MCF7, n = 5; HeLa, n = 3) was performed using ImageJ Software. The relative protein level is shown after normalization to reporter protein level (actin). Statistical significance was calculated in relation to modified control using two-tailed t-test. CRISPR-A2, cells transfected with gene editing CRISPR/Cas9 (clustered regularly interspaced short palindromic repeats and CRISPR-associated protein 9) plasmids; CRISPR-ctr, control cells transfected with negative control plasmid. * p < 0.05 versus sh-luc or CRISPR-ctr cells, statistical significance was calculated using the two-tailed t-test.
Figure 2
Figure 2
HSPA2 silencing in the immortalized bronchial epithelial BEAS-2B cell line. (a) Immunoblots show the protein levels of HSPA2, HSPA1, and HSPA8 in wild type (wt); control sh-luc cells transduced with non-targeting shRNA-luc sequence; sh-G3, sh-3, and sh-4 cells transduced with HSPA2-targeting shRNAG3, shRNA3, or shRNA4 sequences, respectively. Numbers below each lane represent the protein ratio normalized to the actin level. Representative immunoblots are shown (n = 4; molecular weight in kDa is indicated); actin was used as a protein loading control. (b) Cell metabolic activity was tested using the MTS assay. Results are expressed as mean ± SD (n = 4, each in three technical repeats) in relation to values obtained at 24 h after plating. (c) Cell proliferation during 24–96 h of growth was examined using crystal violet staining assay (n = 4; each in three technical repeats). (d) Results of colony formation assay. Cells were plated onto six-well dishes (1.5 × 10³ cells/well) and cultured for 7 days. Colonies were counted manually (mean ± SD, n = 5, each in three technical repeats). Each dot color represents results of one of five independent experiments. * p < 0.05 versus sh-luc cells, statistical significance was calculated using the two-tailed t-test.
Figure 2
Figure 2
HSPA2 silencing in the immortalized bronchial epithelial BEAS-2B cell line. (a) Immunoblots show the protein levels of HSPA2, HSPA1, and HSPA8 in wild type (wt); control sh-luc cells transduced with non-targeting shRNA-luc sequence; sh-G3, sh-3, and sh-4 cells transduced with HSPA2-targeting shRNAG3, shRNA3, or shRNA4 sequences, respectively. Numbers below each lane represent the protein ratio normalized to the actin level. Representative immunoblots are shown (n = 4; molecular weight in kDa is indicated); actin was used as a protein loading control. (b) Cell metabolic activity was tested using the MTS assay. Results are expressed as mean ± SD (n = 4, each in three technical repeats) in relation to values obtained at 24 h after plating. (c) Cell proliferation during 24–96 h of growth was examined using crystal violet staining assay (n = 4; each in three technical repeats). (d) Results of colony formation assay. Cells were plated onto six-well dishes (1.5 × 10³ cells/well) and cultured for 7 days. Colonies were counted manually (mean ± SD, n = 5, each in three technical repeats). Each dot color represents results of one of five independent experiments. * p < 0.05 versus sh-luc cells, statistical significance was calculated using the two-tailed t-test.
Figure 3
Figure 3
HSPA2 is dispensable for the growth of non-small cell lung carcinoma (NSCLC) cells. (a–d) Effects of stable HSPA2 knockdown on the growth of NCI-H358 cells. Control sh-luc cells were stably transduced with the non-targeting shRNA-luc sequence; sh-3 and sh-4 cells were stably transduced with the HSPA2-targeting shRNA3 or shRNA4 sequences, respectively. (e–h) The HSPA2 gene knockout in NCI-H1299 cells did not affect cell growth. CRISPR-A2, cells transfected with gene editing CRISPR/Cas9 plasmids; CRISPR-ctr, control cells transfected with negative control plasmid. Western blot analysis (a,e) of HSPA2, HSPA1, and HSPA8 levels in wild-type (wt) and modified cells. The numbers below each lane represent the protein ratio normalized to the actin level. Representative immunoblots are shown (n = 4; molecular weight in kDa is indicated), actin was used as a protein loading control. Cell metabolic activity (b,f) was measured using the MTS assay. Cell proliferation rate (c,g) was examined using crystal violet staining assay (n = 3; each in three technical replicas). Cell metabolic activity and cell proliferation rate are expressed as mean ± SD (n = 3, each in three technical replicas) in relation to values obtained at 24 h after plating. To analyze the clonogenic ability (d,h) cells were plated onto six-well dishes (1 × 10³ cells/well for NCI-H1299 and 3 × 10³ cells/well for NCI-H358 cell line) and cultured for 7 days (NCI-H1299) or 11 days (NCI-H358). Colonies were counted manually (mean ± SD, NCI-H1299 n = 7, each in three technical replicas; NCI-H358 n = 5, each in 2–3 technical replicas). Each dot color represents results of one of five (d) or seven (h) independent experiments.
Figure 4
Figure 4
Effects of HSPA2 knockdown on the ability of BEAS-2B cells to migrate and adhere to ECM components. (a) Cell motility assayed using the wound-healing assay. The open wound area was calculated at 8 h after making a scratch in confluent cell culture (a). Wild-type (wt); control sh-luc cells transduced with the non-targeting shRNA-luc sequence; sh-4 cells stably transduced with the HSPA2-targeting shRNA4 sequence. Results are shown as mean ± SD, n ≥ 4; each at least in eight technical repeats. (b) Cell chemotaxis toward fetal bovine serum (FBS) gradient (0.1–10%) assayed using a Boyden chamber system. Cells (2 × 10⁴) were plated onto an insert and allowed to migrate for 8 h. Representative photographs show cells that migrated through the membrane pores (8 µm). The scale bar represents 50 μm. The graph shows the optical density of cells (mean ± SD, n = 3, each in two technical repeats). (c) Cell adhesion to the extracellular matrix (ECM) proteins assayed using the ECM Cell Adhesion Array Kit (Millipore). Cells (6 × 10⁴) were plated onto the ECM Cell Adhesion Array strips and allowed to attach for 1 h (n = 2, each in two technical repeats). col, collagen; FN, fibronectin; LN, laminin; TN, tenascin; VN, vitronectin. * p < 0.05 versus sh-luc cells.
Figure 5
Figure 5
HSPA2 knockdown has no effects on the motility, invasiveness, and adhesion of (ad) NCI-H1299 cells; (e,f) NCI-H358 cells; and (g,h) NCI-H23 cells. (a,e) Results of the wound-healing assay. The microphotographs of a wound area were taken immediately after making a scratch in confluent cell culture (0 h) and after subsequent culture for 16 h (NCI-H1299) or 24–48 h (NCI-H358). Arrows mark the wound width. The graphs show mean ± SD (n = 4 in (a); n = 3 in (e); each at least in ten technical replicas). (b,g) Results of chemotactic migration assay. Cells (5 × 10⁴) were plated onto an insert and allowed to migrate for 6 h toward the FBS gradient (1–10%). Representative microphotographs show crystal violet-stained cells that migrated through the membrane pores. The graphs show mean ± SD (n = 5). (c) Results of cell invasion assay. Representative microphotographs show crystal violet-stained cells that migrated into Matrigel. The scale bar represents 50 μm. The graph shows the percent of invading cells (mean ± SD, n = 4, cells were counted in six different areas). (d,f,h) Results of adhesion assay. NCI-H1299 (6 × 10⁴/well), NCI-H358 (7 × 10⁴/well), and NCI-H23 (7 × 10⁴/well) cells were plated onto the ECM Cell Adhesion Array strips and allowed to attach for 1 to the ECM components: col, collagen; FN, fibronectin; LN, laminin; TN, tenascin; VN, vitronectin. Results show mean ± SD (n = 2, each in two technical replicas).
Figure 5
Figure 5
HSPA2 knockdown has no effects on the motility, invasiveness, and adhesion of (ad) NCI-H1299 cells; (e,f) NCI-H358 cells; and (g,h) NCI-H23 cells. (a,e) Results of the wound-healing assay. The microphotographs of a wound area were taken immediately after making a scratch in confluent cell culture (0 h) and after subsequent culture for 16 h (NCI-H1299) or 24–48 h (NCI-H358). Arrows mark the wound width. The graphs show mean ± SD (n = 4 in (a); n = 3 in (e); each at least in ten technical replicas). (b,g) Results of chemotactic migration assay. Cells (5 × 10⁴) were plated onto an insert and allowed to migrate for 6 h toward the FBS gradient (1–10%). Representative microphotographs show crystal violet-stained cells that migrated through the membrane pores. The graphs show mean ± SD (n = 5). (c) Results of cell invasion assay. Representative microphotographs show crystal violet-stained cells that migrated into Matrigel. The scale bar represents 50 μm. The graph shows the percent of invading cells (mean ± SD, n = 4, cells were counted in six different areas). (d,f,h) Results of adhesion assay. NCI-H1299 (6 × 10⁴/well), NCI-H358 (7 × 10⁴/well), and NCI-H23 (7 × 10⁴/well) cells were plated onto the ECM Cell Adhesion Array strips and allowed to attach for 1 to the ECM components: col, collagen; FN, fibronectin; LN, laminin; TN, tenascin; VN, vitronectin. Results show mean ± SD (n = 2, each in two technical replicas).
Figure 6
Figure 6
Stable shRNA-mediated HSPA2 silencing in (ad) breast luminal-A type carcinoma MCF7 cells and (eh) human cervical adenocarcinoma HeLa cells. Immunoblots (a,e) show protein levels of HSPA2, HSPA1, and HSPA8 in wild type (wt); control sh-luc cells transduced with the non-targeting shRNA-luc sequence; sh-G3, sh-3, and sh-4 cells stably transduced with HSPA2-targeting shRNAG3, shRNA3, or shRNA4 sequences, respectively. The numbers below each lane represent the protein ratio normalized to the actin level. Representative immunoblots are shown (HeLa, n = 5; MCF7, n = 4), and actin was used as a protein loading control. Cell metabolic activity (b,f) was tested using the MTS assay. Results are expressed as mean ± SD (n = 5, each in three technical replicas) in relation to values obtained at 24 h after plating (b,f). The cell proliferation rate (c,g) was examined using crystal violet staining assay (n = 5; each in three technical replicas). For the clonogenic assay (d,h), cells were plated onto six-well dishes (HeLa 1 × 10³ cells/well, MCF7 3 × 10³ cells/well) and cultured for 7 days. Colonies were counted manually (mean ± SD, HeLa n = 4, each in three technical replicas, MCF7 n = 7, each in 2–3 technical replicas). Each dot color represents results of one of seven (d) or four (h) independent experiments.
Figure 7
Figure 7
The motility, invasiveness, and adhesiveness of (ad) HeLa and (eg) MCF7 cells are not dependent on HSPA2 protein level. (a) Results of wound-healing assay. Representative microphotographs show the wound area immediately after making a scratch in confluent culture and also after 24 h culture. Arrows mark the width of wounds. The graphs show results (mean ± SD) of three independent experiments, each at least in ten technical replicas. (b,e) Results of a transwell migration assay. Cells (6 × 10⁴ (b), 7 × 10⁴ (f)) were plated onto the insert and allowed to migrate for 4 h (b) or 24–48 h (f) toward the FBS gradient (1–10%). Representative microphotographs show crystal violet-stained cells that migrated through the membrane pores. Graph shows relative chemotactic migration (mean ± SD, n = 3, each in two technical repeats). (c,f) Analysis of cell invasion into Matrigel. Representative microphotographs show cells that migrated into the ECM matrix. The scale bar represents 50 μm. The graph shows the percentage of invading cells (mean ± SD, n = 4, each time cells were counted in 6–7 different areas). (d,g) Cells (7 × 10⁴/well) were plated onto ECM Cell Adhesion Array strips and allowed to attach for 1 h. After staining with crystal violet, optical density was measured. Results show mean ± SD (n = 3).

Similar articles

Cited by

References

    1. Gupta R.S., Singh B. Phylogenetic analysis of 70 kD heat shock protein sequences suggests a chimeric origin for the eukaryotic cell nucleus. Curr. Biol. 1994;4:1104–1114. doi: 10.1016/S0960-9822(00)00249-9. - DOI - PubMed
    1. Radons J. The human HSP70 family of chaperones: Where do we stand? Cell Stress Chaperones. 2016;21:379–404. doi: 10.1007/s12192-016-0676-6. - DOI - PMC - PubMed
    1. Kampinga H.H., Hageman J., Vos M.J., Kubota H., Tanguay R.M., Bruford E.A., Cheetham M.E., Chen B., Hightower L.E. Guidelines for the nomenclature of the human heat shock proteins. Cell Stress Chaperones. 2009;14:105–111. doi: 10.1007/s12192-008-0068-7. - DOI - PMC - PubMed
    1. Scieglinska D., Krawczyk Z. Expression, function, and regulation of the testis-enriched heat shock HSPA2 gene in rodents and humans. Cell Stress Chaperones. 2015;20:221–235. doi: 10.1007/s12192-014-0548-x. - DOI - PMC - PubMed
    1. Daugaard M., Rohde M., Jäättelä M. The heat shock protein 70 family: Highly homologous proteins with overlapping and distinct functions. FEBS Lett. 2007;581:3702–3710. doi: 10.1016/j.febslet.2007.05.039. - DOI - PubMed

LinkOut - more resources