. 2020 Oct;40(10):5427-5436.
doi: 10.21873/anticanres.14553.

DRAQ7 as an Alternative to MTT Assay for Measuring Viability of Glioma Cells Treated With Polyphenols

Affiliations

DRAQ7 as an Alternative to MTT Assay for Measuring Viability of Glioma Cells Treated With Polyphenols

Harcharan Kaur Rooprai et al. Anticancer Res. 2020 Oct.

Abstract

Background/aim: The tetrazolium-based MTT cytotoxicity assay is well established for screening putative anti-cancer agents. However, it has limitations including lack of reproducibility with glioma cells treated with polyphenols. The aim of this study was to evaluate whether a flow cytometric assay with the anthraquinone, DRAQ7, was a better alternative than the colorimetric MTT assay for measuring cell viability.

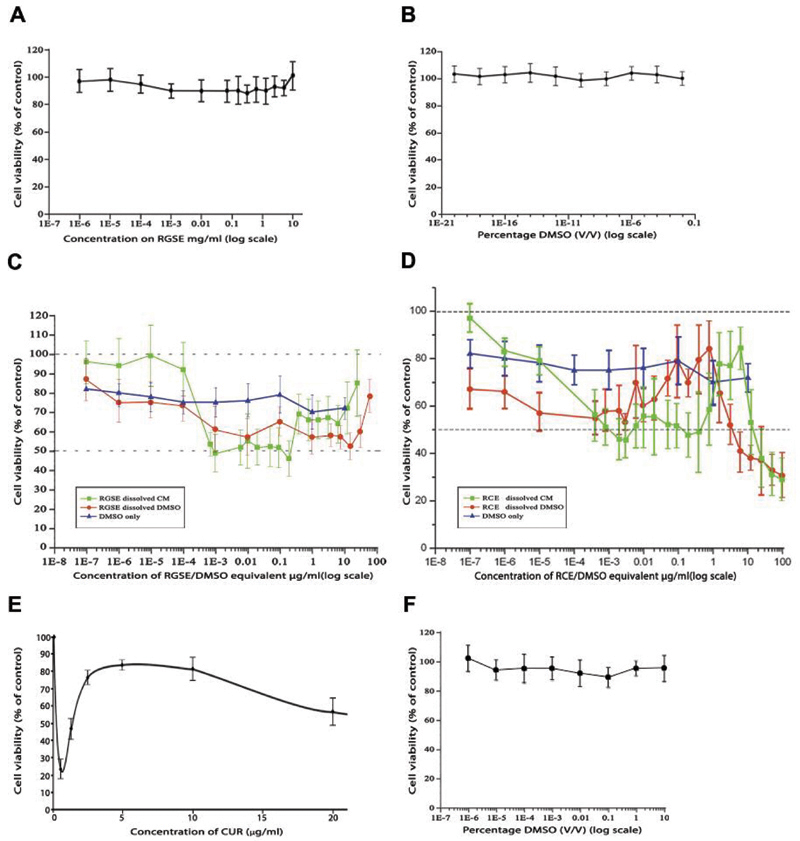
Materials and methods: Two glioma cell lines (IPSB-18, U373) and 1 pancreatic cancer cell line (AsPC-1) were treated with 4 polyphenols, namely red grape seed extract, red clover extract, anthocyanin-rich extract and curcumin. Cell viability was assessed using MTT assay and DRAQ7 staining.

Results: Limitations of MTT assay included lack of sensitivity and interference with the structure and absorbance spectra of polyphenols. Also, DMSO was toxic to glioma cells. Microscopic observations of cells treated with polyphenols confirmed the range of IC50 values evaluated by DRAQ7, but not by the MTT assay.

Conclusion: DRAQ7 is a better alternative than MTT for measuring viability of glioma cells treated with brightly coloured polyphenols.

Keywords: DRAQ7; Glioma; MTT; flow cytometry; polyphenols; viability.


Conflict of interest statement

Conflicts of Interest

None declared.

Figures

Figure 1
Figure 1
In vitro cytotoxic effects of polyphenols on different cells lines determined by MTT assay. Cells were treated for 48 h. Normal astrocytic cell cultures (MUAB-C) were treated with concentrations of red grape seed extract (RGSE) (A) and dimethyl sulfoxide (DMSO) (B) on a log scale. (C) and (D) represent data for IPSB-18 cells treated with RGSE and red clover extract (RCE), respectively. Cells were treated with DMSO only (blue line) or with a wide range of concentrations of polyphenols, solubilised in clear DMEM (green line) or dimethyl sulfoxide (DMSO) (red line). A biphasic response was seen but the data lacked reproducibility. (E) A biphasic response was also seen when U373 cells were treated with curcumin (CUR). (F) Non-toxic effect of DMSO seen on AsPC-1 (Pancreatic cancer). Cell viability was calculated as a percentage of the positive control. The error bars represent standard deviation (n=3). Comparisons between cells treated with RGSE or RCE (C and D, respectively) dissolved in complete medium (CM) and RGSE or RCE dissolved in DMSO showed p>0.05 (not statistically significant).
Figure 2
Figure 2
Comparative spectrograms of polyphenols. Selective absorption spectra over a wavelength range of 190-1100 nm for (A) red grape seed extract (RGSE) at 1 μg/ml (green), 1 μg/ml (red), 10 μg/ml (blue), (B) red clover extract (RCE) at 1μg/ml (green), 1 μg/ml (red), 10 μg/ml (blue), (C) anthocyanin-rich extract (ARE) at 100 μg/ml (green), 200 μg/ml (red), (D) curcumin (CUR) at 100 μg/ml (blue). Optical density readings were means of duplicates. The absorption spectrum reference for MTT is marked by a line at 570 nm.
Figure 3
Figure 3
Representative scatter plots for glioma cells treated with RGSE for DRAQ7 viability assay. U373 cells either untreated (A and B) or treated with 100 μg/ml red grape seed extract (RGSE) for 48 h (C and D). Panels A and C represent scatter plots of harvested cells with whole cells being selected via the region. Plots B and D show cells within each region and dead cells are defined by DRAQ7 positivity.
Figure 4
Figure 4
In vitro cytotoxic effects of different concentrations of polyphenols on different cell lines determined by DRAQ7 viability assay. The IC50 values for IPSB-18 cells (A) and U373 cells (B) treated with grape seed extract (RGSE) were 38 μg/ml and 130 μg/ml, respectively. Similarly for IPSB-18 cells (C) and U373 cells (D) treated with red clover extract (RCE), the IC50 values were 16 μg/ml and 10.5 μg/ml, respectively. For U373 cells (E) treated with curcumin (CUR) and AsPC-1 cells (F) treated with anthocyanin-rich extract (ARE), the IC50 values were 13 μg/ml and 132 μg/ml, respectively. The fluorescent marker, DRAQ7 was used as a marker of viability. This data gave reproducible IC50 values. The error bars represent standard deviation (n=3).
Figure 5
Figure 5
Microscopic observations of effect of RGSE on IPSB-18 cell line. Micrographs of monolayers of cultured cells treated with different concentrations of red grape seed (RGSE) for 48 h. Magnification of 40× by phase contrast microscopy. Representative data of concentrations used was a rough guide for viability: (A) 1 ng/ml, (B) 30 μg/ml, (C) 100 μg/ml, (D) 150 μg/ml. Scale bars=250 μm.

References

    1. Mosmann T. Rapid colorimetric assay for cellular growth and survival: Application to proliferation and cytotoxicity assays. J Immunol Methods. 1983;65(1–2):55–63. doi: 10.1016/0022-1759(83)90303-4. - DOI - PubMed
    1. Sylvester PW. Optimization of the tetrazolium dye (MTT) colorimetric assay for cellular growth and viability. Methods Mol Biol. 2011;716:157–168. doi: 10.1007/978-1-61779-012-6-9. - DOI - PubMed
    1. Mello DF, Trevisan R, Rivera N, Geitner NK, Di Giulio RT, Wiesner MR, Hsu-Kim H, Meyer JN. Caveats to the use of MTT, Neutral Red, Hoescst and Resazurin to measure silver nanoparticle cytotoxicity. Chem Biol Interact. 2020;315 doi: 10.1016/j.cbi.2019.108868. 108868. - DOI - PMC - PubMed
    1. van Tonder A, Joubert AM, Cromarty AD. Limitations of the 3-(4,5-dimethylthiazol-2-yl)-2,5-diphenyl-2H-tetrazolium bromide (MTT) assay when compared to three commonly used cell enumeration assays. BMC Res Notes. 2015;8:47. doi: 10.1186/s13104-015-1000-8. - DOI - PMC - PubMed
    1. Takahashi S, Abe T, Gotoh J, Fukuuchi Y. Substrate-dependence of reduction of MTT: a tetrazolium dye differs in cultured astroglia and neurons. Neurochem Int. 2002;40(5):441–448. doi: 10.1016/s0197-0186(01)00097-3. - DOI - PubMed

LinkOut - more resources