. 2020 Dec;184(4):1640-1657.
doi: 10.1104/pp.20.00837. Epub 2020 Sep 28.

Transcriptomic and Proteomic Insights into Amborella trichopoda Male Gametophyte Functions

Affiliations

Transcriptomic and Proteomic Insights into Amborella trichopoda Male Gametophyte Functions

María Flores-Tornero et al. Plant Physiol. 2020 Dec.

Abstract

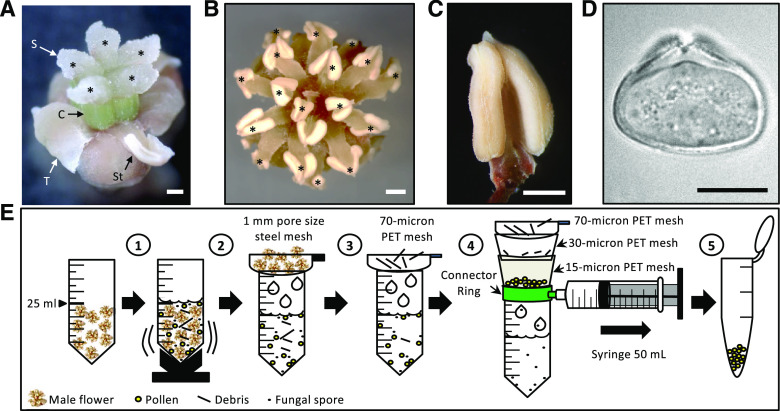
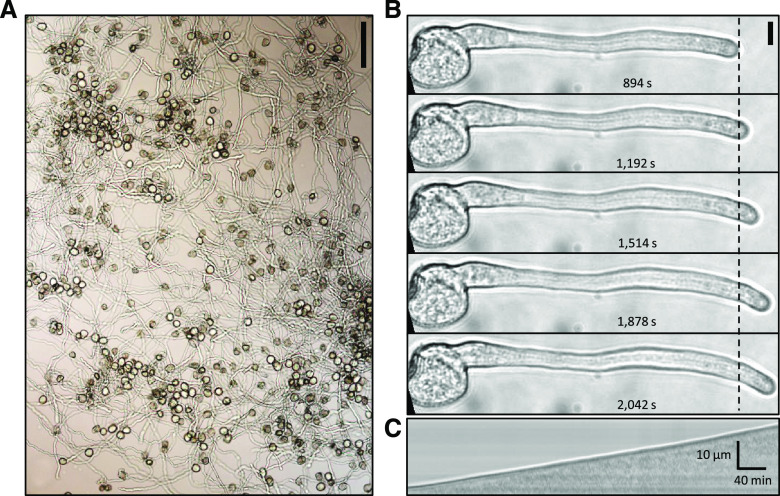
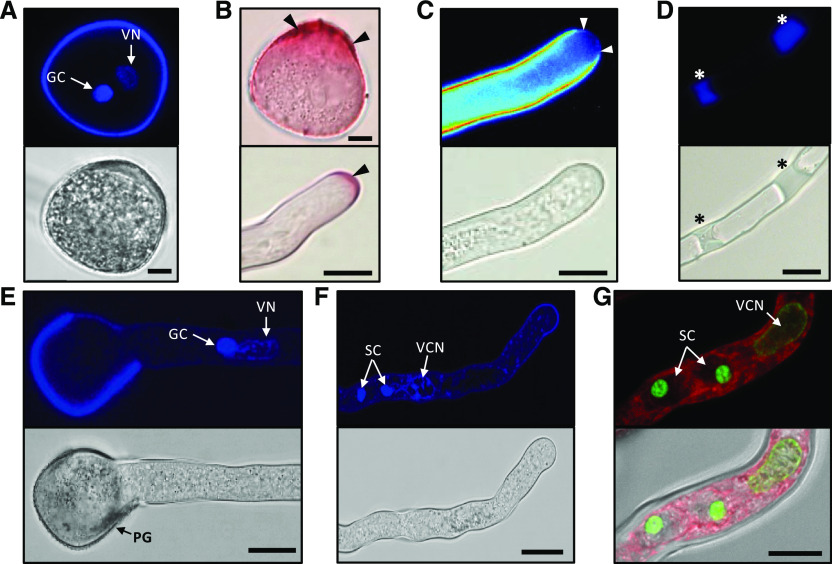
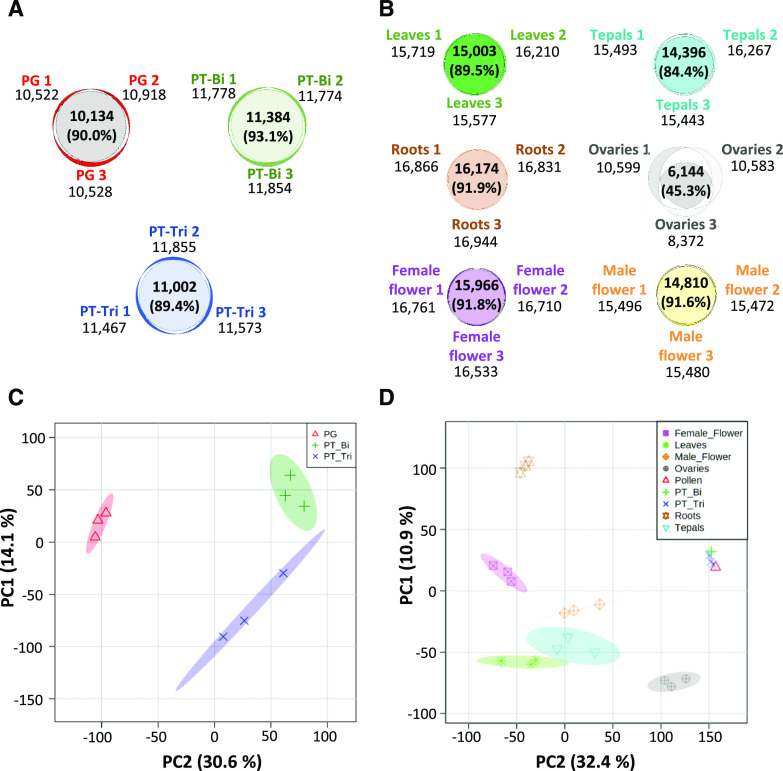
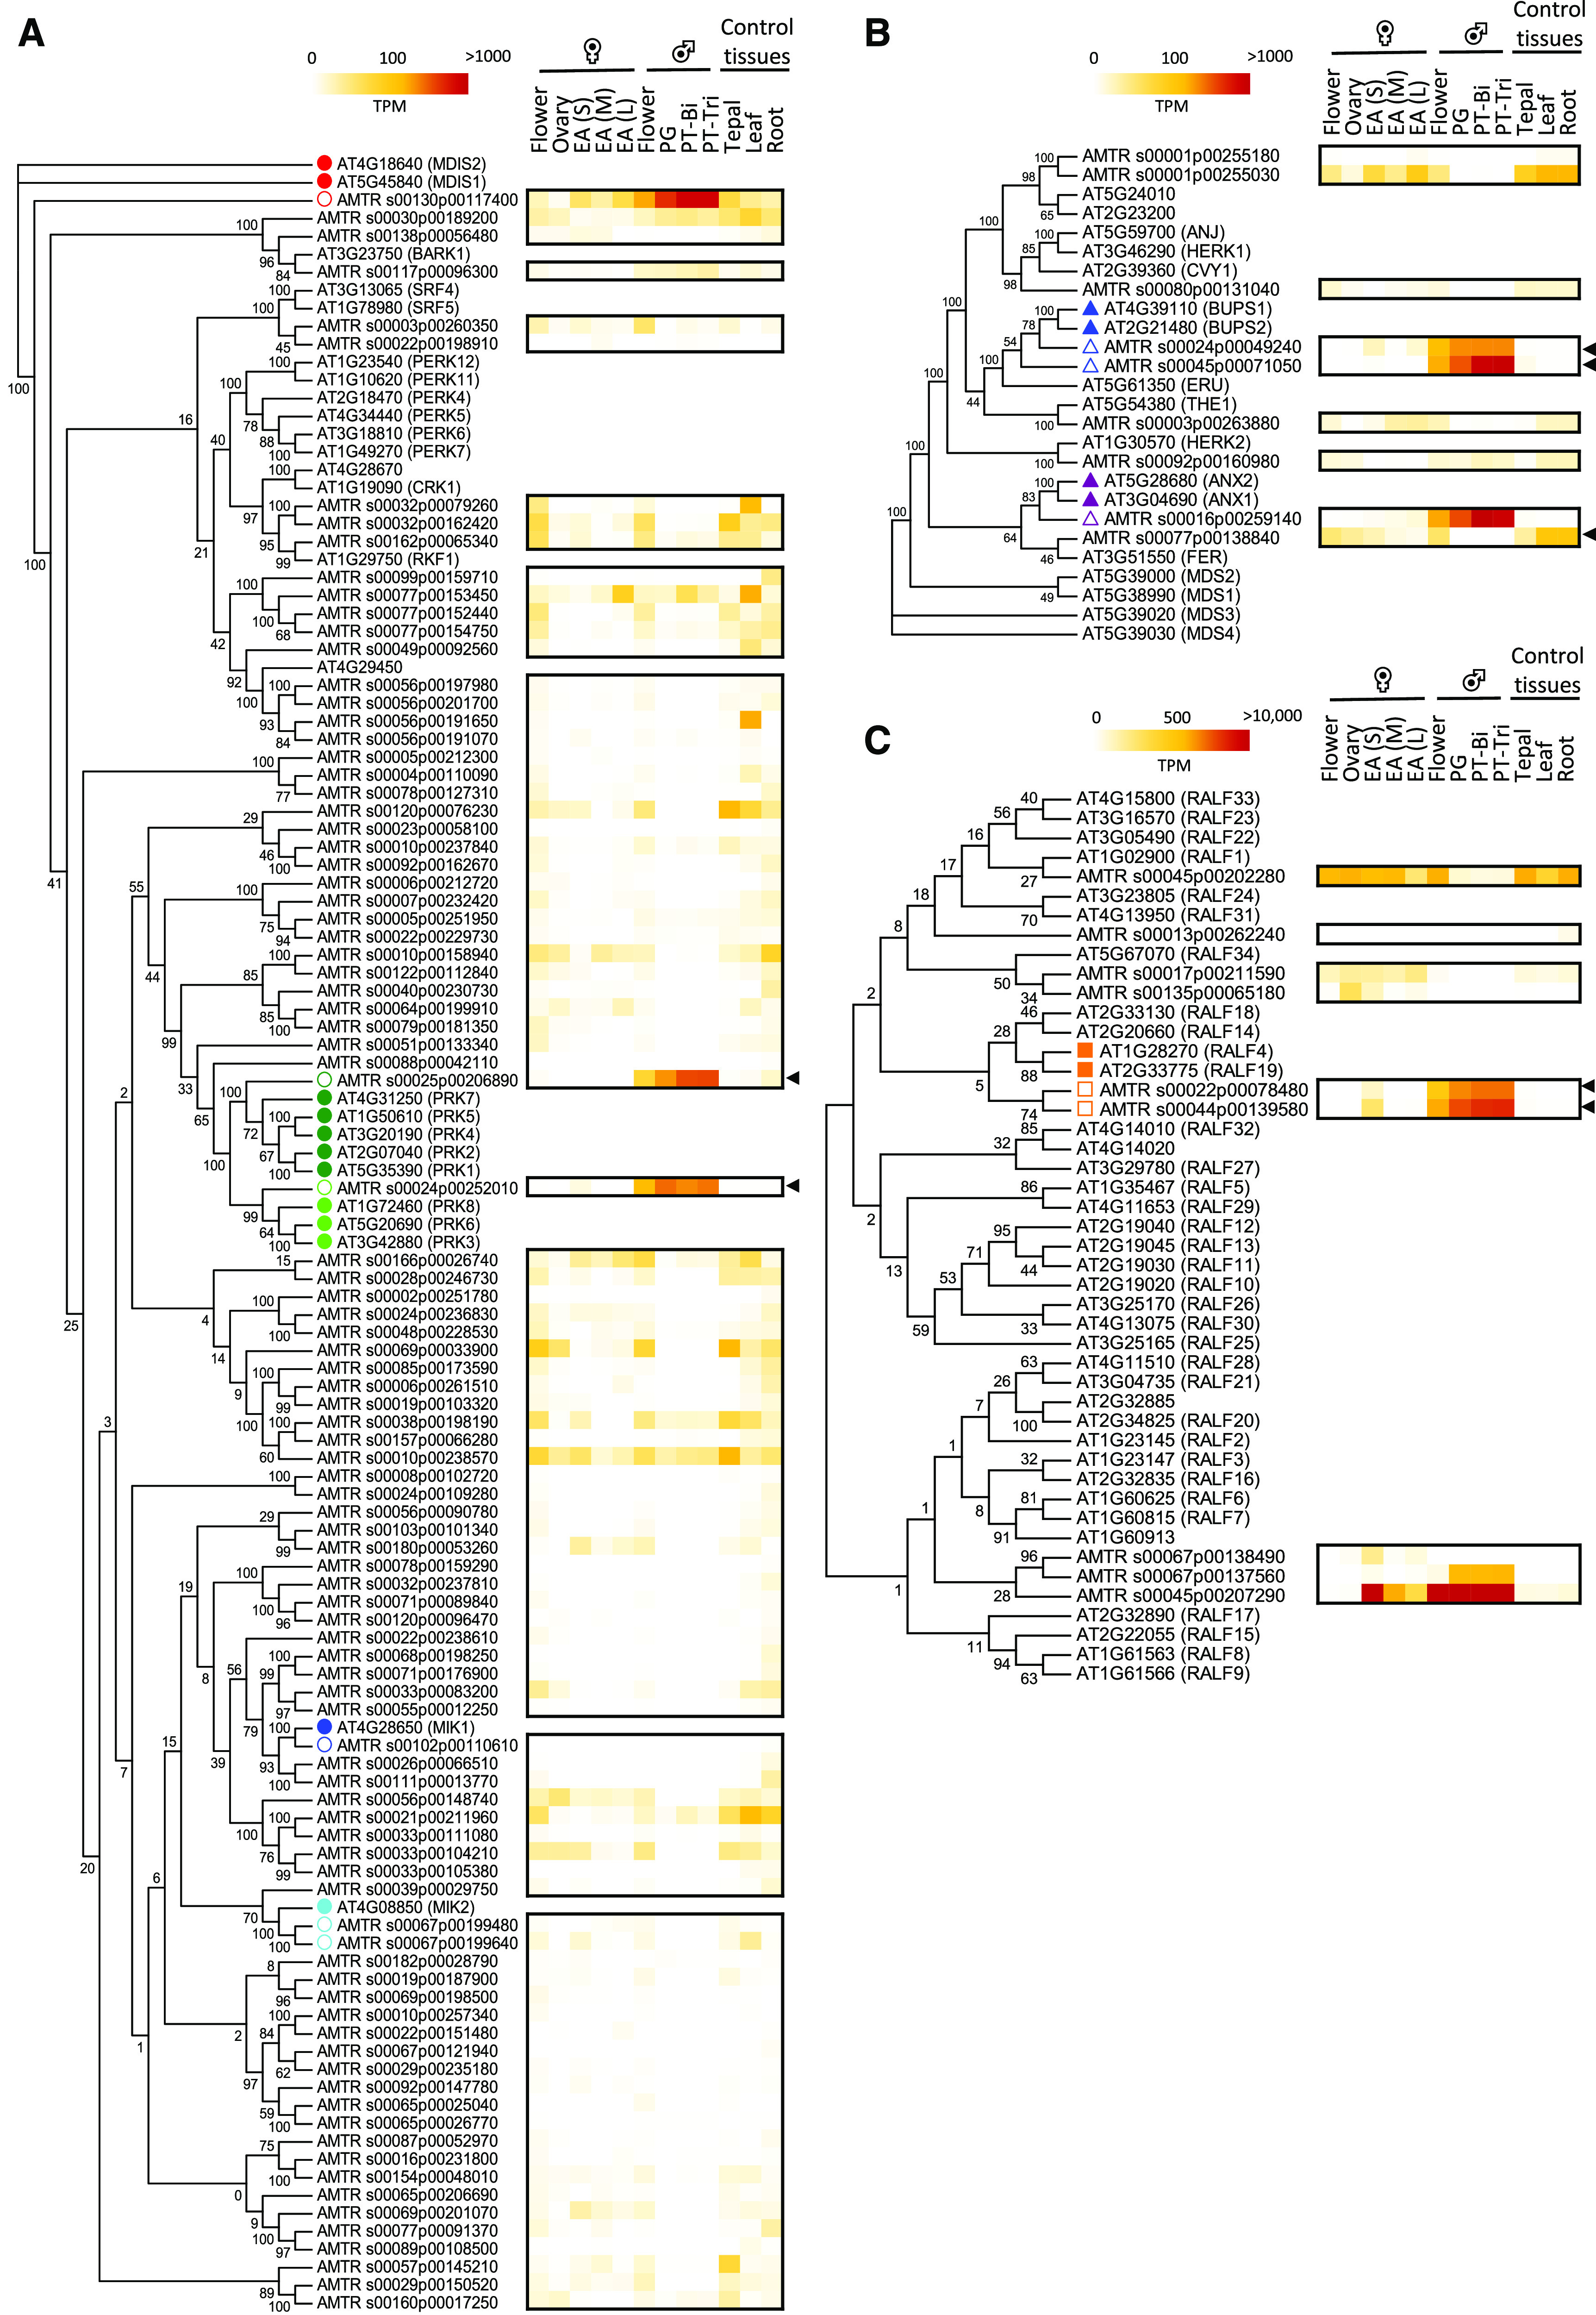
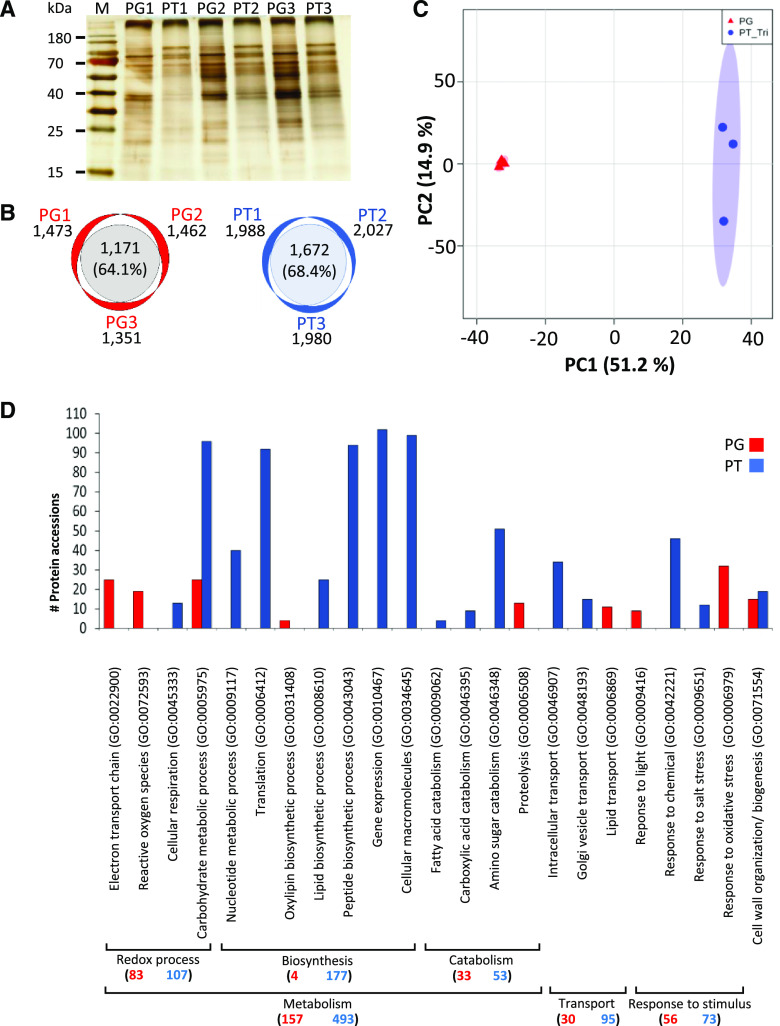
Flowering plants (angiosperms) are characterized by pollen tubes (PTs; male gametophytes) carrying two immobile sperm cells that grow over long distances through the carpel toward the ovules, where double fertilization is executed. It is not understood how these reproductive structures evolved, which genes occur de novo in male gametophytes of angiosperms, and to which extent PT functions are conserved among angiosperms. To contribute to a deeper understanding of the evolution of gametophyte functions, we generated RNA sequencing data from seven reproductive and two vegetative control tissues of the basal angiosperm Amborella trichopoda and complemented these with proteomic data of pollen grains (PGs) and PTs. The eudicot model plant Arabidopsis (Arabidopsis thaliana) served as a reference organism for data analysis, as more than 200 genes have been associated with male gametophyte functions in this species. We describe methods to collect bicellular A. trichopoda PGs, to induce their germination in vitro, and to monitor PT growth and germ cell division. Transcriptomic and proteomic analyses indicate that A. trichopoda PGs are prepared for germination requiring lipids, energy, but likely also reactive oxygen species, while PTs are especially characterized by catabolic/biosynthetic and transport processes including cell wall biosynthesis and gene regulation. Notably, a number of pollen-specific genes were lacking in Arabidopsis, and the number of genes involved in pollen signaling is significantly reduced in A. trichopoda In conclusion, we provide insight into male gametophyte functions of the most basal angiosperm and establish a valuable resource for future studies on the evolution of flowering plants.


Figures

Figure 1.
Figure 1.
Reproductive organs of A. trichopoda and PG isolation procedure. A, Mature female flower consisting of five to six carpels (C) with a wet stigma (S; here the five stigmata are labeled with an asterisk), five to eight tepals (T), and two to three staminoids (St; here one is visible). B, Mature male flower showing 10 to 25 anthers (here 17 are labeled with an asterisk). C and D, Dissected anther (C) and mature PG showing the porus (D). E, Schematic diagram describing the process of PG isolation in five steps as indicated. See text for details. Scale bars = 1 mm (A–C) and 10 μm (D).
Figure 2.
Figure 2.
A. trichopod in vitro pollen germination and PT growth. A, In vitro pollen germination on solidified CJ-PGM. Scale bar = 100 µm. B, Time series of a growing PT monitored 15 to 34 min after germination on solid medium. An average growth rate of 100.46 ± 0.5 µm h−1 was observed. Scale bar = 20 µm. C, Kymograph analysis of the PT shown in B. The growth profile appears linear lacking any signs of oscillation. Scale bars for time and distance are shown in the bottom right corner.
Figure 3.
Figure 3.
A. trichopoda PG and PT characteristics. A, 4′,6-diamino-phenylindole (DAPI) staining of a mature bicellular PG (top) and its brightfield image (bottom). B, Ruthenium red staining of a mature PG (top image) and a PT tip (bottom). Black arrowheads point at pectin-rich regions. C and D, Aniline blue staining of PTs (top) and respective brightfield images (bottom). The PT apex indicated by white arrowheads in C is devoid of callose-like substances, whereas callose plugs become visible in the shank of the PT marked by asterisks in D. E, PG 9 h after in vitro germination showing the PT with the vegetative nucleus followed by the GC. F, PT 14 h after in vitro germination showing the vegetative nucleus followed by the two sperm cells. G, SYBR GREEN I-stained PT 14 h after in vitro germination showing the male germ unit (the vegetative cell nucleus [VN] and two sperm cells [SC]) in more detail. FM 4-64 (red) served as counter stain for membranes. Note the highly compact sperm cell chromatin. The tip of the tube is to the right. Scale bars = 10 μm.
Figure 4.
Figure 4.
Venn diagrams and PCAs of transcriptomes from three male gametophyte stages and four sporophytic control tissues of A. trichopoda. A, Overlap of expressed genes (transcript per million [TPM] ≥ 1) in each of the three biological replicates generated from mature bicellular PGs and germinated PTs at the PT-Bi and PT-Tri stage, respectively. B, Overlap of expressed genes in sporophytic tissues indicated. For each, three biological replicates were generated. C, PCA plot of expressed genes within three biological replicates of PG, PT-Bi, and PT-Tri. D, PCA plot of samples shown in C compared with sporophytic tissues. For each tissue, three biological replicates are shown.
Figure 5.
Figure 5.
Cluster analysis to visualize transcriptome dynamics during transition from PGs to tricellular PTs in A. trichopoda. Top left, Venn diagram showing overlap between genes expressed in PGs, PT-Bi, and PT-Tri. Only genes with TPM values ≥ 1 in all replicates from a given tissue are considered. 9,759 genes expressed in all samples can be subdivided in seven k-mean clusters. y axis shows scaled gene expression values obtained for each gene by dividing its TPM value by the maximum value among the three samples. Total number of genes represented by each cluster are shown in brackets. Blue lines represent individual genes and average expression of genes in a given cluster is indicated with a red line. Orthologs* indicates the presence of the top five putative orthologs of Arabidopsis genes with known pollen function. A full list of genes in the k-mean clusters is shown in Supplemental Table S5.
Figure 6.
Figure 6.
Phylogenetic tree and heatmap of A. trichopoda RLK and RALF genes to identify their putative Arabidopsis orthologs. A, LRR-RLKs predominantly expressed in PTs of Arabidopsis (24 genes) and all LRR-RLKs identified in A. trichopoda (95 genes). Arabidopsis genes involved in PT growth and guidance are indicated by filled dots, while their putative orthologs are shown by empty dots. B, CrRLK1L receptor genes identified in A. trichopoda (nine genes) and Arabidopsis (17 genes). Filled triangles indicate Arabidopsis CrRLK1Ls involved in maintenance of the PT integrity, and open triangles indicate putative A. trichopoda orthologs. The heatmap shows expression values (in TPM) of A. trichopoda CrRLK1Ls. C, RALFs identified in A. trichopoda (nine genes) and Arabidopsis (37 genes). Filled squares indicate Arabidopsis RALFs involved in maintenance of the PT integrity, and empty squares indicate putative A. trichopoda orthologs. Black arrowheads point toward highest expression in male gametophyte tissues. The phylogenetic tree was generated by using full-length protein sequences and the maximum likelihood method with 100 bootstraps. Female flower, EA(S), EA(M), and EA(L) represent small, medium, and large egg apparatus cells from A. trichopoda described in Flores-Tornero et al. (2019).
Figure 7.
Figure 7.
Proteomic analysis of PGs and tricellular PT from A. trichopoda. A, Characteristic protein pattern observed for PG and PT 17 h after germination. Prior to MS, protein samples of each of the three biological replicates were quality checked by silver staining after SDS-PAGE. B, Number of proteins detected by MS in three biological replicates of PGs and PTs. C, PCA plot of proteins detected within three biological replicates of PG and PT samples. D, Functional category distribution according to biological processes of identified proteins that were significantly upregulated in PG (red) and PT (blue; P < 0.05). x axis represents significantly enriched gene ontology (GO) terms (false discovery rate < 0.05), while y axis represents the number of protein accessions in each GO term. GO categories were made by using PANTHER web service version 14.1. Numbers in brackets indicate total number of proteins found in PG or PT for a given main biological process. Corresponding detailed information is listed in Supplemental Tables S8 and S9.

Similar articles

Cited by

References

    1. Amborella Genome Project (2013) The Amborella genome and the evolution of flowering plants. Science 342: 1241089. - PubMed
    1. Backues SK, Korasick DA, Heese A, Bednarek SY(2010) The Arabidopsis dynamin-related protein2 family is essential for gametophyte development. Plant Physiol 22: 3218–3231 - PMC - PubMed
    1. Becker JD, Boavida LC, Carneiro J, Haury M, Feijo JA(2003) Transcriptional profiling of Arabidopsis tissues reveals the unique characteristics of the pollen transcriptome. Plant Physiol 133: 713–725 - PMC - PubMed
    1. Benjamini Y, Hochberg Y(1995) Controlling the false discovery rate: A practical and powerful approach to multiple testing. J R Stat Soc B 57: 289–300
    1. Berthomé R, Thomasset M, Maene M, Bourgeois N, Froger N, Budar F(2008) pur4 mutations are lethal to the male, but not the female, gametophyte and affect sporophyte development in Arabidopsis. Plant Physiol 147: 650–660 - PMC - PubMed

Publication types

LinkOut - more resources