. 2020 Oct 23;133(20):jcs247700.
doi: 10.1242/jcs.247700.

Smoothened receptor signaling regulates the developmental shift of GABA polarity in rat somatosensory cortex

Affiliations

Smoothened receptor signaling regulates the developmental shift of GABA polarity in rat somatosensory cortex

Quentin Delmotte et al. J Cell Sci. .

Abstract

Sonic hedgehog (Shh) and its patched-smoothened receptor complex control a variety of functions in the developing central nervous system, such as neural cell proliferation and differentiation. Recently, Shh signaling components have been found to be expressed at the synaptic level in the postnatal brain, suggesting a potential role in the regulation of synaptic transmission. Using in utero electroporation of constitutively active and negative-phenotype forms of the Shh signal transducer smoothened (Smo), we studied the role of Smo signaling in the development and maturation of GABAergic transmission in the somatosensory cortex. Our results show that enhancing Smo activity during development accelerates the shift from depolarizing to hyperpolarizing GABA in a manner dependent on functional expression of potassium-chloride cotransporter type 2 (KCC2, also known as SLC12A5). On the other hand, blocking Smo activity maintains the GABA response in a depolarizing state in mature cortical neurons, resulting in altered chloride homeostasis and increased seizure susceptibility. This study reveals unexpected functions of Smo signaling in the regulation of chloride homeostasis, through control of KCC2 cell-surface stability, and the timing of the GABA excitatory-to-inhibitory shift in brain maturation.

Keywords: Chloride homeostasis; GABAergic transmission; KCC2; Smoothened receptor; Sonic hedgehog.


Conflict of interest statement

Competing interestsThe authors declare no competing or financial interests.

Figures

Fig. 1.
Fig. 1.
Cortical expression pattern of Smo-related constructs. (A) Representative distribution of electroporated neurons in rat developing cortex at E20 with GFP alone (Control) or GFP with Smo-constitutively active (Smo-CA) or Smo negative-phenotype (Smo-ΔN) mutants. CP, cortical plate; IZ, intermediate zone; LV, lateral ventricle; SVZ/VZ, subventricular/ventricular zone. Dotted lines indicate boundaries between zones. Nuclei are stained with DAPI. Scale bar: 30 µm. (B) Quantification of cortical distribution of electroporated neurons between CP (blue), IZ (green) and SVZ/VZ (red). (C) Representative neocortical section showing laminar position of electroporated cells processed postnatally at P15 and co-immunostained with NeuN (blue) and FoxP2 (red). GFP fluorescence intensity profile shows that E15-generated neurons are distributed mainly in deeper layers V/VI. Dotted lines indicate the boundaries between layers. Scale bar: 250 µm. (D) Box plots of cortical thickness and (E) neuronal density in GFP- (control), Smo-CA- and Smo-ΔN-expressing brains. (F) Box plots of neuron soma size in electroporated rats at P15. Box plots show the interquartile range with the median indicated. Whiskers show the range. Number of slices and rats are indicated in parenthesis.
Fig. 2.
Fig. 2.
Smo-related constructs control presynaptic terminal density but not apoptosis. (A) Example of immunofluorescence signal of a P30 cortical section expressing Smo-ΔN and GFP (green), co-immunostained with synaptophysin (red) and MAP2 (blue). Scale bar: 30 µm. (B) Box plots of synaptophysin area fraction normalized to MAP2 area fraction. Box plots show the interquartile range with the median indicated. Whiskers show the range. (C) Immunofluorescence signal of P15 cortical sections electroporated at E15 with GFP (control) with or without Smo-related constructs and immunolabeled with cleaved caspase-3 and NeuN antibodies. Nuclei are stained with DAPI. Scale bar: 100 µm. (D) Ratio of cleaved caspase-3-positive neurons (apoptotic) per surface area and expressed as a percentage of NeuN-positive cells. Overexpression of Smo-CA or Smo-ΔN does not increase the number of apoptotic neurons compared to control (GFP). Errors bars are mean±s.d. Number of slices and rats are indicated in parenthesis. *P<0.05; ****P<0.0001 (Mann–Whitney test).
Fig. 3.
Fig. 3.
Smo-related constructs regulate the expression levels of Ptch1 and Gli1. (A) Cells overexpressing Smo-related constructs (green) and immunostained with Smo antibody (red) showed a similar localization (overlay). Arrows indicate co-localization of Smo and GFP. Scale bar: 25 µm. (B,C) Box plots of relative expression of Gli1 and Ptch1 mRNA transcripts in GFP- (control), Smo-CA- and Smo-ΔN-expressing rats. Expression is normalized to GAPDH expression in the same RNA preparation. n=6 rats for each condition. (D) Shh is expressed in post-natal somatosensory cortex. Box plots show median Shh protein concentration measured by ELISA at P15 and P30 in somatosensory cortex tissue lysate from GFP- (control), Smo-CA- and Smo-ΔN-expressing rats. n=4 rats for each condition. Box plots show the interquartile range with the median indicated. Whiskers show the range. *P<0.05; **P<0.01 (Mann–Whitney test).
Fig. 4.
Fig. 4.
The developmental shift in the polarity of GABAAR-mediated responses is modulated in cortical neurons expressing the negative-phenotype or the constitutively active forms of Smo. (A) Effects of isoguvacine treatment (iso; 10 µM) in cortical slices from control GFP-, Smo-CA- and Smo-ΔN-expressing rats. Representative traces of spontaneous extracellular field potentials (left column) recorded in the electroporated area of cortical slices at P14 in control and Smo-CA-expressing rats and at P30 in control and Smo-ΔN-expressing rats. Corresponding time course of normalized frequency of MUA is shown (right column). (B) Box plots of relative change of isoguvacine-dependent MUA frequency in electroporated rats at P14, P20 and P30. Numbers in parenthesis indicate the number of slices recorded and rats used. *P<0.05, **P<0.01 compared to control baseline; Wilcoxon test. (C) Developmental regulation of GABAergic excitation in electroporated rats at P14, P20 and P30. Proportion of excited slices is the proportion of slices showing an increase in MUA frequency of 20% or more during isoguvacine application. 3–5 rats per age and condition. ***P<0.001; Chi-squared test. (D) Box plots of relative changes in MUA frequency during isoguvacine application with and without application of VU0463271 (VU), a KCC2-selective blocker, on Smo-CA-expressing rats at P14. n=5 rats. Box plots show the interquartile range with the median indicated. Whiskers show the range. *P<0.05 (Wilcoxon test).
Fig. 5.
Fig. 5.
Smo signaling controls chloride homeostasis in cultured neurons and acute slices. (A) Representative gramicidin-perforated patch-clamp recordings of current–voltage (I–V) relationships for isoguvacine currents in rat hippocampal primary neuronal cultures (9 DIV) expressing mCherry only (control) or mCherry plus Smo-SA0-5, mCherry plus Smo-CA (with or without GANT-61 preincubation) or Smo-ΔN. Inserts depict the isoguvacine currents for the control condition. (B) Box plots of EGABA in the indicated conditions, color-coded as in A. Individual points are shown alongside the box plots. Dashed line shows the median value of EGABA for the control condition. The number of cells recorded and cultures used are indicated in parenthesis. (C) Box plots of Gli1 mRNA level in the indicated transfected primary neurons, measured by single-cell RT-qPCR (15 cells per culture per condition, n=4 cultures). (D) Typical images of Cl-Sensor fluorescence excited at 500 nm in a slice from a P30 rat electroporated with Cl-Sensor plus Smo-CA. Rats were electroporated in utero at E15 with Cl-Sensor plus mCherry (control), Cl-Sensor plus Smo-CA (Smo-CA) or Cl-Sensor plus Smo-ΔN (Smo-ΔN). For analysis, regions of interest were drawn around the soma of cells located in the focal plane. Five to ten neurons were analyzed per image. Scale bar: 100 μm. (E,F) Example of typical ratiometric fluorescence (R430/500) recordings at P10 (E) and P30 (F) from control, Smo-CA and Smo-ΔN rats. Horizontal bars indicate the times of application of ACSF containing isoguvacine (iso). Arrowheads and arrows indicate different types of responses between control, Smo-CA and Smo-ΔN neurons at P10 and P30, respectively. Data represent results obtained from four or five rats per experimental condition and one or two slices were recorded per animal. (G) Box plots showing quantification of fluorescence change of ΔR/R, where R is the mean of five R430/500 measurements before isoguvacine application and ΔR is the difference between R and the absolute maximum of isoguvacine-induced response. Number of slices and rats are indicated in parenthesis. Box plots in B, C and G show the interquartile range with the median indicated. Whiskers show the range. *P<0.05, **P<0.01, ***P<0.001 (Mann–Whitney test).
Fig. 6.
Fig. 6.
KCC2 Ser940 phosphorylation is regulated by Smo signaling. (A) Box plots of relative expression of KCC2 mRNA normalized to GAPDH mRNA level in P10 rats electroporated with GFP alone (control), GFP and Smo-CA (Smo-CA) or GFP and Smo-ΔN (Smo-ΔN). n=5 rats for each condition. (B) Immunoblots for total KCC2 and phosphorylated forms of KCC2 Ser940 (KCC2 pS940) and KCC2 Thy1007 (KCC2 pT1007) in protein extracts from P10 electroporated somatosensory cortices. Molecular weights are indicated on the left of the blot (in kDa). β-tubulin is shown as a loading control. D, dimer; M, monomer; IB, immunoblot; IP, immunoprecipitation. (C–E) Box plots of normalized total KCC2(C), KCC2 pSer940 (D) and KCC2 pThr1007 (E) protein level. n=4 rats for each condition. Box plots show the interquartile range with the median indicated by a line and the mean indicated by a plus symbol. Whiskers show the range. *P<0.05 (Mann–Whitney test).
Fig. 7.
Fig. 7.
The negative-phenotype form of Smo affects the stability of KCC2 at the plasma membrane surface. (A) Gramicidin-perforated patch-clamp recording current–voltage (I–V) relationships for isoguvacine-response currents in hippocampal primary cultures at 9 DIV transfected with KCC2-pHext alone (control, black) or co-transfected with Smo-CA (green) or Smo-ΔN (red). Inserts depict the isoguvacine currents for the control condition. (B) Box plots of EGABA in the indicated conditions, color-coded as in A. Left panel shows neurons transfected without KCC2-pHext from data shown in Fig. 4A,B. Right panel shows neurons co-transfected with KCC2-pHext. The number of cells recorded and cultures used are indicated in parenthesis. Dashed line shows the median value for the control condition. (C) Representative images illustrating total, membrane and internalized pools of KCC2 with an external tag (KCC2-pHext) in vehicle (control), and Smo-related transfected constructs in hippocampal primary culture neurons. A KCC2 mutant with stable membrane surface expression (A/A-KCC2-pHext) was used as positive control for KCC2 membrane trafficking. Neurons expressing a KCC2 mutant known to not be trafficked to the membrane (ΔNTD-KCC2-pHext) were used in parallel experiments to ensure that immunocytochemistry on living neurons did not permeabilize the membrane. Scale bar: 20 μm. (D) Box plots of total protein (Ft), (E) normalized membrane (Fm) and (F) internalized pool (Fi) fluorescence, and of (G) single membrane cluster size in cultured neurons expressing the indicated constructs. The number of cells and cultures used in D–G are indicated in parentheses in D and are identical for all box plots. Box plots show interquartile range with median indicated. The whiskers show the range. Individual data points are shown alongside the box plots. *P<0.05, **P<0.01, ***P<0.005, ****P<0.001 (Mann–Whitney test).
Fig. 8.
Fig. 8.
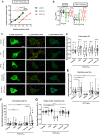
Modified susceptibility to pentylenetrazol-induced seizures in Smo mutant rats. (A) Experimental paradigm design. (B) Box plots of latency needed to induce generalized tonic–clonic seizures in three groups of electroporated rats: control (electroporated with GFP), Smo-CA-expressing and Smo-ΔN-expressing. Box plots show interquartile range with median indicated. The whiskers show the range. (C) Bar graph of PTZ cumulative dose needed to induce generalized tonic–clonic seizures. Bars are medians with experimental points shown. Numbers in parenthesis indicate the number of rats used. *P<0.05; **P<0.01 (Mann–Whitney test).

Similar articles

Cited by

References

    1. Aguado F., Carmona M. A., Pozas E., Aguiló A., Martínez-Guijarro F. J., Alcantara S., Borrell V., Yuste R., Ibañez C. F. and Soriano E. (2003). BDNF regulates spontaneous correlated activity at early developmental stages by increasing synaptogenesis and expression of the K+/Cl− co-transporter KCC2. Development 130, 1267-1280. 10.1242/dev.00351 - DOI - PubMed
    1. Al-Ayadhi L. Y. (2012). Relationship between Sonic hedgehog protein, brain-derived neurotrophic factor and oxidative stress in autism spectrum disorders. Neurochem. Res. 37, 394-400. 10.1007/s11064-011-0624-x - DOI - PMC - PubMed
    1. Álvarez-Buylla A. and Ihrie R. A. (2014). Sonic hedgehog signaling in the postnatal brain. Semin. Cell Dev. Biol. 33, 105-111. 10.1016/j.semcdb.2014.05.008 - DOI - PMC - PubMed
    1. Antonelli F., Casciati A. and Pazzaglia S. (2019). Sonic hedgehog signaling controls dentate gyrus patterning and adult neurogenesis in the hippocampus. Neural Regen Res. 14, 59-61. 10.4103/1673-5374.243703 - DOI - PMC - PubMed
    1. Araújo G. L. L., Araújo J. A. M., Schroeder T., Tort A. B. L. and Costa M. R. (2014). Sonic hedgehog signaling regulates mode of cell division of early cerebral cortex progenitors and increases astrogliogenesis. Front. Cell Neurosci. 8, 77 10.3389/fncel.2014.00077 - DOI - PMC - PubMed

Publication types