. 2020 Dec;26(12):2017-2030.
doi: 10.1261/rna.075846.120. Epub 2020 Sep 28.

Alternative conformations and motions adopted by 30S ribosomal subunits visualized by cryo-electron microscopy

Affiliations

Alternative conformations and motions adopted by 30S ribosomal subunits visualized by cryo-electron microscopy

Dushyant Jahagirdar et al. RNA. 2020 Dec.

Abstract

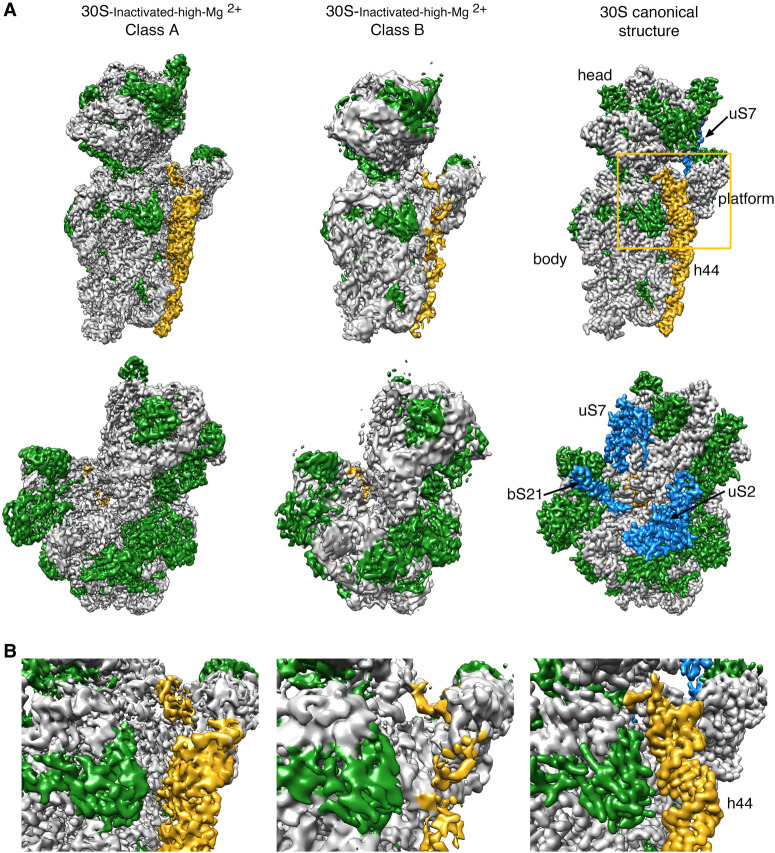
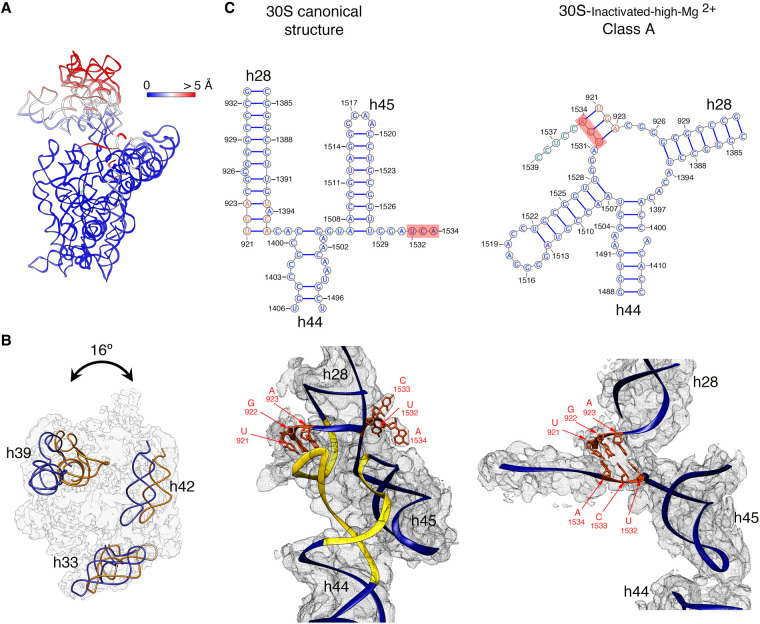
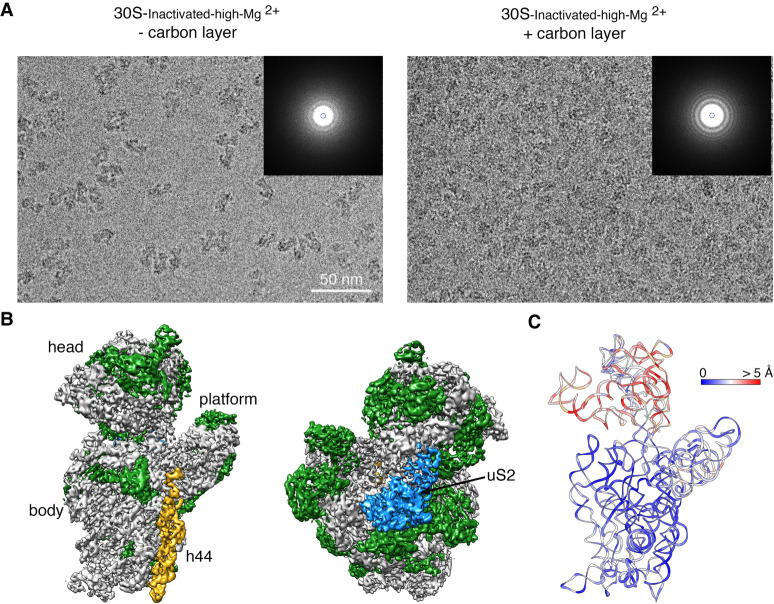
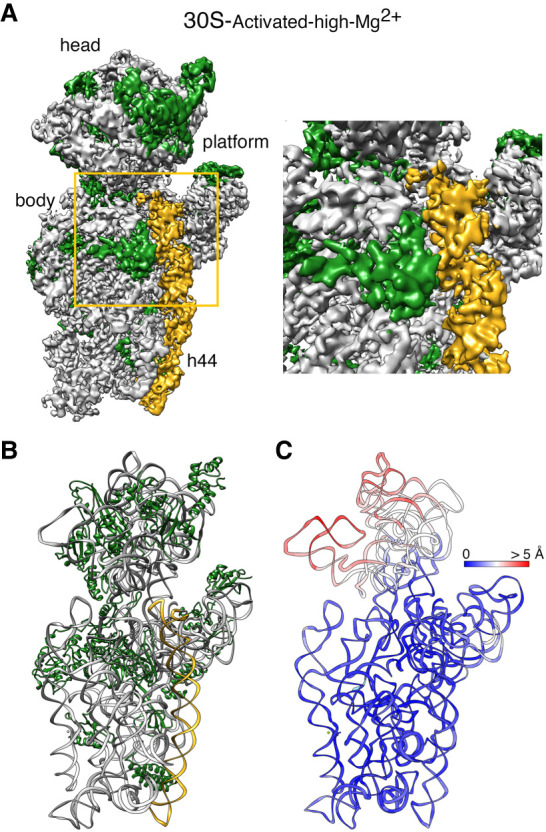
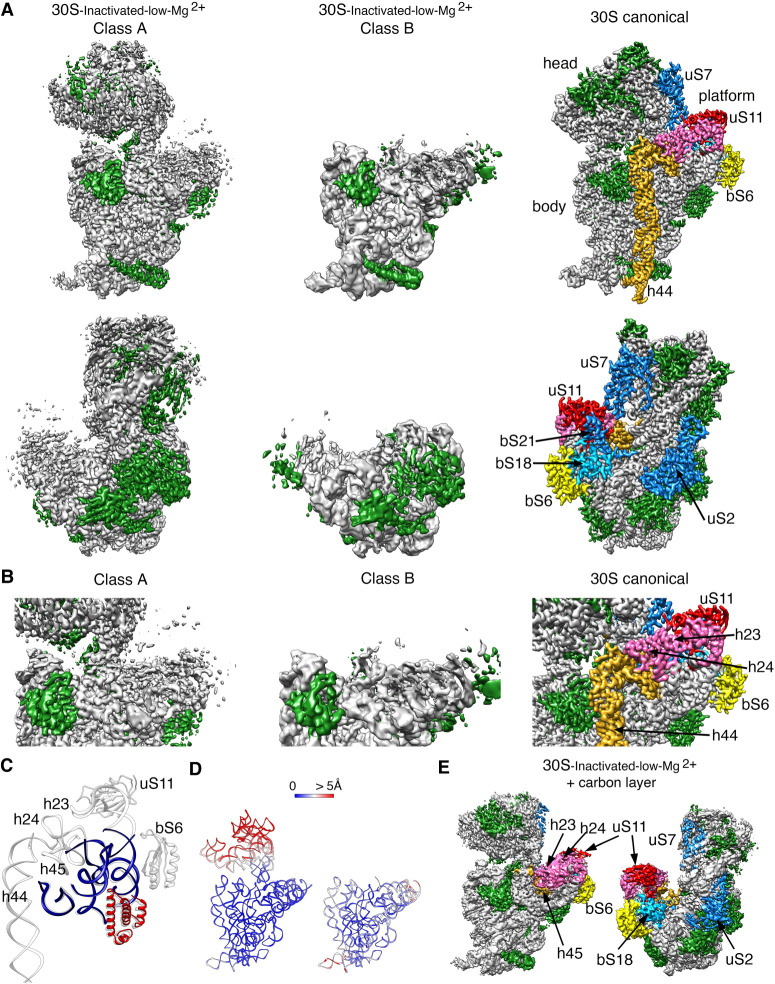
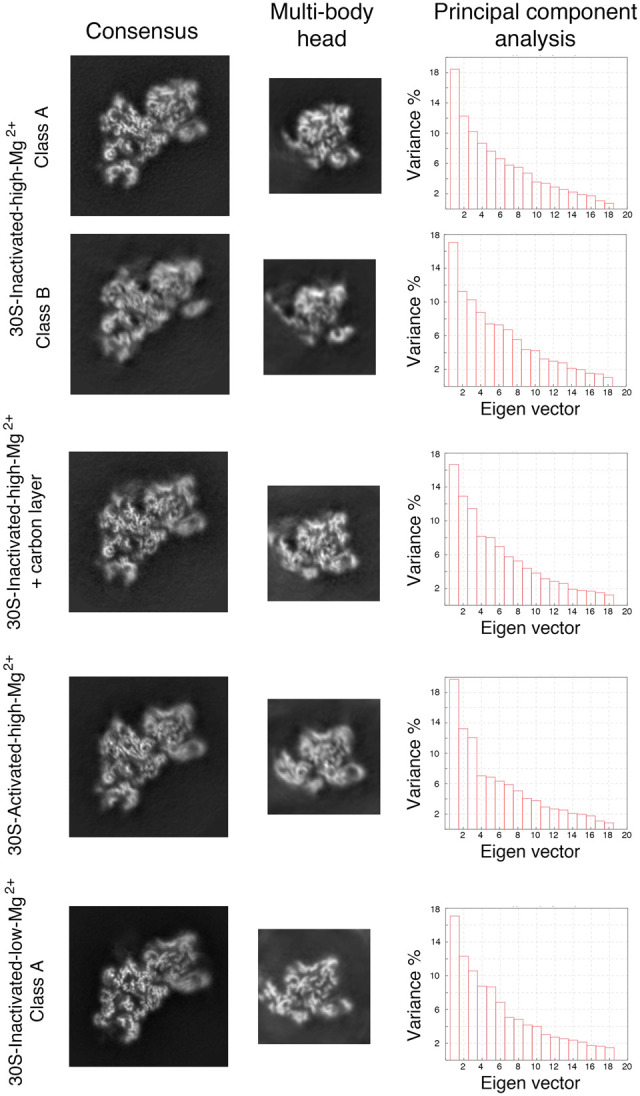
It is only after recent advances in cryo-electron microscopy that it is now possible to describe at high-resolution structures of large macromolecules that do not crystalize. Purified 30S subunits interconvert between an "active" and "inactive" conformation. The active conformation was described by crystallography in the early 2000s, but the structure of the inactive form at high resolution remains unsolved. Here we used cryo-electron microscopy to obtain the structure of the inactive conformation of the 30S subunit to 3.6 Å resolution and study its motions. In the inactive conformation, an alternative base-pairing of three nucleotides causes the region of helix 44, forming the decoding center to adopt an unlatched conformation and the 3' end of the 16S rRNA positions similarly to the mRNA during translation. Incubation of inactive 30S subunits at 42°C reverts these structural changes. The air-water interface to which ribosome subunits are exposed during sample preparation also peel off some ribosomal proteins. Extended exposures to low magnesium concentrations make the ribosomal particles more susceptible to the air-water interface causing the unfolding of large rRNA structural domains. Overall, this study provides new insights about the conformational space explored by the 30S ribosomal subunit when the ribosomal particles are free in solution.

Keywords: 30S subunit; cryo-electron microscopy; ribosome structure.


Figures

FIGURE 1.
FIGURE 1.
Cryo-EM structure of the 30S-inactivated-high-Mg2+ particle. (A) Front (top row) and back view (bottom row) of the cryo-EM maps obtained for the two subpopulations found for the 30S-inactivated-high-Mg2+ particle. The maps are shown side-by-side with the 30S subunit structure obtained by X-ray crystallography (30S canonical structure). This structure was obtained by generating a density map from PDB file 4V4Q and low-pass filtering this structure to 4 Å. The rRNA is displayed in light gray, the r-proteins in green, and helix 44 in goldenrod orange. The r-proteins uS2, uS7, and bS21 for which representative densities do not appear in the cryo-EM maps of the 30S-inactivated-high-Mg2+ particle are shown in blue in the map of the 30S subunit obtained by X-ray crystallography. These proteins and other landmarks of the 30S subunit are labeled. (B) Zoomed-in view of the decoding region of the cryo-EM maps obtained for the two subpopulations found for the 30S-inactivated-high-Mg2+ particle and the structure of the 30S subunit obtained by X-ray crystallography. The area visualized in this panel is indicated as a frame in panel A.
FIGURE 2.
FIGURE 2.
Molecular model of the 30S-inactivated-high-Mg2+ particle. (A) Temperature map of the 30S-inactivated-high-Mg2+ class A. The rRNA is colored according to the r.m.s.d. deviation (Å) with respect to the structure of the 30S subunit obtained by X-ray crystallography (PDB ID 4V4Q). (B) Top view of the head of the cryo-EM map of the 30S-inactivated-high-Mg2+ class A. The positions of helices 33, 39, and 42 in this structure (navy blue) and in the crystal structure of the 30S subunit (orange) are shown to illustrate the backward tilting of the head by 16° in the structure of the 30S-inactivated-high-Mg2+ class A. (C) Secondary (top panels) and tertiary (bottom panels) structures of helices 28, 44, and 45 of the 16S rRNA in the 30S subunit structure obtained by X-ray crystallography and in the molecular model derived from the cryo-EM map of the 30S-inactivated-high-Mg2+ class A. The nucleotides 1532–1534 at the 3′ end of the 16S rRNA involved in the conformational transition between both structures are highlighted in red. The regions of helices 44 and 28 that become unfolded during the conformational transition are colored in yellow in the canonical 3D structure of the 30S subunit. The molecular model of the cryo-EM map of the 30S-inactivated-high-Mg2+ class A is shown overlapped with the density of the obtained cryo-EM map. In the case of the structure of the 30S subunit obtained by X-ray crystallography, a density map was generated from the atomic coordinates and overlapped with the molecular model.
FIGURE 3.
FIGURE 3.
Cryo-EM structure of the 30S-inactivated-high-Mg2+ particle in grids containing a continuous layer of carbon. (A) Two representative electron micrographs containing 30S-inactivated-high-Mg2+ particles. The micrographs were obtained from EM grids without (left panel) and with (right panel) an extra layer of a continuous carbon. The inset shows the power spectra from each micrograph. The presence of a constant layer carbon makes the Thon rings in the power spectra more prominent and the background of the micrograph more prominent. (B) Front and back view of the cryo-EM map obtained for the 30S-inactivated-high-Mg2+ particle from grids containing a continuous carbon layer. The rRNA is shown in light gray, and the r-proteins are shown in green except uS2 that is colored in blue. (C) Temperature map of the 30S-inactivated-high-Mg2+ molecular model obtained from grids containing a continuous carbon layer. The rRNA is colored according to the r.m.s.d. deviation (Å) with respect to the structure 30S-inactivated-high-Mg2+ class A obtained from grids without a continuous carbon layer.
FIGURE 4.
FIGURE 4.
Cryo-EM structure of the 30S-activated-high-Mg2+ particle. (A) Front view (left panel) of the cryo-EM map obtained for the 30S-activated-high-Mg2+ particle. The framed area is shown as a zoomed-in view in the right panel. The main landmarks of the 30S subunit are labeled. The rRNA is shown in light gray, and the r-proteins are shown in green. Helix 44 is shown in goldenrod orange. (B) Molecular model of the 30S-activated-high-Mg2+ particle. The rRNA and the r-proteins are colored as in panel A. (C) Temperature map of the 30S-activated-high-Mg2+ molecular model. The rRNA is colored according to the r.m.s.d. deviation (Å) with respect to the structure of the 30S subunit obtained by X-ray crystallography (PDB ID 4V4Q).
FIGURE 5.
FIGURE 5.
Cryo-EM structure of 30S-inactivated-low-Mg2+ particle. (A) Front (top panels) and back (bottom panels) views of the two conformers, class A and B of the 30S-inactivated-low-Mg2+ particle. The rRNA is shown in light gray, and the r-proteins are shown in green. Helix 44 is shown in goldenrod orange. These structures are shown side-by-side with the 30S subunit structure obtained by X-ray crystallography (PDB file 4V4Q). In this structure, the rRNA is displayed in light gray, the r-proteins in green, and helix 44 in goldenrod orange. The r-proteins uS2, bS6, uS7, uS11, uS18, and bS21 for which a representative density does not appear in the cryo-EM maps of the 30S-inactivated-low-Mg2+ particle are indicated using a color different than green. These proteins and other landmarks of the 30S subunit are labeled. (B) Zoomed-in view of the decoding and platform region of the cryo-EM maps obtained for the 30S-inactivated-low-Mg2+ class A and B using the same color coding as in (A). (C) Overlap of helix 44 and platform region of the molecular model derived from the cryo-EM structure of the 30S-inactivated-low-Mg2+ class A and the corresponding region from the structure of the 30S subunit obtained by X-ray crystallography. Parts of the structure present in the cryo-EM structure of the 30S-inactivated-low-Mg2+ class A are displayed in navy blue and red. The atomic model of the X-ray structure with all the elements of the complete 30S subunit structure is displayed in light gray. (D) Temperature maps of the 30S-inactivated-low-Mg2+ class A and B molecular models. The rRNA is colored according to the r.m.s.d. deviation (Å) with respect to the structure of the 30S subunit obtained by X-ray crystallography (PDB ID 4V4Q). (E) Front (left panel) and back (right panel) views of the 30S-inactivated-low-Mg2+ particle imaged in grids with an extra layer of continuous carbon. The r-proteins and rRNA helices missing in the same sample imaged in grids without the extra thin layer of carbon but present in this cryo-EM map are colored as in the structure of the 30S subunit obtained by X-ray crystallography shown in panel A.
FIGURE 6.
FIGURE 6.
Multibody refinement analysis of the cryo-EM structures. The data set for each type of 30S particle was analyzed using multibody refinement to visualize their motions. The left and middle panels show, respectively, the central sections of the cryo-EM maps of the obtained 30S structures after the consensus refinement and of the head after multibody refinement. The high-resolution features of the density maps are apparent in the body region. Still, they are slightly blurred in the head domain in the central sections of the maps obtained through consensus refinement. High-resolution features of the head become more apparent in the maps of this region obtained through multibody refinement. The right panels show the principal component analysis of the different structures using the multibody refinement routine in RELION 3.0. This analysis indicated that between 38% and 43% of the variance is due to the movements of the head with respect to the body and platform.

Similar articles

Cited by

References

    1. Adams PD, Afonine PV, Bunkoczi G, Chen VB, Davis IW, Echols N, Headd JJ, Hung LW, Kapral GJ, Grosse-Kunstleve RW, et al. 2010. PHENIX: a comprehensive Python-based system for macromolecular structure solution. Acta Crystallogr D Biol Crystallogr 66: 213–221. 10.1107/S0907444909052925 - DOI - PMC - PubMed
    1. Baba T, Ara T, Hasegawa M, Takai Y, Okumura Y, Baba M, Datsenko KA, Tomita M, Wanner BL, Mori H. 2006. Construction of Escherichia coli K-12 in-frame, single-gene knockout mutants: the Keio collection. Mol Syst Biol 2: 2006.0008 10.1038/msb4100050 - DOI - PMC - PubMed
    1. Cheng Y. 2015. Single-particle cryo-EM at crystallographic resolution. Cell 161: 450–457. 10.1016/j.cell.2015.03.049 - DOI - PMC - PubMed
    1. Cheng Y, Glaeser RM, Nogales E. 2017. How cryo-EM became so hot. Cell 171: 1229–1231. 10.1016/j.cell.2017.11.016 - DOI - PMC - PubMed
    1. Daigle DM, Brown ED. 2004. Studies of the interaction of Escherichia coli YjeQ with the ribosome in vitro. J Bacteriol 186: 1381–1387. 10.1128/JB.186.5.1381-1387.2004 - DOI - PMC - PubMed

MeSH terms

LinkOut - more resources