. 2020 Nov 19;202(24):e00452-20.
doi: 10.1128/JB.00452-20. Print 2020 Nov 19.

Transcriptional Responses of Pseudomonas aeruginosa to Inhibition of Lipoprotein Transport by a Small Molecule Inhibitor

Affiliations

Transcriptional Responses of Pseudomonas aeruginosa to Inhibition of Lipoprotein Transport by a Small Molecule Inhibitor

Christian Lorenz et al. J Bacteriol. .

Abstract

Lipoprotein transport from the inner to the outer membrane, carried out by the Lol machinery, is essential for the biogenesis of the Gram-negative cell envelope and, consequently, for bacterial viability. Recently, small molecule inhibitors of the Lol system in Escherichia coli have been identified and shown to inhibit the growth of this organism by interfering with the function of the LolCDE complex. Analysis of the transcriptome of E. coli treated with one such molecule (compound 2) revealed that a number of envelope stress response pathways were induced in response to LolCDE inhibition. However, Pseudomonas aeruginosa is refractory to inhibition by the same small molecule, but we could demonstrate that E. colilolCDE could be substituted for the P. aeruginosa orthologues, where it functions in the correct transport of Pseudomonas lipoproteins, and the cells are inhibited by the more potent compound 2A. In the present study, we took advantage of the functionality of E. coli LolCDE in P. aeruginosa and determined the P. aeruginosa transcriptional response to LolCDE inhibition by compound 2A. We identified key genes that responded to LolCDE inhibition and also demonstrated that the same genes appeared to be affected by genetic depletion of the native P. aeruginosa LolCDE proteins. Several of the major changes were in an upregulated cluster of genes that encode determinants of alginate biosynthesis and transport, and the levels of alginate were found to be increased either by treatment with the small molecule inhibitor or upon depletion of native LolCDE. Finally, we tested several antibiotics with differing mechanisms of action to identify potential specific reporter genes for the further development of compounds that would inhibit the native P. aeruginosa Lol system.IMPORTANCE A key set of lipoprotein transport components, LolCDE, were inhibited by both a small molecule as well as genetic downregulation of their expression. The data show a unique signature in the Pseudomonas aeruginosa transcriptome in response to perturbation of outer membrane biogenesis. In addition, we demonstrate a transcriptional response in key genes with marked specificity compared to several antibiotic classes with different mechanisms of action. As a result of this work, we identified genes that could be of potential use as biomarkers in a cell-based screen for novel antibiotic inhibitors of lipoprotein transport in P. aeruginosa.

Keywords: LolCDE; Pseudomonas; lipoprotein transport; molecular inhibitor; transcriptome.


Figures

FIG 1
FIG 1
Growth of the P. aeruginosa PAO1 ΔmexAB-oprM ΔlolCDEPAO1 ctx::lolCDEE.coli strain. The cells were either untreated (control) (green) or treated with 3× MIC (48 μg/ml) (blue) or 6× MIC (96 μg/ml) (red) of compound 2A. Duplicate individual cultures under each condition were employed. Time zero represents the cell density at the initial time of compound 2A exposure. The time point indicated at 45 min of compound 2A exposure is where the RNA samples were taken for RNA-seq. Extended incubation times led to cell death and lysis.
FIG 2
FIG 2
Dot blots of cell lysates with antialginate antibody and anti-OprF antibody as a control. Treatment of cells with compound 2A for the indicated times is signified by +. On the left, it is clear that compound 2A caused a significant increase in alginate expression at both 1 and 2 h. Deletion of the algU gene abrogated expression. The OprF antiserum blots indicated similar levels of cell extraction in all cases.
FIG 3
FIG 3
Dependence of the regulation of selected genes by compound 2A on the presence of the E. coli lolCDE genes. Panel A illustrates the two P. aeruginosa strains with E. coli lolCDE genes in the ctx site (green bars) or P. aeruginosa lolCDE genes (blue bars) in the ctx site. Levels of gene expression were measured by RT-qPCR at 3 time intervals, 0.5, 1, and 2 h. Untreated control cells and cells treated with 16 μg/ml (1× MIC) are indicated by – and + for both strains. The values are expressed as fold changes over the values for the untreated controls, and the standard deviations from independent duplicate experiments on different days are indicated by vertical bars. Panels A through I show genes that were upregulated more than 5-fold, and panels J and K below the line, show genes identified as being downregulated. Changes tended to peak at around 1 h and subsequently declined, most likely due to decreased viability from compound 2A. In all cases, the no effects of compound 2A were observed with native P. aeruginosa lolCDE-containing cells.
FIG 3
FIG 3
Dependence of the regulation of selected genes by compound 2A on the presence of the E. coli lolCDE genes. Panel A illustrates the two P. aeruginosa strains with E. coli lolCDE genes in the ctx site (green bars) or P. aeruginosa lolCDE genes (blue bars) in the ctx site. Levels of gene expression were measured by RT-qPCR at 3 time intervals, 0.5, 1, and 2 h. Untreated control cells and cells treated with 16 μg/ml (1× MIC) are indicated by – and + for both strains. The values are expressed as fold changes over the values for the untreated controls, and the standard deviations from independent duplicate experiments on different days are indicated by vertical bars. Panels A through I show genes that were upregulated more than 5-fold, and panels J and K below the line, show genes identified as being downregulated. Changes tended to peak at around 1 h and subsequently declined, most likely due to decreased viability from compound 2A. In all cases, the no effects of compound 2A were observed with native P. aeruginosa lolCDE-containing cells.
FIG 4
FIG 4
Expression level changes due to depletion of LolCDE in P. aeruginosa. The Pseudomonas LolCDE genes under the control of the arabinose promoter system were placed in the ctx phage attachment site. Subsequently, the native LolCDE was deleted from the P. aeruginosa chromosome, thus making the cells arabinose dependent for viability. After growing the cells in the presence of sufficient arabinose (0.2%), downregulation (0.05%) or depletion (no arabinose) was used, and the levels of several genes over time were measured by RT-qPCR. The numbers are averages from two independent experiments, with standard deviations indicated by vertical bars. The levels of lolC and lolD transcripts were determined over time, as were those for algD and PA1471. The 6-h depletion levels are lower, reflecting the increased loss of viability at that time point. Additional 4-h values are shown in Fig. S2 in the supplemental material.
FIG 5
FIG 5
Production of alginate by depletion of native P. aeruginosa LolCDE detected by antibody dot blotting. The P. aeruginosa strain in which the chromosomal location of lolCDE was deleted and the P. aeruginosa lolCDE genes were placed in the ctx site under the control of the arabinose promoter was employed. Cells were grown in the presence of 0.2% arabinose (+) to an OD600 of 0.5. After washing twice with LB broth with no arabinose, the cells were resuspended in medium either with 0.2% (+) or without (−) arabinose. (Right) In the cells that were depleted of LolCDE, antialginate antibody detected much-increased production. (Left) Deletion of the algU gene led to no detectable alginate, establishing the specificity of the alginate assay. OprF detected with OprF antibody served as a control for cell extraction for the dot blots.
FIG 6
FIG 6
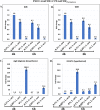
Expression levels of several key genes with inhibitor antibiotics with differing mechanisms of action. Genes that exhibited significantly upregulated changes in the presence of compound 2A were measured by RT-qPCR in the presence of known antibiotics with differing mechanisms of action. Values are the averages from duplicate independent experiments, with standard deviations indicated. The housekeeping gene proC was used as a control. Values are relative to those for untreated cells in the first column of each graph. Antibiotics were present at 3× MIC for 45 min in LB broth before RNA extraction. Antibiotic MICs were measured in LB broth, as experiments were all performed in LB broth. MIC results for the compounds are available in Table S4 in the supplemental material.
FIG 6
FIG 6
Expression levels of several key genes with inhibitor antibiotics with differing mechanisms of action. Genes that exhibited significantly upregulated changes in the presence of compound 2A were measured by RT-qPCR in the presence of known antibiotics with differing mechanisms of action. Values are the averages from duplicate independent experiments, with standard deviations indicated. The housekeeping gene proC was used as a control. Values are relative to those for untreated cells in the first column of each graph. Antibiotics were present at 3× MIC for 45 min in LB broth before RNA extraction. Antibiotic MICs were measured in LB broth, as experiments were all performed in LB broth. MIC results for the compounds are available in Table S4 in the supplemental material.
FIG 7
FIG 7
Expression levels of several key genes with inhibitor antibiotics with differing mechanisms of action. Genes that exhibited significant downregulation in the presence of compound 2A were measured by RT-qPCR in the presence of known antibiotics with differing mechanisms of action. Values are the averages from duplicate independent experiments with the indicated standard deviations. Values are relative to those for untreated cells in the first column of each graph. Antibiotics were present at 3× MIC for 45 min in LB broth before RNA extraction.

Similar articles

Cited by

References

    1. Konovalova A, Kahne DE, Silhavy TJ. 2017. Outer membrane biogenesis. Annu Rev Microbiol 71:539–556. doi:10.1146/annurev-micro-090816-093754. - DOI - PMC - PubMed
    1. Narita S-I, Tokuda H. 2017. Bacterial lipoproteins; biogenesis, sorting and quality control. Biochim Biophys Acta 1862:1414–1423. doi:10.1016/j.bbalip.2016.11.009. - DOI - PubMed
    1. Szewczyk J, Collet J-F. 2016. The journey of lipoproteins through the cell: one birthplace, multiple destinations. Adv Microb Physiol 69:1–50. doi:10.1016/bs.ampbs.2016.07.003. - DOI - PubMed
    1. Zückert WR. 2014. Secretion of bacterial lipoproteins: through the cytoplasmic membrane, the periplasm and beyond. Biochim Biophys Acta 1843:1509–1516. doi:10.1016/j.bbamcr.2014.04.022. - DOI - PMC - PubMed
    1. Buddelmeijer N. 2015. The molecular mechanism of bacterial lipoprotein modification—how, when and why? FEMS Microbiol Rev 39:246–261. doi:10.1093/femsre/fuu006. - DOI - PubMed

Publication types

MeSH terms