. 2020 Dec 15;95(24):e3190-e3202.
doi: 10.1212/WNL.0000000000010948. Epub 2020 Sep 28.

Longitudinal anatomic, functional, and molecular characterization of Pick disease phenotypes

Affiliations

Longitudinal anatomic, functional, and molecular characterization of Pick disease phenotypes

Jennifer L Whitwell et al. Neurology. .

Abstract

Objective: To characterize longitudinal MRI and PET abnormalities in autopsy-confirmed Pick disease (PiD) and determine how patterns of neurodegeneration differ with respect to clinical syndrome.

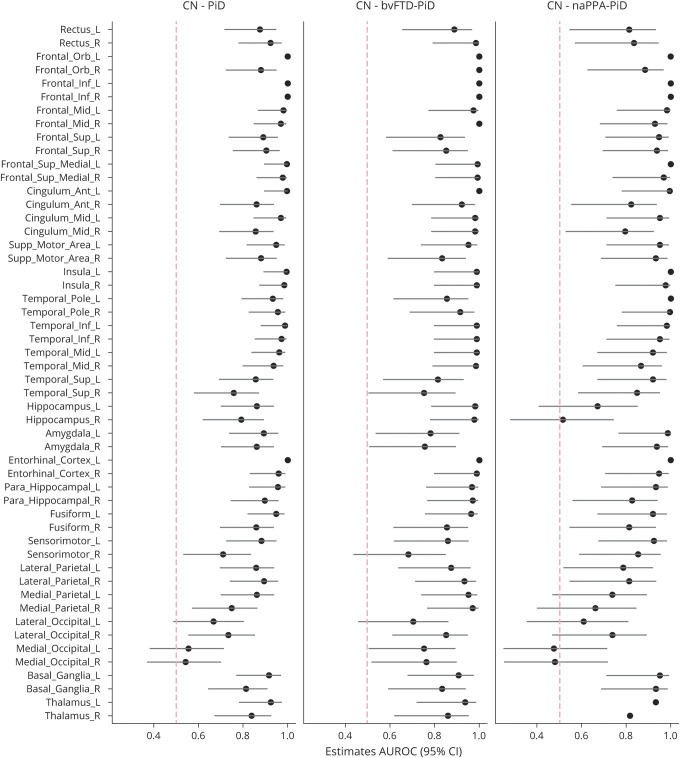
Methods: Seventeen patients with PiD were identified who had antemortem MRI (8 with behavioral variant frontotemporal dementia [bvFTD-PiD], 6 with nonfluent/agrammatic primary progressive aphasia [naPPA-PiD], 1 with semantic primary progressive aphasia, 1 with unclassified primary progressive aphasia, and 1 with corticobasal syndrome). Thirteen patients had serial MRI for a total of 56 MRIs, 7 had [18F]fluorodeoxyglucose PET, 4 had Pittsburgh compound B (PiB) PET, and 1 patient had [18F]flortaucipir PET. Cross-sectional and longitudinal comparisons of gray matter volume and metabolism were performed between bvFTD-PiD, naPPA-PiD, and controls. Cortical PiB summaries were calculated to determine β-amyloid positivity.

Results: The bvFTD-PiD and naPPA-PiD groups showed different foci of volume loss and hypometabolism early in the disease, with bvFTD-PiD involving bilateral prefrontal and anterior temporal cortices and naPPA-PiD involving left inferior frontal gyrus, insula, and orbitofrontal cortex. However, patterns merged over time, with progressive spread into prefrontal and anterior temporal lobe in naPPA-PiD, and eventual involvement of posterior temporal lobe, motor cortex, and parietal lobe in both groups. Rates of frontotemporal atrophy were faster in bvFTD-PiD than naPPA-PiD. One patient was β-amyloid-positive on PET with low Alzheimer neuropathologic changes at autopsy. Flortaucipir PET showed elevated uptake in frontotemporal white matter.

Conclusion: Patterns of atrophy and hypometabolism differ in PiD according to presenting syndrome, although patterns of neurodegeneration appear to converge over time.


Figures

Figure 1
Figure 1. Baseline, follow-up, and longitudinal change maps
Baseline, follow-up, and longitudinal change maps for gray matter volume (A) and FDG-PET hypometabolism (B) in Pick disease (PiD) compared to controls. Gray matter results are shown corrected for multiple comparisons using family-wise error correction at p < 0.05. The top row of the FDG-PET results are shown corrected for multiple comparisons using false discovery rate correction at p < 0.05. The bottom FDG-PET row shows the results after partial volume correction (PVC), uncorrected at p < 0.001. The cross-sectional results are shown on a blue T score scale and the tensor-based morphometry (TBM) with symmetric normalization change maps are shown on a yellow–red scale. Renders were generated using the BrainNet Viewer (nitrc.org/projects/bnv/).
Figure 2
Figure 2. Regional effect size plots for rates of gray matter atrophy in Pick disease (PiD), behavioral variant of frontotemporal dementia (bvFTD)–PiD, and nonfluent/agrammatic variant of primary progressive aphasia (naPPA)–PiD compared to controls (CN)
Effect size and confidence intervals (CIs) are shown for each region. AUROC = area under the receiver operating characteristic curve.
Figure 3
Figure 3. Baseline, follow-up, and longitudinal change maps for gray matter volume in the behavioral variant of frontotemporal dementia (bvFTD)–Pick disease (PiD) and nonfluent/agrammatic variant of primary progressive aphasia (naPPA)–PiD groups
(A) Results for each group compared to controls, with results shown after family-wise error correction for multiple comparison at p < 0.05. (B) Results of direct comparisons between the 2 PiD groups, with results shown after false discovery rate correction for multiple comparisons at p < 0.05. The cross-sectional results are shown on a blue T score scale and the tensor-based morphometry (TBM) with symmetric normalization change maps are shown on a yellow–red scale. Renders were generated using the BrainNet Viewer (nitrc.org/projects/bnv/).
Figure 4
Figure 4. Individual-level MRI gray matter Z score maps for a patient with behavioral variant of frontotemporal dementia (bvFTD)–Pick disease (PiD) and a patient with nonfluent/agrammatic variant of primary progressive aphasia (naPPA)–PiD who each had 5 serial MRIs spanning 4 years
Each row represents a different MRI date, with the time from onset to MRI shown on each row for each patient. Volume loss is represented as negative Z scores. Only regions with a Z score less than −1.5 are shown.
Figure 5
Figure 5. Individual baseline FDG-PET CortexID Z score maps
Clinical diagnosis, age, and time from onset to FDG-PET are shown for each patient. For patients with serial FDG, time from onset to each FDG-PET is shown. bvFTD = behavioral variant of frontotemporal dementia; naPPA = nonfluent/agrammatic variant of primary progressive aphasia.
Figure 6
Figure 6. Molecular PET findings
Top row shows the Pittsburgh compound B (PiB) PET standard uptake value ratio (SUVR) images for 5 patients with Pick disease (PiD), with the global PiB SUVR shown for each. Asterisks highlight the 2 cases that had evidence of Aβ plaques at autopsy. Bottom panel shows the flortaucipir PET SUVR image (left) and longitudinal MRI (middle) and FDG-PET (right) Z score maps for 1 patient with nonfluent/agrammatic variant of primary progressive aphasia–PiD. For the Z score maps, each row represents a different scan date, with the time from onset to scan shown on each row. The MRI and FDG-PET images were performed within 1 day of each other at every visit. Volume loss and hypometabolism are represented as negative Z scores. Only regions with a Z score less than −1.5 are shown on the MRI maps. The flortaucipir PET was performed at the time of the last MRI/FDG-PET visit.

References

    1. Dickson DW. Neuropathology of Pick's disease. Neurology 2001;56:S16–S20. - PubMed
    1. Josephs KA, Duffy JR, Strand EA, et al. . Clinicopathological and imaging correlates of progressive aphasia and apraxia of speech. Brain 2006;129:1385–1398. - PMC - PubMed
    1. Kertesz A, McMonagle P, Blair M, Davidson W, Munoz DG. The evolution and pathology of frontotemporal dementia. Brain 2005;128:1996–2005. - PubMed
    1. Piguet O, Halliday GM, Reid WG, et al. . Clinical phenotypes in autopsy-confirmed Pick disease. Neurology 2011;76:253–259. - PubMed
    1. Rohrer JD, Lashley T, Schott JM, et al. . Clinical and neuroanatomical signatures of tissue pathology in frontotemporal lobar degeneration. Brain 2011;134:2565–2581. - PMC - PubMed

Publication types

MeSH terms

Substances