

CtIP-mediated DNA resection is dispensable for IgH class switch recombination by alternative end-joining
- PMID: 32989150
- PMCID: PMC7568320
- DOI: 10.1073/pnas.2010972117
CtIP-mediated DNA resection is dispensable for IgH class switch recombination by alternative end-joining
Abstract
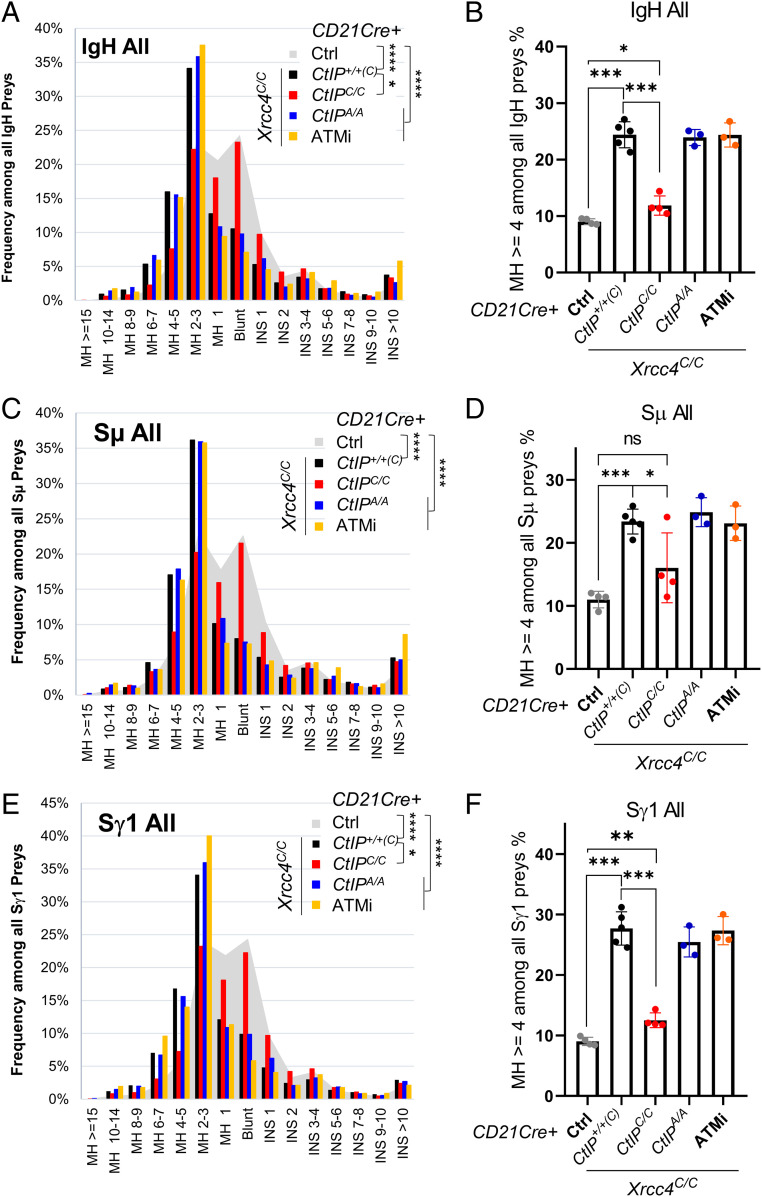
To generate antibodies with different effector functions, B cells undergo Immunoglobulin Heavy Chain (IgH) class switch recombination (CSR). The ligation step of CSR is usually mediated by the classical nonhomologous end-joining (cNHEJ) pathway. In cNHEJ-deficient cells, a remarkable ∼25% of CSR can be achieved by the alternative end-joining (Alt-EJ) pathway that preferentially uses microhomology (MH) at the junctions. While A-EJ-mediated repair of endonuclease-generated breaks requires DNA end resection, we show that CtIP-mediated DNA end resection is dispensable for A-EJ-mediated CSR using cNHEJ-deficient B cells. High-throughput sequencing analyses revealed that loss of ATM/ATR phosphorylation of CtIP at T855 or ATM kinase inhibition suppresses resection without altering the MH pattern of the A-EJ-mediated switch junctions. Moreover, we found that ATM kinase promotes Alt-EJ-mediated CSR by suppressing interchromosomal translocations independent of end resection. Finally, temporal analyses reveal that MHs are enriched in early internal deletions even in cNHEJ-proficient B cells. Thus, we propose that repetitive IgH switch regions represent favored substrates for MH-mediated end-joining contributing to the robustness and resection independence of A-EJ-mediated CSR.
Keywords: CtIP; alternative end-joining; class switch recombination.
Conflict of interest statement
The authors declare no competing interest.
Figures


Similar articles
-
DNA damage-induced phosphorylation of CtIP at a conserved ATM/ATR site T855 promotes lymphomagenesis in mice.Proc Natl Acad Sci U S A. 2021 Sep 21;118(38):e2105440118. doi: 10.1073/pnas.2105440118. Proc Natl Acad Sci U S A. 2021. PMID: 34521752 Free PMC article.
-
DNA-PKcs phosphorylation at the T2609 cluster alters the repair pathway choice during immunoglobulin class switch recombination.Proc Natl Acad Sci U S A. 2020 Sep 15;117(37):22953-22961. doi: 10.1073/pnas.2007455117. Epub 2020 Aug 31. Proc Natl Acad Sci U S A. 2020. PMID: 32868446 Free PMC article.
-
CST Is Epistatic With Shieldin to Limit DNA Double-Strand Break End Resection and Promote Repair During Igh Class Switch Recombination.Eur J Immunol. 2025 Apr;55(4):e202451585. doi: 10.1002/eji.202451585. Eur J Immunol. 2025. PMID: 40178294 Free PMC article.
-
The recent advances in non-homologous end-joining through the lens of lymphocyte development.DNA Repair (Amst). 2020 Oct;94:102874. doi: 10.1016/j.dnarep.2020.102874. Epub 2020 Jun 25. DNA Repair (Amst). 2020. PMID: 32623318 Free PMC article. Review.
-
Non-homologous end joining in class switch recombination: the beginning of the end.Philos Trans R Soc Lond B Biol Sci. 2009 Mar 12;364(1517):653-65. doi: 10.1098/rstb.2008.0196. Philos Trans R Soc Lond B Biol Sci. 2009. PMID: 19008195 Free PMC article. Review.
Cited by
-
DNA End Joining: G0-ing to the Core.Biomolecules. 2021 Oct 9;11(10):1487. doi: 10.3390/biom11101487. Biomolecules. 2021. PMID: 34680120 Free PMC article. Review.
-
Alternative end-joining in BCR gene rearrangements and translocations.Acta Biochim Biophys Sin (Shanghai). 2022 May 25;54(6):782-795. doi: 10.3724/abbs.2022051. Acta Biochim Biophys Sin (Shanghai). 2022. PMID: 35593472 Free PMC article. Review.
-
ATR kinase supports normal proliferation in the early S phase by preventing replication resource exhaustion.Nat Commun. 2023 Jun 19;14(1):3618. doi: 10.1038/s41467-023-39332-5. Nat Commun. 2023. PMID: 37336885 Free PMC article.
-
ATM/ATR Phosphorylation of CtIP on Its Conserved Sae2-like Domain Is Required for Genotoxin-Induced DNA Resection but Dispensable for Animal Development.Cells. 2023 Dec 4;12(23):2762. doi: 10.3390/cells12232762. Cells. 2023. PMID: 38067190 Free PMC article.
-
DNA damage-induced phosphorylation of CtIP at a conserved ATM/ATR site T855 promotes lymphomagenesis in mice.Proc Natl Acad Sci U S A. 2021 Sep 21;118(38):e2105440118. doi: 10.1073/pnas.2105440118. Proc Natl Acad Sci U S A. 2021. PMID: 34521752 Free PMC article.
References
-
- Chaudhuri J. et al. ., Evolution of the immunoglobulin heavy chain class switch recombination mechanism. Adv. Immunol. 94, 157–214 (2007). - PubMed
-
- Yan C. T. et al. ., IgH class switching and translocations use a robust non-classical end-joining pathway. Nature 449, 478–482 (2007). - PubMed
-
- Franco S., Alt F. W., Manis J. P., Pathways that suppress programmed DNA breaks from progressing to chromosomal breaks and translocations. DNA Repair (Amst.) 5, 1030–1041 (2006). - PubMed
Publication types
MeSH terms
Substances
Grants and funding
LinkOut - more resources
Full Text Sources
Molecular Biology Databases
Research Materials
Miscellaneous
