. 2020 Oct 13;117(41):25800-25809.
doi: 10.1073/pnas.2008762117. Epub 2020 Sep 28.

Single-nucleus transcriptome analysis reveals dysregulation of angiogenic endothelial cells and neuroprotective glia in Alzheimer's disease

Affiliations

Single-nucleus transcriptome analysis reveals dysregulation of angiogenic endothelial cells and neuroprotective glia in Alzheimer's disease

Shun-Fat Lau et al. Proc Natl Acad Sci U S A. .

Abstract

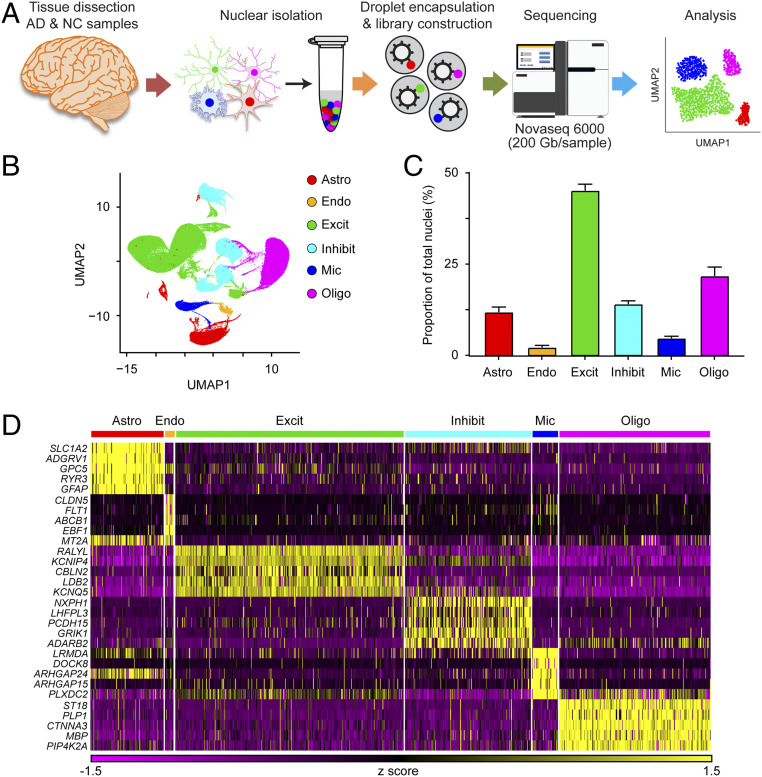
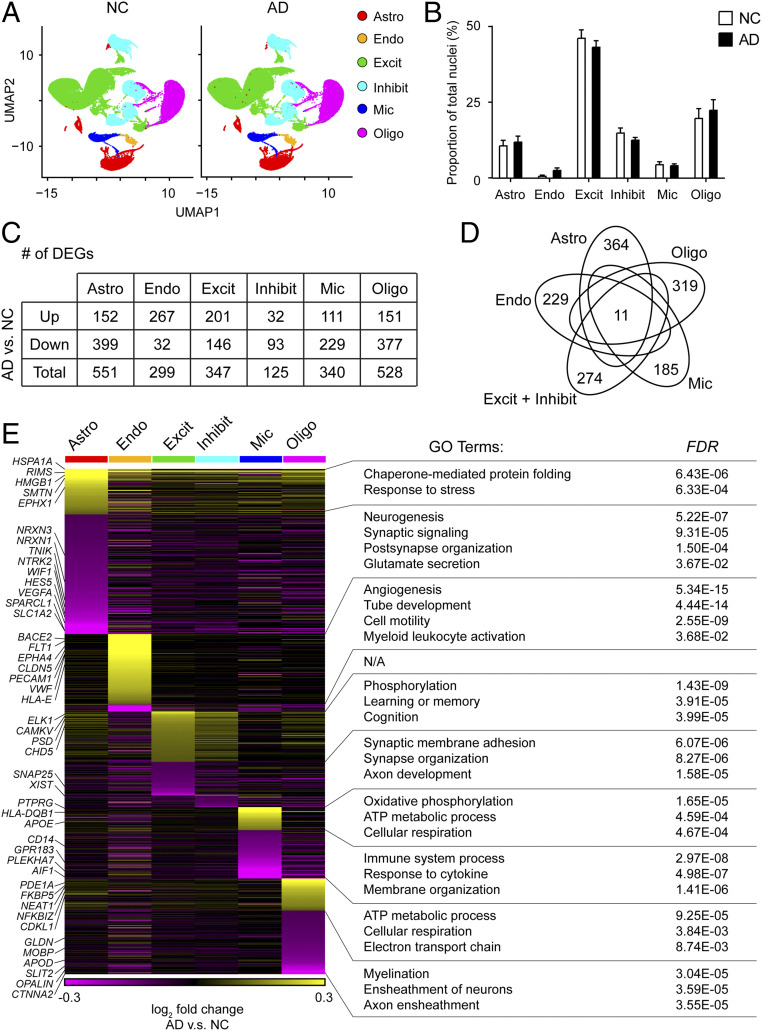
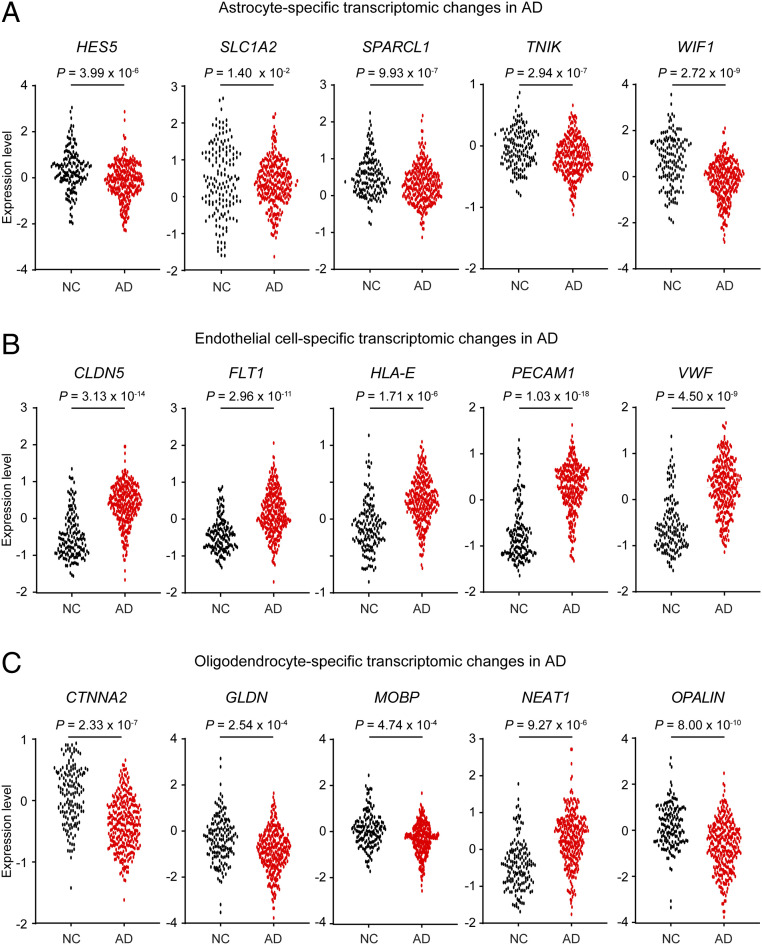
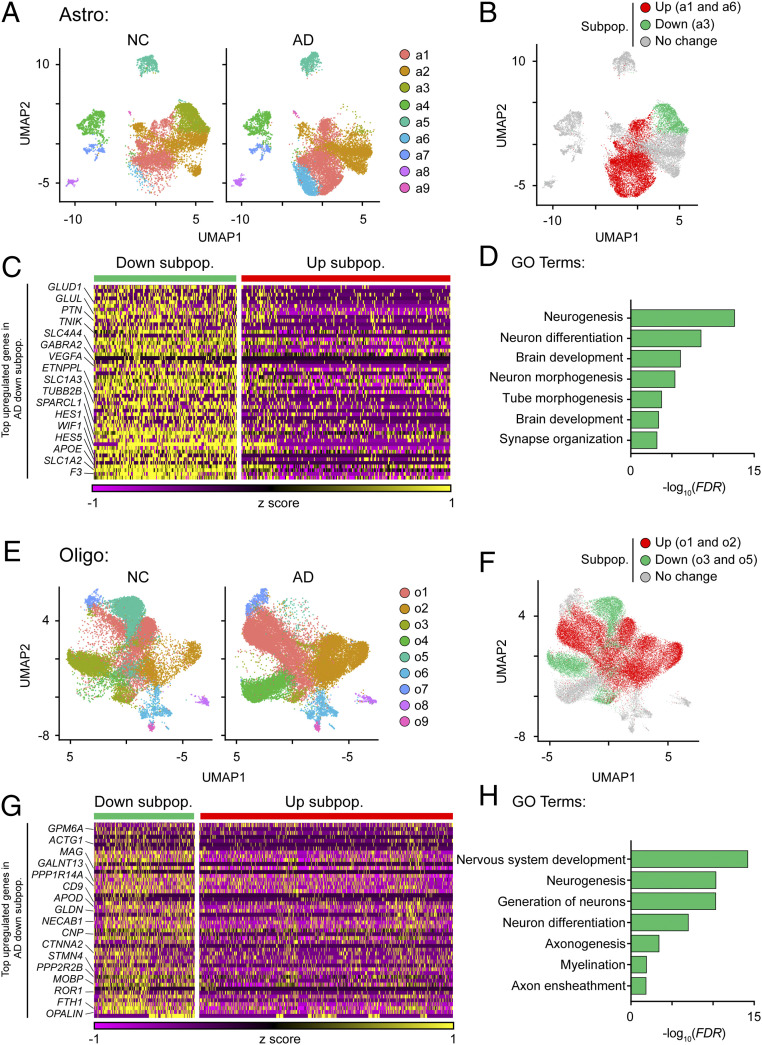
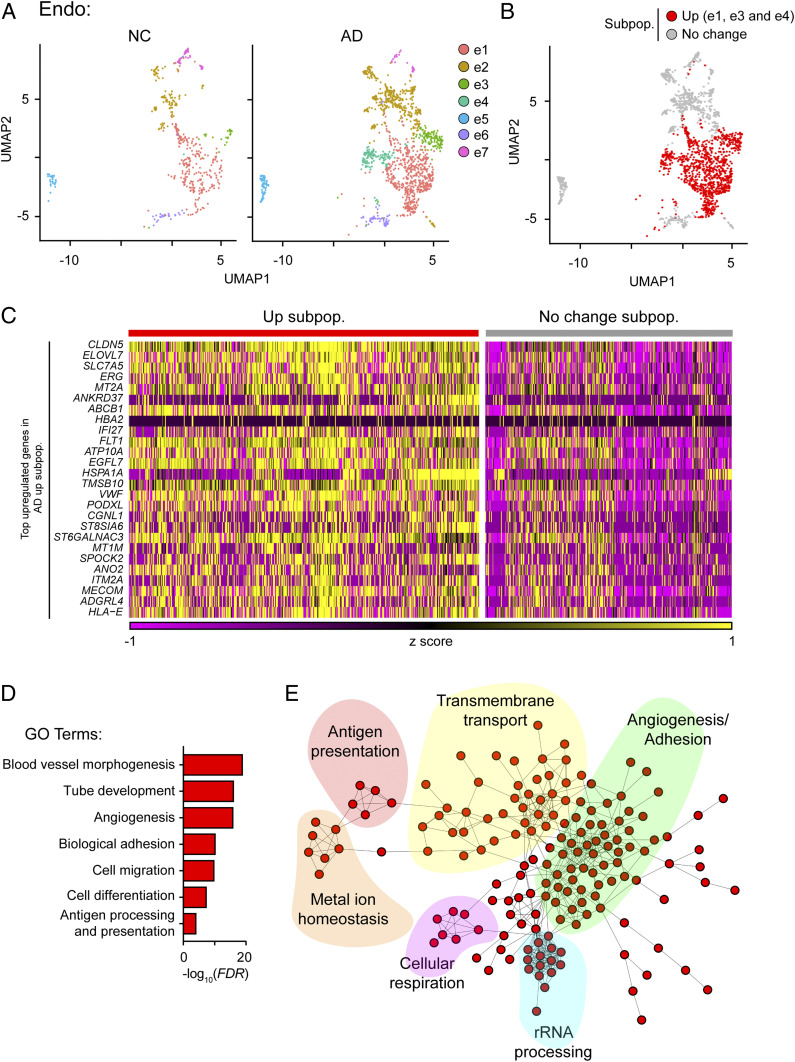
Alzheimer's disease (AD) is the most common form of dementia but has no effective treatment. A comprehensive investigation of cell type-specific responses and cellular heterogeneity in AD is required to provide precise molecular and cellular targets for therapeutic development. Accordingly, we perform single-nucleus transcriptome analysis of 169,496 nuclei from the prefrontal cortical samples of AD patients and normal control (NC) subjects. Differential analysis shows that the cell type-specific transcriptomic changes in AD are associated with the disruption of biological processes including angiogenesis, immune activation, synaptic signaling, and myelination. Subcluster analysis reveals that compared to NC brains, AD brains contain fewer neuroprotective astrocytes and oligodendrocytes. Importantly, our findings show that a subpopulation of angiogenic endothelial cells is induced in the brain in patients with AD. These angiogenic endothelial cells exhibit increased expression of angiogenic growth factors and their receptors (i.e., EGFL7, FLT1, and VWF) and antigen-presentation machinery (i.e., B2M and HLA-E). This suggests that these endothelial cells contribute to angiogenesis and immune response in AD pathogenesis. Thus, our comprehensive molecular profiling of brain samples from patients with AD reveals previously unknown molecular changes as well as cellular targets that potentially underlie the functional dysregulation of endothelial cells, astrocytes, and oligodendrocytes in AD, providing important insights for therapeutic development.

Keywords: angiogenesis; myelination; neurodegenerative diseases; synapse; synaptic signaling.


Conflict of interest statement

The authors declare no competing interest.

Figures

Fig. 1.
Fig. 1.
Single-nucleus transcriptome analysis of the prefrontal cortex in AD. (A) Single-nucleus transcriptome profiling workflow. (BD) Unbiased identification of cell-type heterogeneity in the human prefrontal cortex. (B) UMAP plot showing the six major cell types isolated from prefrontal cortex. (C) Proportions of cell types among the 169,496 sampled nuclei. (D) Heatmap showing the top five most enriched genes for each cell type. All data are mean ± SEM. See also SI Appendix, Fig. S1 and Tables S1 and S2.
Fig. 2.
Fig. 2.
Dysregulated molecular pathways in AD according to cell type-specific transcriptomic changes. UMAP plots (A) and bar plot (B) showing the proportions of the six major cell types found in the AD and NC prefrontal cortical samples. (C and D) AD-associated transcriptomic changes were highly cell type-specific. (C) Numbers of DEGs between AD and NC samples within each cell type (adjusted P < 0.1, log2 fold change ≥ 0.1 or ≤ −0.1). Down: down-regulated; Up: up-regulated. (D) Venn diagram showing the 11 coregulated DEGs among all six cell types. Also shown are the numbers of DEGs specific to each cell type. (E) The cell type-specific transcriptomic changes in AD were associated with distinct molecular pathways. Heatmap showing the expression changes of DEGs in all six cell types in AD samples. Specific GO terms are listed at Right. Astro: astrocytes, Endo: endothelial cells, Excit: excitatory neurons, Inhibit: inhibitory neurons, Mic: microglia, and Oligo: oligodendrocytes. All data are mean ± SEM. See also SI Appendix, Figs. S2 and S4 and Table S3.
Fig. 3.
Fig. 3.
Validation of the cell type-specific transcriptomic changes in AD based on data from a large cohort microarray study. Dot plots showing the expression levels of DEGs specific to astrocytes (A), endothelial cells (B), and oligodendrocytes (C) in the prefrontal cortex from patients with AD (n = 310) and NC (n = 157) samples. Each dot represents the expression level from an individual subject. Source: Narayanan et al. (18). See also SI Appendix, Fig. S3 and Table S4.
Fig. 4.
Fig. 4.
The proportions of astrocytes and oligodendrocytes that regulate neuronal homeostasis are reduced in AD. (A) UMAP plots showing the distributions of astrocyte subpopulations (a1–a9) in AD and NC prefrontal cortical samples. (BD) The astrocyte subpopulation associated with the maintenance of synaptic functions was reduced in AD. (B) UMAP plot showing the distribution of the AD-associated astrocyte subpopulations. (C) Heatmap showing the expression levels of the top enriched genes in the AD-down-regulated astrocyte subpopulation (adjusted P < 0.1, log2 fold change ≥ 0.1). Down subpop.: down-regulated subpopulation; Up subpop.: up-regulated subpopulation. (D) GO pathway analysis of the transcriptomic signature of the AD-down-regulated astrocyte subpopulation. (E) UMAP plots showing the distributions of oligodendrocyte subpopulations (o1–o9) in AD and NC prefrontal cortical samples. (FH) Oligodendrocyte subpopulations associated with myelination were reduced in AD. (F) UMAP plot showing the distribution of the AD-associated oligodendrocyte subpopulations. (G) Top enriched genes in the AD-down-regulated oligodendrocyte subpopulations (adjusted P < 0.1, log2 fold change ≥ 0.1). Down subpop.: down-regulated subpopulation; Up subpop.: up-regulated subpopulation. (H) Pathway analysis of the transcriptomic signature of the AD-down-regulated oligodendrocyte subpopulations. See also SI Appendix, Figs. S5 and S6 and Table S5.
Fig. 5.
Fig. 5.
An endothelial cell subpopulation associated with enhanced angiogenesis and antigen presentation is increased in AD. (AC) Transcriptomically unique subpopulations of endothelial cells were present in AD samples. (A) UMAP plots showing the distributions of endothelial subpopulations (e1–e7) in AD and NC prefrontal cortical samples. (B) Distribution of AD-associated endothelial subpopulations. Red: AD-up-regulated subpopulations (i.e., e1, e3, and e4). (C) Expression levels of the top enriched genes in the AD-up-regulated subpopulations at the single-cell level (adjusted P < 0.1, log2 fold change ≥ 0.1). Up subpop.: up-regulated subpopulation. (D and E) The activated endothelial cells in AD were associated with angiogenesis and antigen presentation. GO analysis of the up-regulated genes in AD-up-regulated endothelial subpopulations (D), and STRING analysis (E) showing that the signature genes of activated endothelial cells form a protein–protein interaction network associated with six different functional pathways. See also SI Appendix, Fig. S7 and Table S5.

References

    1. Reitz C., Brayne C., Mayeux R., Epidemiology of Alzheimer disease. Nat. Rev. Neurol. 7, 137–152 (2011). - PMC - PubMed
    1. Fu W. Y., Wang X., Ip N. Y., Targeting neuroinflammation as a therapeutic strategy for Alzheimer’s disease: Mechanisms, drug candidates, and new opportunities. ACS Chem. Neurosci. 10, 872–879 (2019). - PubMed
    1. Snyder E. M. et al. ., Regulation of NMDA receptor trafficking by amyloid-β. Nat. Neurosci. 8, 1051–1058 (2005). - PubMed
    1. Chen Y., Fu A. K. Y., Ip N. Y., Synaptic dysfunction in Alzheimer’s disease: Mechanisms and therapeutic strategies. Pharmacol. Ther. 195, 186–198 (2019). - PubMed
    1. Scheff S. W., Price D. A., Schmitt F. A., Mufson E. J., Hippocampal synaptic loss in early Alzheimer’s disease and mild cognitive impairment. Neurobiol. Aging 27, 1372–1384 (2006). - PubMed

Publication types