. 2020 Sep 28;5(51):eabe1670.
doi: 10.1126/sciimmunol.abe1670.

MAIT cell activation and dynamics associated with COVID-19 disease severity

Collaborators, Affiliations

MAIT cell activation and dynamics associated with COVID-19 disease severity

Tiphaine Parrot et al. Sci Immunol. .

Abstract

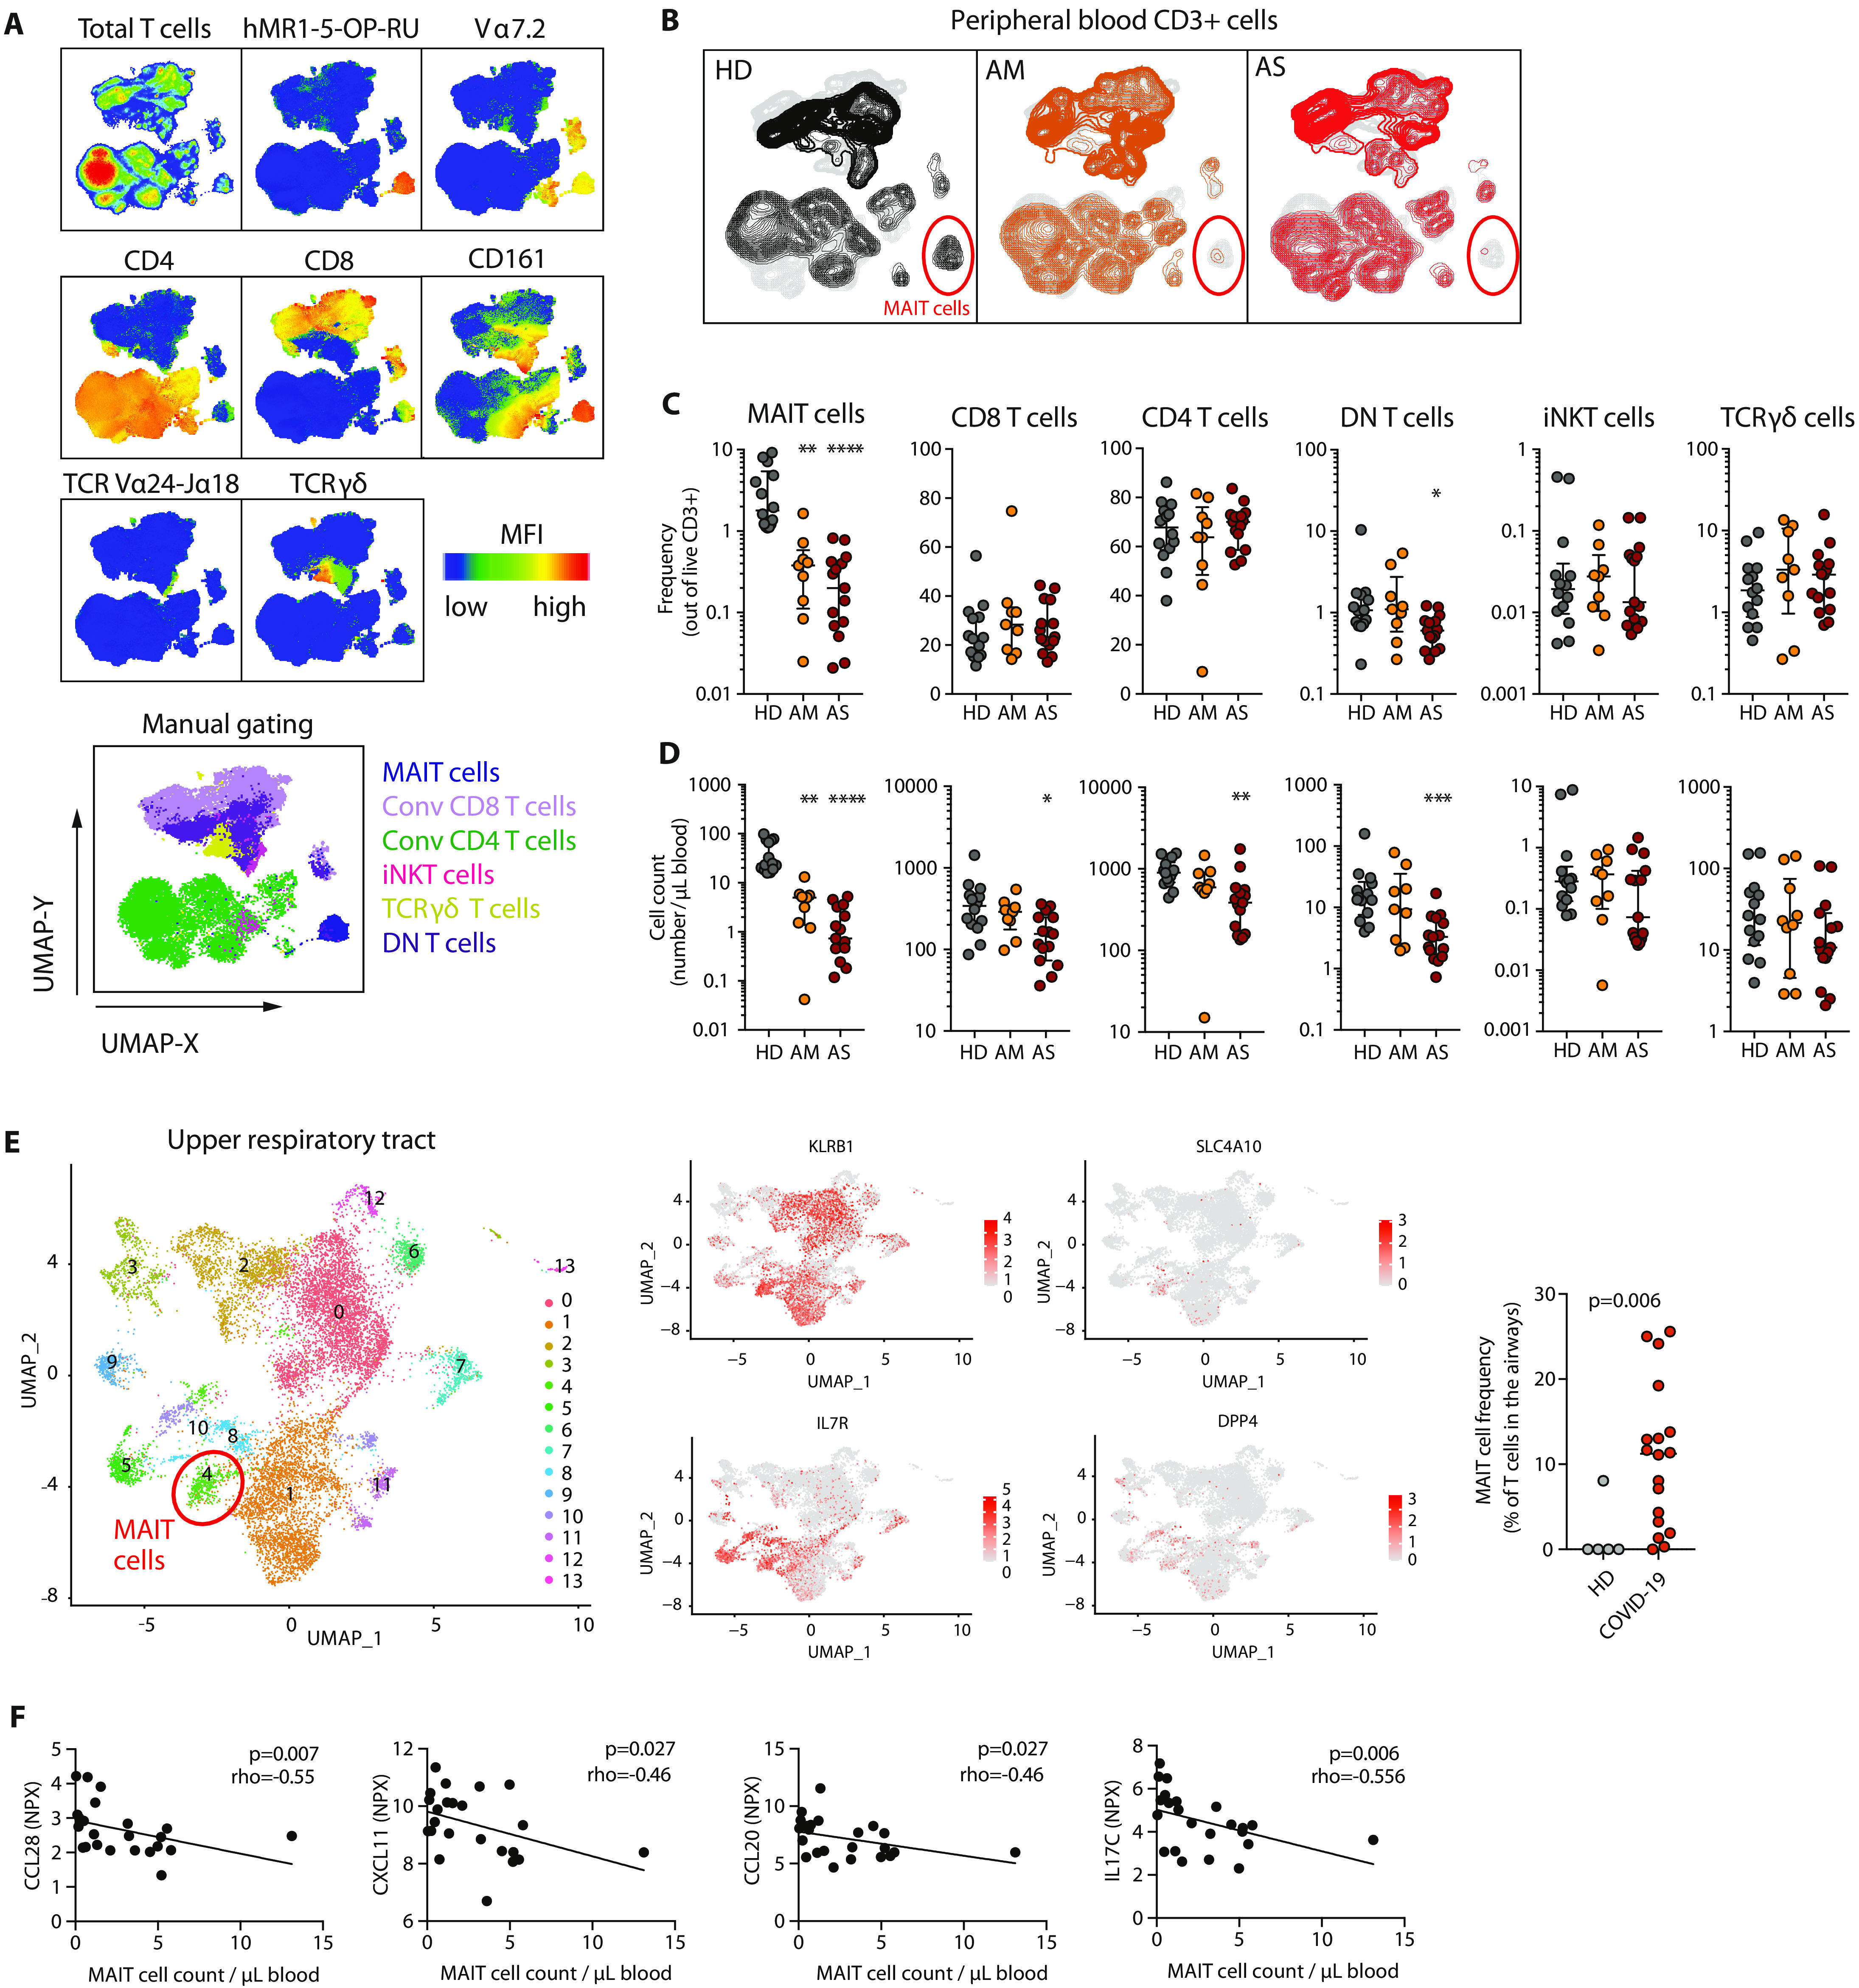
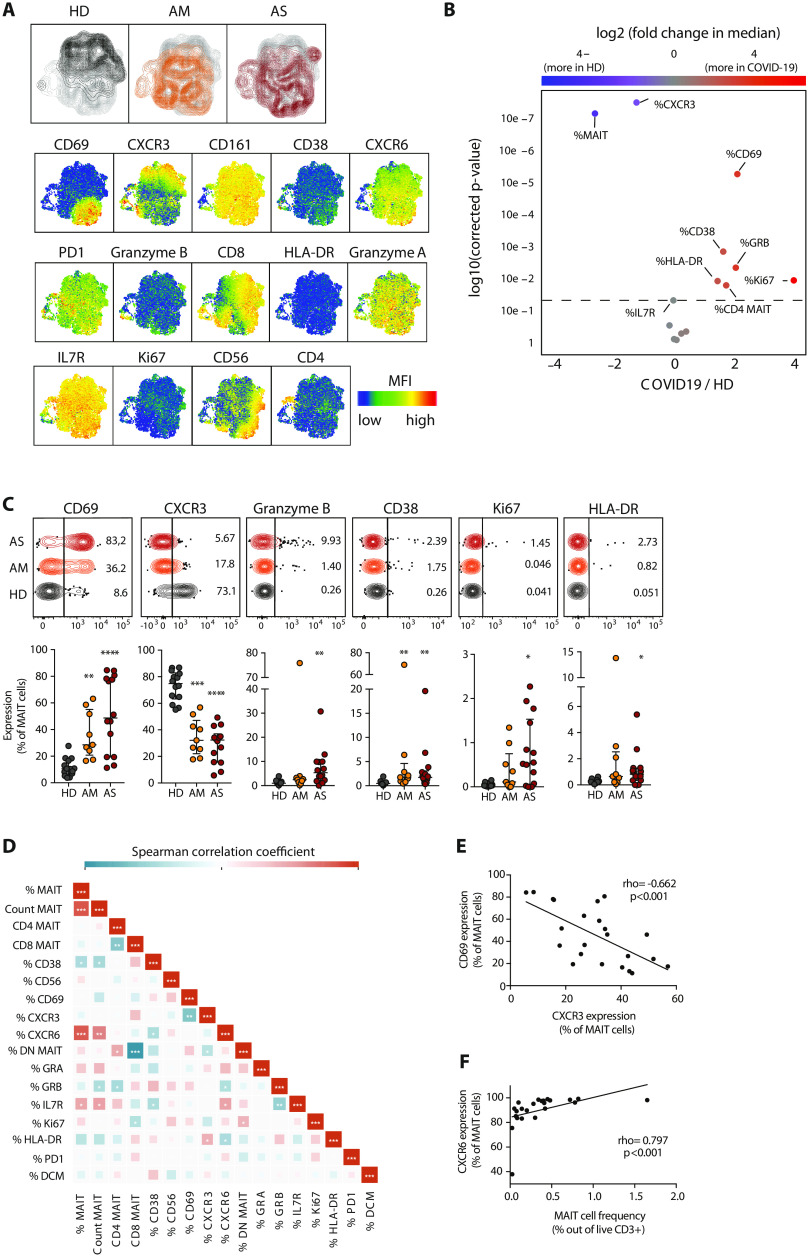
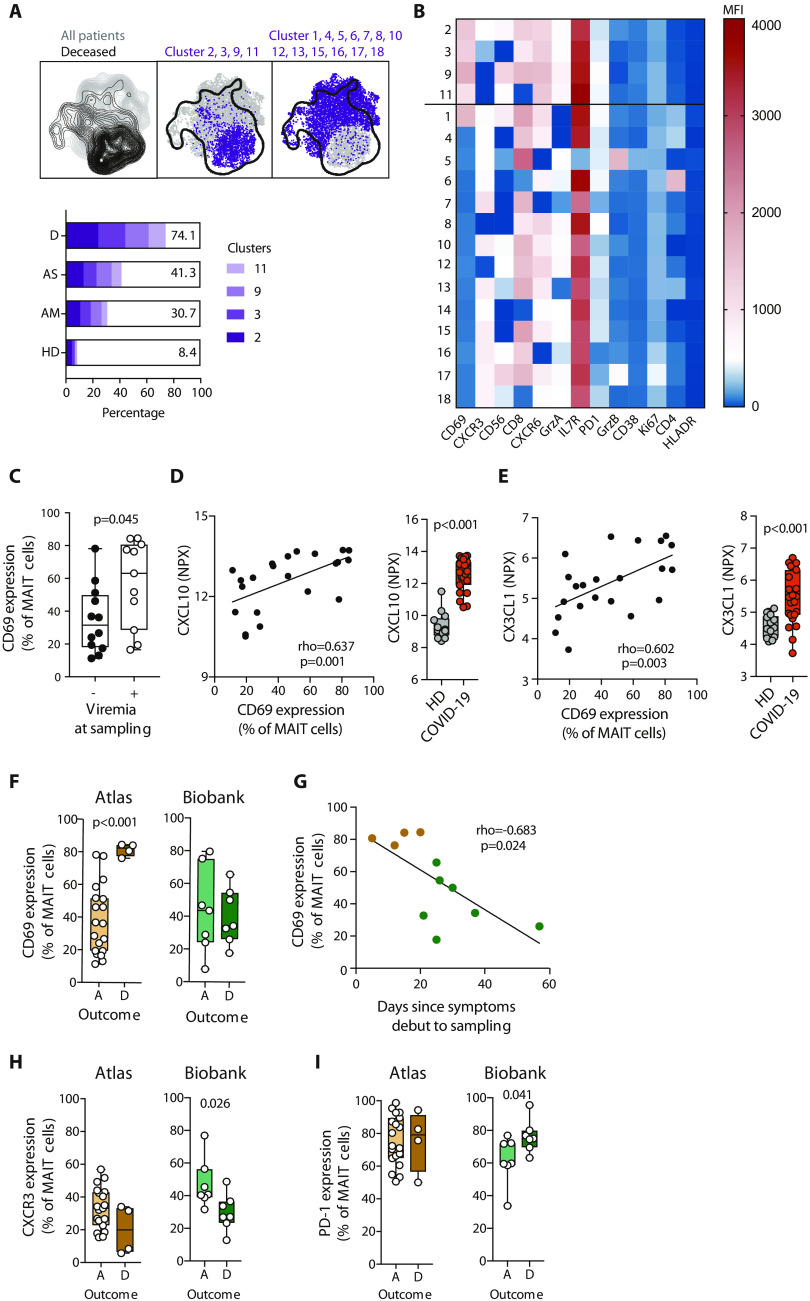
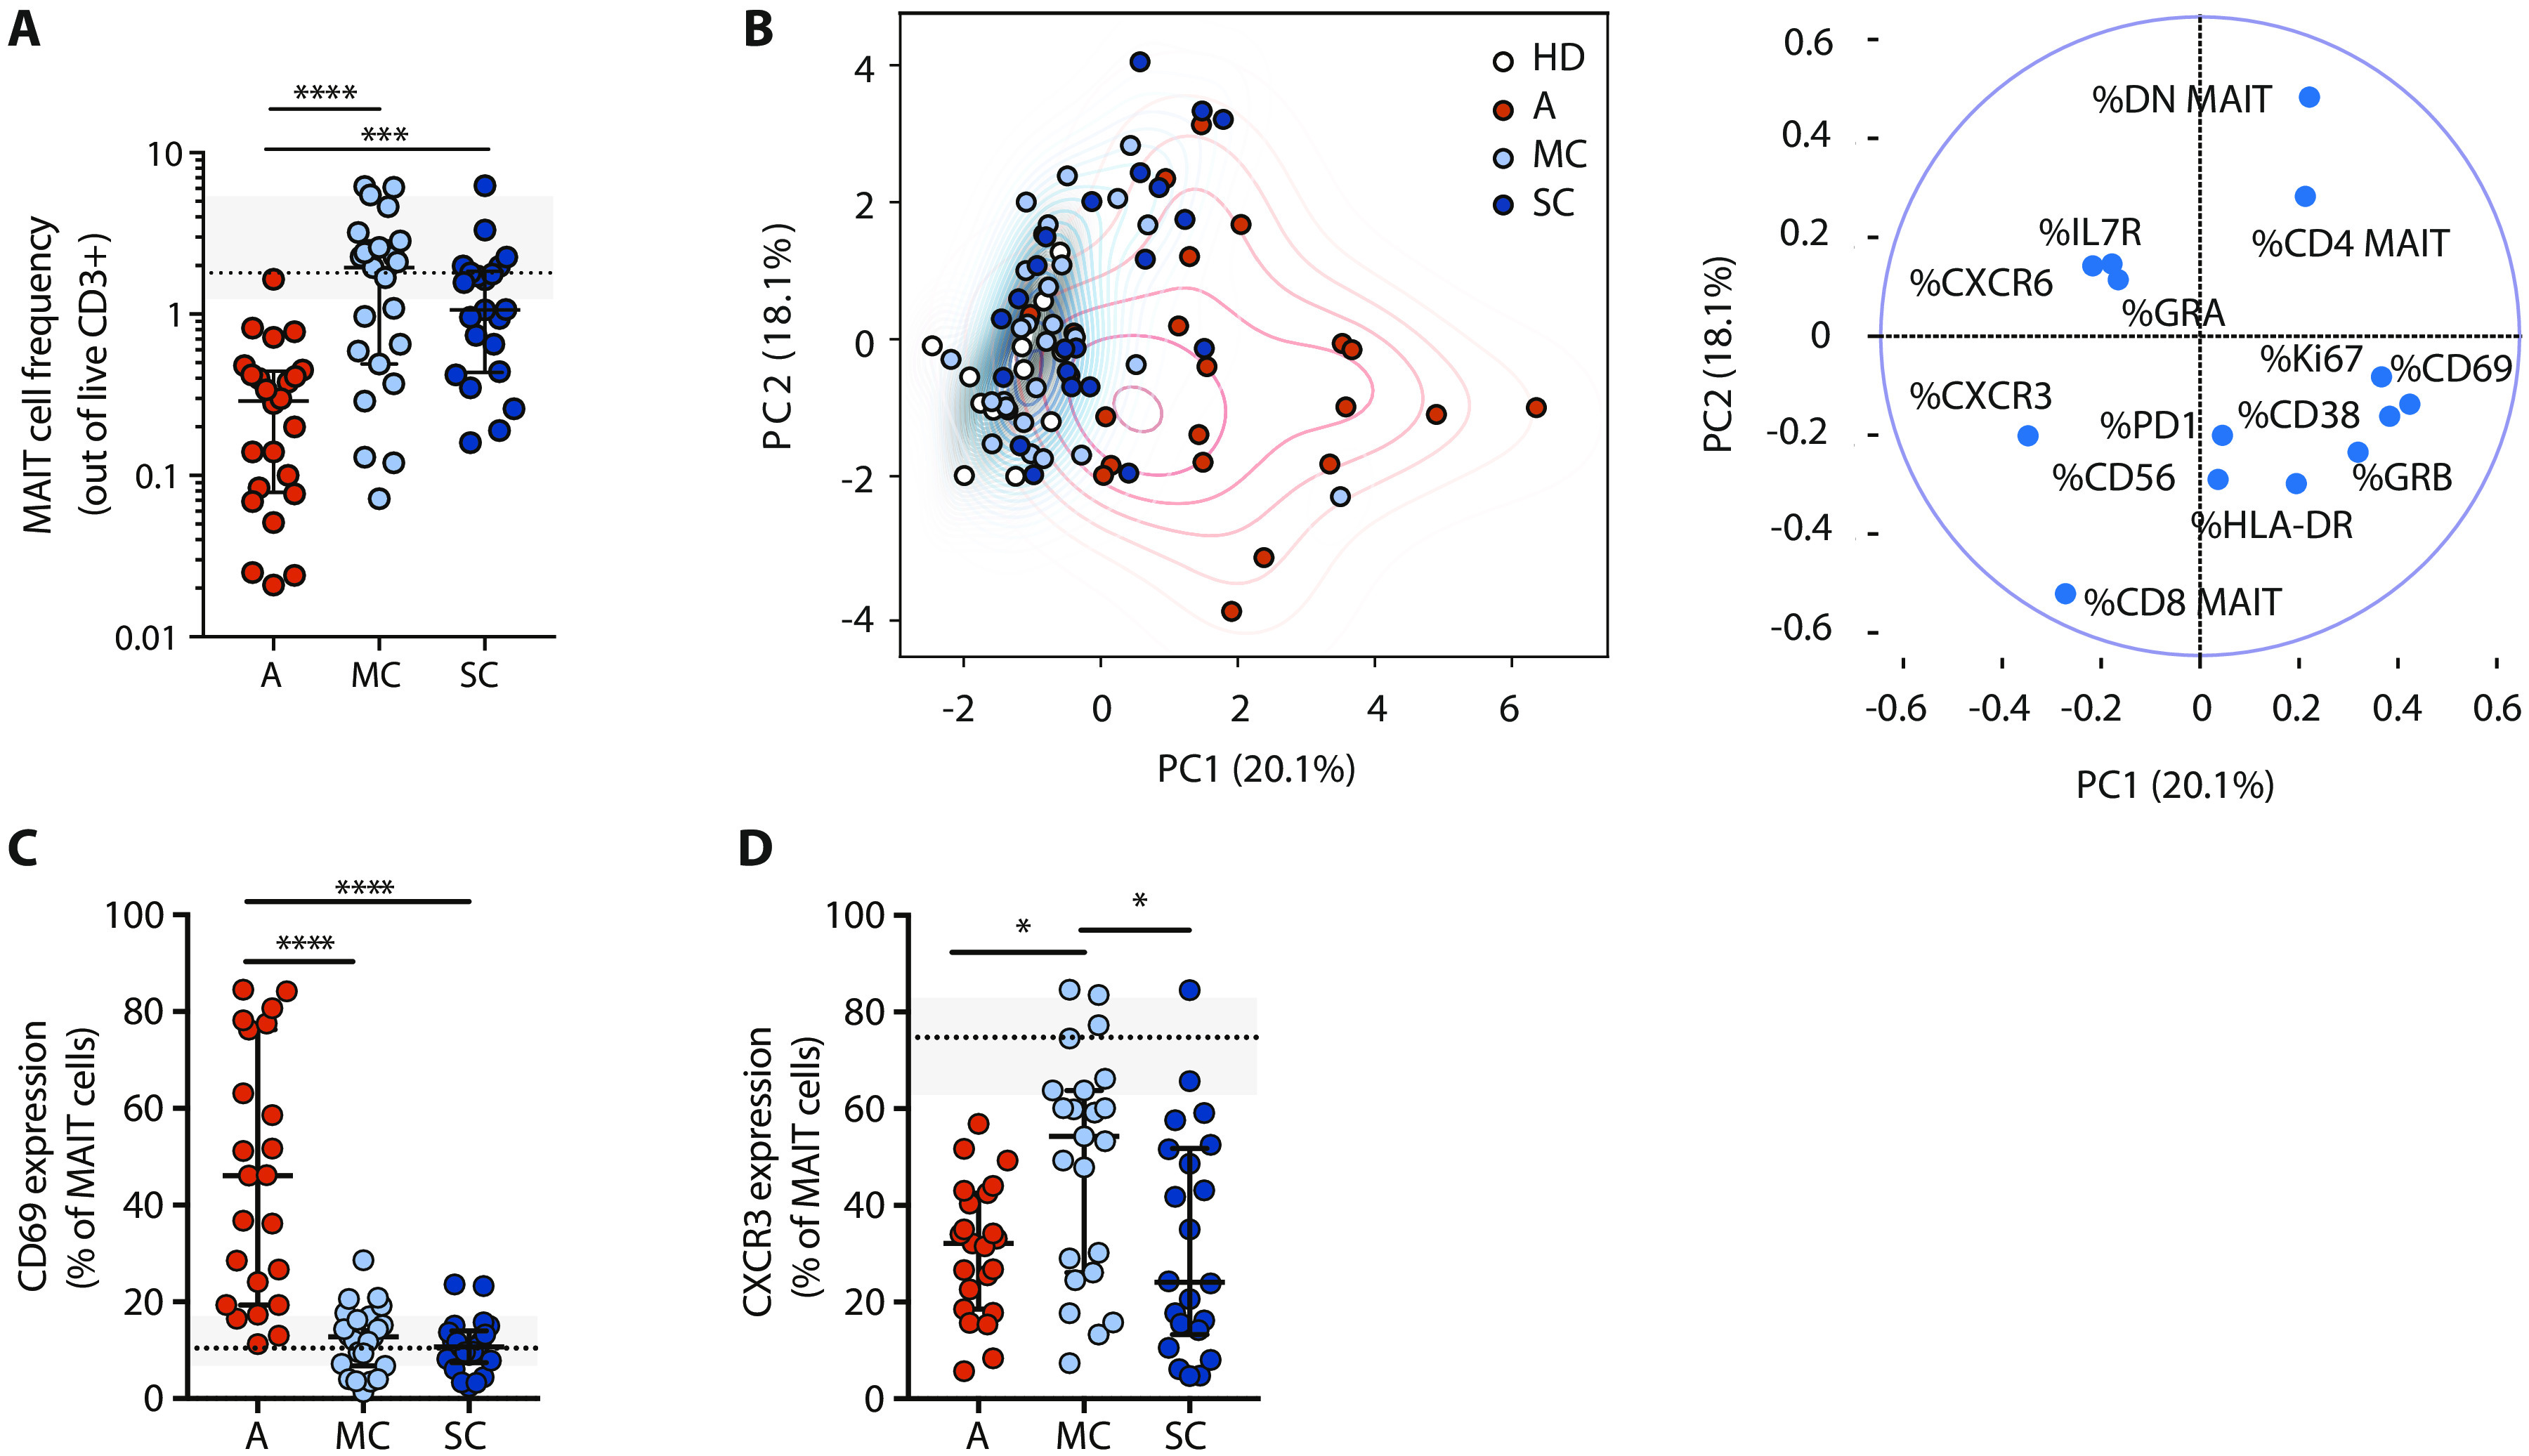
Severe COVID-19 is characterized by excessive inflammation of the lower airways. The balance of protective versus pathological immune responses in COVID-19 is incompletely understood. Mucosa-associated invariant T (MAIT) cells are antimicrobial T cells that recognize bacterial metabolites, and can also function as innate-like sensors and mediators of antiviral responses. Here, we investigated the MAIT cell compartment in COVID-19 patients with moderate and severe disease, as well as in convalescence. We show profound and preferential decline in MAIT cells in the circulation of patients with active disease paired with strong activation. Furthermore, transcriptomic analyses indicated significant MAIT cell enrichment and pro-inflammatory IL-17A bias in the airways. Unsupervised analysis identified MAIT cell CD69high and CXCR3low immunotypes associated with poor clinical outcome. MAIT cell levels normalized in the convalescent phase, consistent with dynamic recruitment to the tissues and later release back into the circulation when disease is resolved. These findings indicate that MAIT cells are engaged in the immune response against SARS-CoV-2 and suggest their possible involvement in COVID-19 immunopathogenesis.


Figures

Fig. 1
Fig. 1. Profound and preferential decline of MAIT cells in blood of patients with COVID-19.
(A) UMAP plots of total live CD3 T cells in peripheral blood showing expression of the indicated markers. Bottom: UMAP plots of total live CD3 T cells overlaid with the immune subsets identified by manual gating. (B) UMAP plots of total live CD3 T cells in peripheral blood colored according to the patient group: HD (n = 14), AM (n = 9), and AS (n = 15). CD3 T cells (20,000) per patient were down-sampled, barcoded according to the patient group, and concatenated. Red circle highlights the MAIT cell compartment. (C) Relative frequency [median ± interquartile range (IQR)] and (D) absolute counts (median ± IQR) of the indicated T cell subsets in peripheral blood. Each dot represents one donor. Nonparametric Kruskal-Wallis test and Dunn’s post hoc test were used to test for statistical differences between patient groups. *P < 0.05, **P < 0.01, ***P < 0.001, and ****P < 0.0001. (E) Left: UMAP plot displaying 13 clusters identified on the basis of gene expression levels of non–B lymphocytes in nasopharyngeal swabs (n = 4 HDs and n = 19 COVID-19 patients). Middle: UMAP plots of the transcripts KLRB1, SLC4A10, IL7R, and DPP4 used for MAIT cell identification. Right: Relative abundance of the MAIT cell–containing cluster (cluster 4) in nasopharyngeal swabs from HD and COVID-19 patients. Horizontal bars indicate medians. Each dot represents one donor. Nonparametric Mann-Whitney U test was used. (F) Spearman correlations between the absolute count of MAIT cells and cytokine and chemokine serum levels, expressed as NPX, in COVID-19 patients (n = 24). The Spearman correlation coefficient (rho) and the associated calculated P value (P) are indicated on each graph.
Fig. 2
Fig. 2. MAIT cell activation and decreased CXCR3 expression in peripheral blood of COVID-19 patients.
(A) Top: UMAP plots of MAIT cells in peripheral blood showing the clustering of MAIT cells by patient group. A maximum of 200 MAIT cells per patient were down-sampled, labeled according to patient group, and concatenated. Bottom: UMAP plots of MAIT cells showing the expression of the indicated marker. (B) Volcano plot showing the log2 (fold change) in median expression of the indicated markers on MAIT cells between HDs (n = 14) and COVID-19 patients (n = 23). Significantly up-regulated or down-regulated markers (P < 0.05) are shown in red and blue, respectively. P values were calculated using Wilcoxon ranked exact test and adjusted to a false discovery rate of 5% using the Benjamini-Hochberg method. (C) Top: Illustrative concatenated flow cytometry plots showing the percentage of expression of the indicated phenotypic markers on MAIT cells by patient group. Bottom: Expression (median ± IQR) of the indicated markers on MAIT cells in HD (n = 14), AM (n = 9), and AS (n = 14) COVID-19. Nonparametric Kruskal-Wallis test and Dunn’s post hoc test were used to detect significant differences between groups. *P < 0.05, **P < 0.01, ***P < 0.001, and ****P < 0.0001. (D) Heatmap displaying pairwise Spearman correlations between MAIT cell phenotypic parameters in COVID-19 patients. Color indicates the strength of the correlation. *P < 0.05, **P < 0.01, and ***P < 0.001. (E) Spearman correlation between CXCR3 and CD69 expression on MAIT cells in COVID-19. (F) Spearman correlation between MAIT cell frequency and CXCR6 expression on MAIT cells in COVID-19. (E and F) The Spearman correlation coefficient (rho) and the associated calculated P value (P) are indicated on the graphs.
Fig. 3
Fig. 3. Associations between peripheral blood MAIT cell characteristics and COVID-19 outcome.
(A) Top: UMAP plot of MAIT cells colored according to the outcome of the COVID-19 patients (left plot). Overlay of PhenoGraph clusters enriched in deceased (middle) or surviving (right) patients on the UMAP projection. Bottom: Proportion of MAIT cell clusters 2, 3, 9, and 11 for each patient group [HD, n = 14; AM, n = 9; AS, n = 14; deceased (D), n = 4]. (B) Heatmap of the median fluorescence intensity (MFI) of the phenotypic markers used to identify the 18 PhenoGraph MAIT cell clusters. The black line delimitates clusters enriched (top) or not (bottom) in deceased patients. (C) CD69 expression on MAIT cells in COVID-19 patients according to their viremia status at the time of sampling (−: negative, n = 12; +: positive, n = 11). (D) Left: Spearman correlation between CXCL10 serum level and CD69 expression on MAIT cells in COVID-19 patients (n = 23). Right: CXCL10 serum levels in HDs (n = 14) and COVID-19 patients (n = 24). (E) Left: Spearman correlation between CX3CL1 serum level and CD69 expression on MAIT cells in COVID-19 patients. Right: CX3CL1 serum levels in HD and COVID-19 patients (n = 23). (F) CD69 expression on MAIT cells in alive (A, n = 19) and deceased (D, n = 4) COVID-19 patients from the Atlas (left) and Biobank (right) cohorts. (G) Spearman correlation between CD69 expression on MAIT cells and the days since symptoms debut to sampling in deceased patients from the Atlas (brown) and the Biobank (green) cohorts. (H) CXCR3 and (I) PD-1 expression on MAIT cells in alive (A) and deceased (D) COVID-19 patients from the Atlas and Biobank cohorts. (D and E) Concentrations expressed as NPX (log2). (C to F, H, and I) Each dot represents one donor. Nonparametric Mann-Whitney test was used to detect significant differences between groups. (D, E, and G) Each dot represents one donor. The Spearman correlation coefficient (rho) and P value (P) are indicated on the graph.
Fig. 4
Fig. 4. Recovery of peripheral blood MAIT cells in convalescent COVID-19.
(A) MAIT cell peripheral blood frequency (median ± IQR) in all acute (A, n = 23), mild convalescent (MC, n = 23), and severe convalescent (SC, n = 22) COVID-19 patients. MAIT cell frequency (median ± IQR) in HDs (n = 14) is shown in gray. (B) Left: PCA showing the distribution and segregation of MAIT cell populations in HD (white dots), A (red dots, n = 23), MC (light blue, n = 23), and SC (dark blue, n = 22) COVID-19 patients. Right: PCA biplot representing the influence of each parameter on principal components 1 (PC1) and 2 (PC2). (C) Graph illustrating CD69 and (D) CXCR3 expression on MAIT cells in A, MC, and SC patient groups. Expression in HD (median ± IQR) is shown in gray. (A, C, and D) Each dot represents one patient. Nonparametric Kruskal-Wallis test and Dunn’s post hoc test were used to detect significant differences between the acute and convalescent groups. *P < 0.05, ***P < 0.001, and ****P < 0.0001.

References

    1. Tay M. Z., Poh C. M., Rénia L., MacAry P. A., Ng L. F. P., The trinity of COVID-19: Immunity, inflammation and intervention. Nat. Rev. Immunol. 20, 363–374 (2020). - PMC - PubMed
    1. Giamarellos-Bourboulis E. J., Netea M. G., Rovina N., Akinosoglou K., Antoniadou A., Antonakos N., Damoraki G., Gkavogianni T., Adami M.-E., Katsaounou P., Ntaganou M., Kyriakopoulou M., Dimopoulos G., Koutsodimitropoulos I., Velissaris D., Koufargyris P., Karageorgos A., Katrini K., Lekakis V., Lupse M., Kotsaki A., Renieris G., Theodoulou D., Panou V., Koukaki E., Koulouris N., Gogos C., Koutsoukou A., Complex immune dysregulation in COVID-19 patients with severe respiratory failure. Cell Host Microbe 27, 992–1000.e3 (2020). - PMC - PubMed
    1. Chen G., Wu D., Guo W., Cao Y., Huang D., Wang H., Wang T., Zhang X., Chen H., Yu H., Zhang X., Zhang M., Wu S., Song J., Chen T., Han M., Li S., Luo X., Zhao J., Ning Q., Clinical and immunological features of severe and moderate coronavirus disease 2019. J. Clin. Invest. 130, 2620–2629 (2020). - PMC - PubMed
    1. Ni L., Ye F., Cheng M.-L., Feng Y., Deng Y.-Q., Zhao H., Wei P., Ge J., Gou M., Li X., Sun L., Cao T., Wang P., Zhou C., Zhang R., Liang P., Guo H., Wang X., Qin C.-F., Chen F., Dong C., Detection of SARS-CoV-2-specific humoral and cellular immunity in COVID-19 convalescent individuals. Immunity 52, 971–977.e3 (2020). - PMC - PubMed
    1. De Biasi S., Meschiari M., Gibellini L., Bellinazzi C., Borella R., Fidanza L., Gozzi L., Iannone A., Lo Tartaro D., Mattioli M., Paolini A., Menozzi M., Milić J., Franceschi G., Fantini R., Tonelli R., Sita M., Sarti M., Trenti T., Brugioni L., Cicchetti L., Facchinetti F., Pietrangelo A., Clini E., Girardis M., Guaraldi G., Mussini C., Cossarizza A., Marked T cell activation, senescence, exhaustion and skewing towards TH17 in patients with COVID-19 pneumonia. Nat. Commun. 11, 3434 (2020). - PMC - PubMed

Publication types

MeSH terms

LinkOut - more resources