. 2020 Sep 23;11(9):790.
doi: 10.1038/s41419-020-03009-4.

Glucocorticoids induce differentiation and chemoresistance in ovarian cancer by promoting ROR1-mediated stemness

Affiliations

Glucocorticoids induce differentiation and chemoresistance in ovarian cancer by promoting ROR1-mediated stemness

Hanna Karvonen et al. Cell Death Dis. .

Abstract

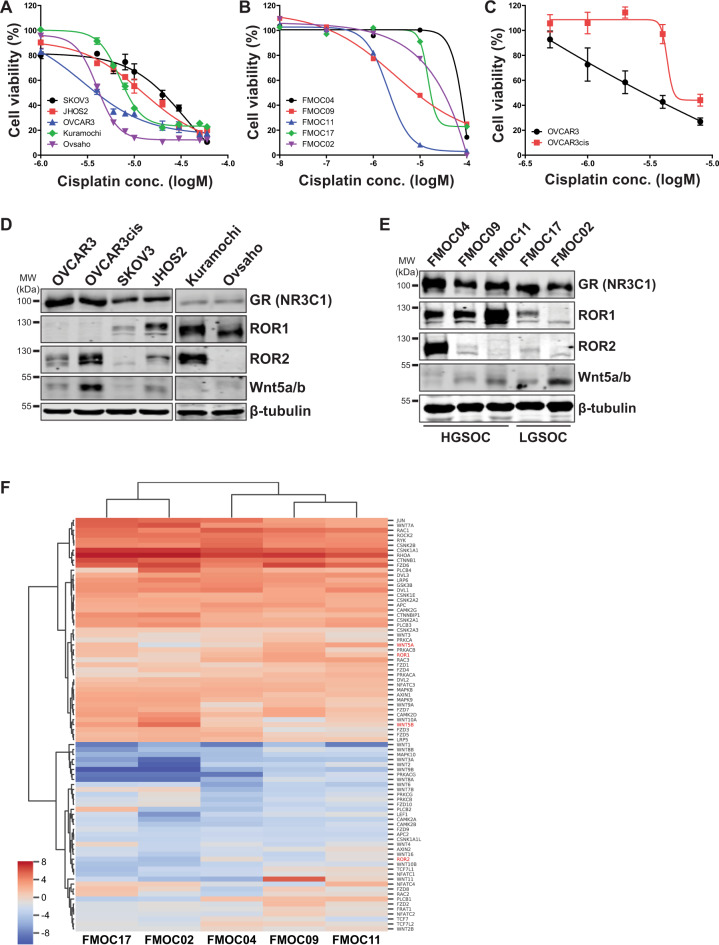
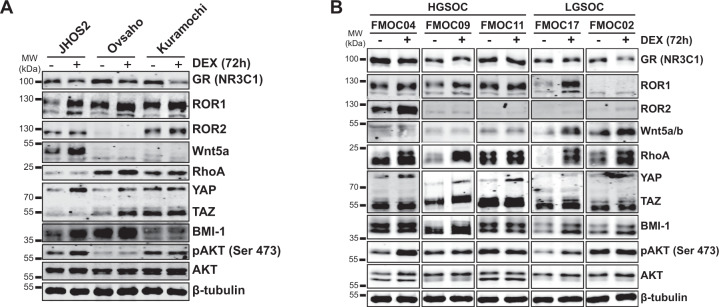
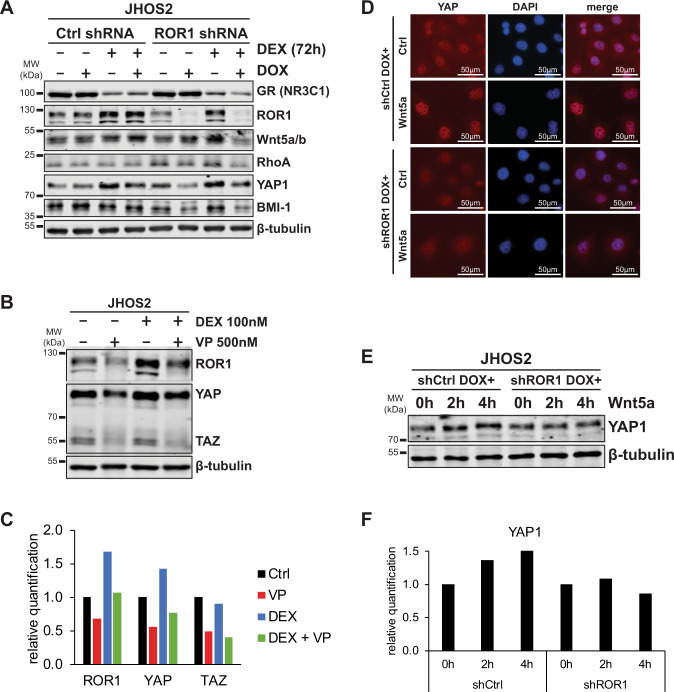
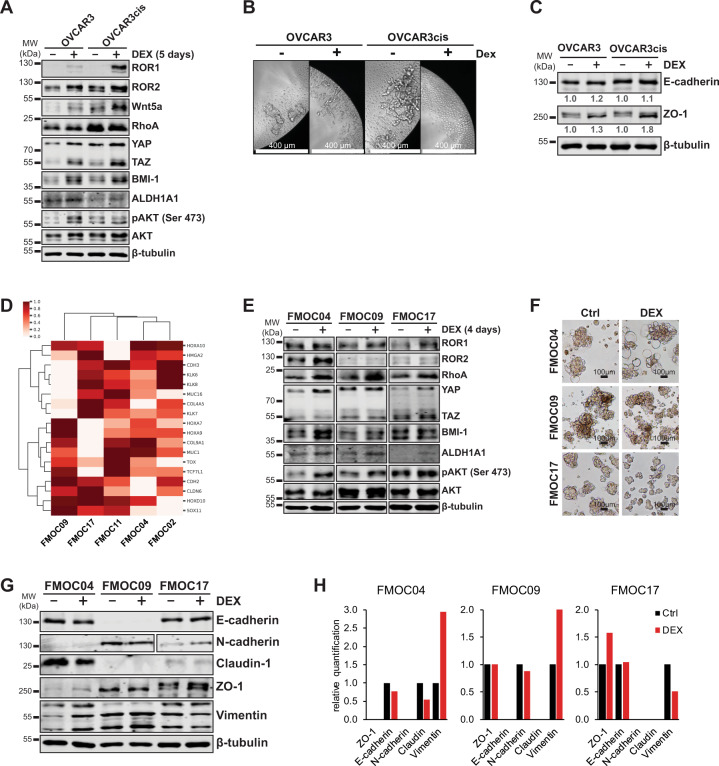
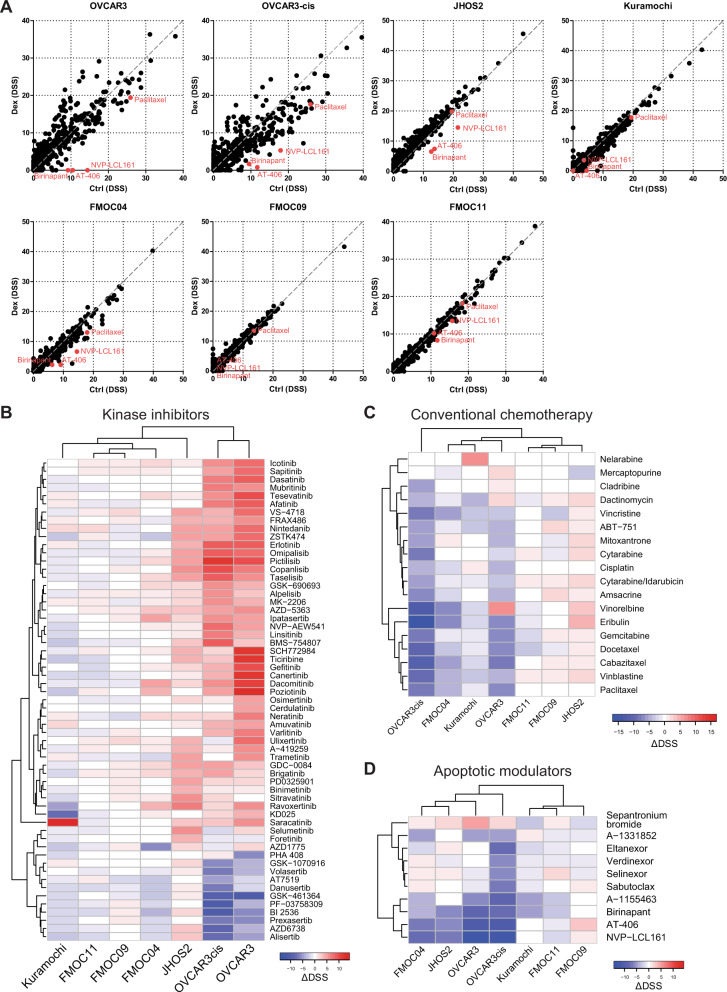
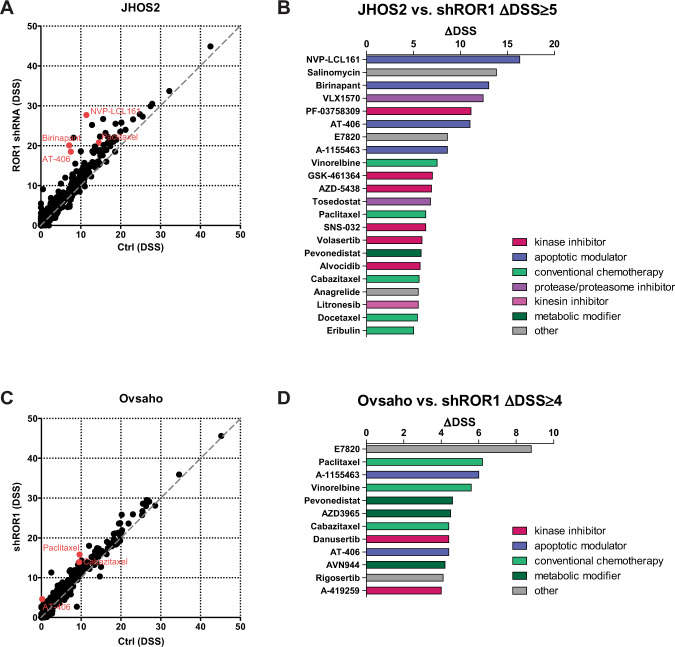
Glucocorticoids are routinely used in the clinic as anti-inflammatory and immunosuppressive agents as well as adjuvants during cancer treatment to mitigate the undesirable side effects of chemotherapy. However, recent studies have indicated that glucocorticoids may negatively impact the efficacy of chemotherapy by promoting tumor cell survival, heterogeneity, and metastasis. Here, we show that dexamethasone induces upregulation of ROR1 expression in ovarian cancer (OC), including platinum-resistant OC. Increased ROR1 expression resulted in elevated RhoA, YAP/TAZ, and BMI-1 levels in a panel of OC cell lines as well as primary ovarian cancer patient-derived cells, underlining the translational relevance of our studies. Importantly, dexamethasone induced differentiation of OC patient-derived cells ex vivo according to their molecular subtype and the phenotypic expression of cell differentiation markers. High-throughput drug testing with 528 emerging and clinical oncology compounds of OC cell lines and patient-derived cells revealed that dexamethasone treatment increased the sensitivity to several AKT/PI3K targeted kinase inhibitors, while significantly decreasing the efficacy of chemotherapeutics such as taxanes, as well as anti-apoptotic compounds such as SMAC mimetics. On the other hand, targeting ROR1 expression increased the efficacy of taxane drugs and SMAC mimetics, suggesting new combinatorial targeted treatments for patients with OC.


Conflict of interest statement

The authors declare that they have no conflict of interest.

Figures

Fig. 1
Fig. 1. Analysis of cisplatin sensitivity and the expression of Wnt5a, ROR1, ROR2, and NR3C1 in OC cell lines and PDCs.
a, b The sensitivity of OC cell lines a OVCAR3, JHOS2, SKOV3, Kuramochi, Ovsaho, and patient-derived primary cells (PDCs) b to cisplatin was tested with cell viability assay after 72 h incubation with various cisplatin concentrations as indicated. The bars represent mean ± SD. c The sensitivity of OVCAR3 and OVCAR3cis to cisplatin was measured by cell viability assay after 72 h incubation with various concentrations of cisplatin. The bars represent mean ± SD. OVCAR3cis showed high resistance to cisplatin cytotoxicity. d, e Western blot analysis of Wnt5a, ROR1, ROR2, and NR3C1 expression in OC cell lines (d) and PDC (e) cell lysates. β-tubulin was used as a loading control. f Hierarchical clustering of expression of KEGG defined Wnt-pathway genes. Values are presented as log2 transformed transcripts per kilobase million (TPM) from RNA-Seq from five PDCs; (blue = low; red = high). HGSOC high-grade serous ovarian cancer, LGSOC low-grade serous ovarian cancer.
Fig. 2
Fig. 2. DEX treatment enhances the expression of ROR1 and its downstream signaling in OC models.
a OC cell lines JHOS2, Kuramochi, and Ovsaho were left untreated or treated with 100 nM DEX for 72 h, followed by western blot analysis of respective protein levels as indicated. β-tubulin was used as a loading control. b OC PDCs were cultured ex vivo and untreated or treated with 100 nM DEX for 72 h, followed by western blot analysis of respective protein levels as in a. β-tubulin was used as a loading control. A representative of three technical replicates is shown for each panel.
Fig. 3
Fig. 3. ROR1 expression associates with YAP/TAZ and BMI-1 activation in OC cells.
a JHOS2 cells stable transfected with doxycycline-inducible Ctrl or ROR1 shRNA were untreated or treated with 100 ng/ml doxycycline for 48 h followed by 100 nM DEX treatment for an additional 72 h as indicated. Western blot analysis of total cell lysates was carried out for respective protein levels as indicated. β-tubulin was used as a loading control. b JHOS2 cells were untreated or treated with 100 nM DEX for 48 h followed by 500 nM verteporfin (VP) treatment for an additional 24 h as indicated. Western blot analysis of total cell lysates was performed for YAP/TAZ and ROR1 levels, while β-tubulin was used as a loading control. c Protein quantification from b. d, e DOX-treated JHOS2 cells stable transfected with Ctrl or ROR1 shRNA and treated with DOX in the presence or absence of Wnt5a stimulation for Immunofluorescence staining of YAP1 (Wnt5A 50 ng/ml for 2 h) (d) and western blot analysis (Wnt5a 50 ng/ml for 0/2/4 h as indicated) (e). f Quantification of YAP1 levels from e. Protein levels were normalized to β-tubulin and 0 h (no Wnt5a stimulation) used as a reference point (value 1) for YAP1 levels.
Fig. 4
Fig. 4. DEX treatment enhances ROR signaling (ROR1, ROR2, and Wnt5a) and stemness phenotype in OC spheroids while promoting cell differentiation.
a Western blot analysis of OVCAR3/OVCAR3cis cells grown in spheroid conditions in the presence or absence of 100 nM DEX treatment for 5 days. β-tubulin was used as a loading control. A marked increase in ROR signaling (Wnt5a, ROR1, and ROR2 levels) and stemness markers (BMI-1, ALDH1A1, and YAP/TAZ) is observed in DEX-treated spheroids. b Photomicrographs of OVCAR3/OVCAR3cis grown in spheroid conditions and treated as in a, scale bar 400 μM. c Western blot analysis and quantification of E-cadherin and ZO-1 levels of OVCAR3/OVCAR3cis grown in spheroid conditions and treated as in a. β-tubulin was used as a loading control. Protein levels were normalized to β-tubulin and an untreated sample was used as a reference point (value 1) for quantification. d Hierarchical clustering of expression of mesenchymal, de-differentiated, cell type marker genes shows that FMOC09 exhibits a mesenchymal-like expression pattern; high expression of SOX11, and low expression of kallikreins. Values are presented as log2 transformed transcripts per kilobase million (TPM) from RNA-Seq from five PDCs, which have been row-normalized (zero to one). e Western blot analysis of PDC spheroids in the presence or absence of 100 nM DEX treatment as indicated showing upregulation of ROR1, ROR2, and its downstream YAP/TAZ and BMI-1 markers, as well as ALDH1A1 and pAKT levels in DEX-treated samples. β-tubulin was used as a loading control. f Photomicrographs of PDCs grown in spheroid conditions and treated as in e, scale bar 100 μM. gh Western blot analysis (g) and protein quantification (h) of differentiation markers in cell lysates derived from PDCs spheroids grown as in f. Protein levels were normalized to β-tubulin and an untreated sample was used as a reference point (value 1) for quantification. A representative of three technical replicates is shown for each panel.
Fig. 5
Fig. 5. DEX treatment modulates drug sensitivities in OC cell lines and PDC.
a Plots depicting drug-sensitivity scores (DSS) for OC cell lines and PDCs representing Ctrl (untreated) vs. DEX-treated cells. Selected SMAC mimetic drugs and paclitaxel are highlighted in red. bd Hierarchically clustered heatmaps for ΔDSS (DSSDex – DSSCtrl) values for selected kinase inhibitors (b), conventional chemotherapy drugs (c), and apoptotic modulators (d).
Fig. 6
Fig. 6. Targeting ROR1 expression enhances the efficacy of SMAC mimetics and taxane agents in JHOS2 and Ovsaho cells.
Plot depicting drug-sensitivity scores (DSS) for OC cell line JHOS2 Ctrl vs. ROR1 shRNA (a) and Ovsaho Ctrl vs. ROR1 shRNA (c). Selected SMAC mimetic drugs and paclitaxel are highlighted in red. Waterfall plot with selected drugs that have ΔDSS (DSSDex − DSSCtrl) value ≥ 5 for JHOS2 cells (b), and ≥4 for Ovsaho cells (d).

References

    1. Siegel RL, Miller KD, Jemal A. Cancer statistics, 2017. CA Cancer J. Clin. 2017;67:7–30. doi: 10.3322/caac.21387. - DOI - PubMed
    1. Wright AA, et al. Neoadjuvant chemotherapy for newly diagnosed, advanced ovarian cancer: Society of Gynecologic Oncology and American Society of Clinical Oncology Clinical Practice Guideline. J. Clin. Oncol. 2016;34:3460–3473. doi: 10.1200/JCO.2016.68.6907. - DOI - PMC - PubMed
    1. Bowtell DD, et al. Rethinking ovarian cancer II: reducing mortality from high-grade serous ovarian cancer. Nat. Rev. Cancer. 2015;15:668–679. doi: 10.1038/nrc4019. - DOI - PMC - PubMed
    1. Gershenson DM. Low-grade serous carcinoma of the ovary or peritoneum. Ann. Oncol. 2016;27:i45–i49. doi: 10.1093/annonc/mdw085. - DOI - PubMed
    1. Yennurajalingam S, et al. Reduction of cancer-related fatigue with dexamethasone: a double-blind, randomized, placebo-controlled trial in patients with advanced cancer. J. Clin. Oncol. 2013;31:3076–3082. doi: 10.1200/JCO.2012.44.4661. - DOI - PubMed

Publication types

MeSH terms

Substances