. 2020 Oct;22(10):1170-1179.
doi: 10.1038/s41556-020-00579-5. Epub 2020 Sep 28.

SIRT1 is downregulated by autophagy in senescence and ageing

Affiliations

SIRT1 is downregulated by autophagy in senescence and ageing

Caiyue Xu et al. Nat Cell Biol. 2020 Oct.

Abstract

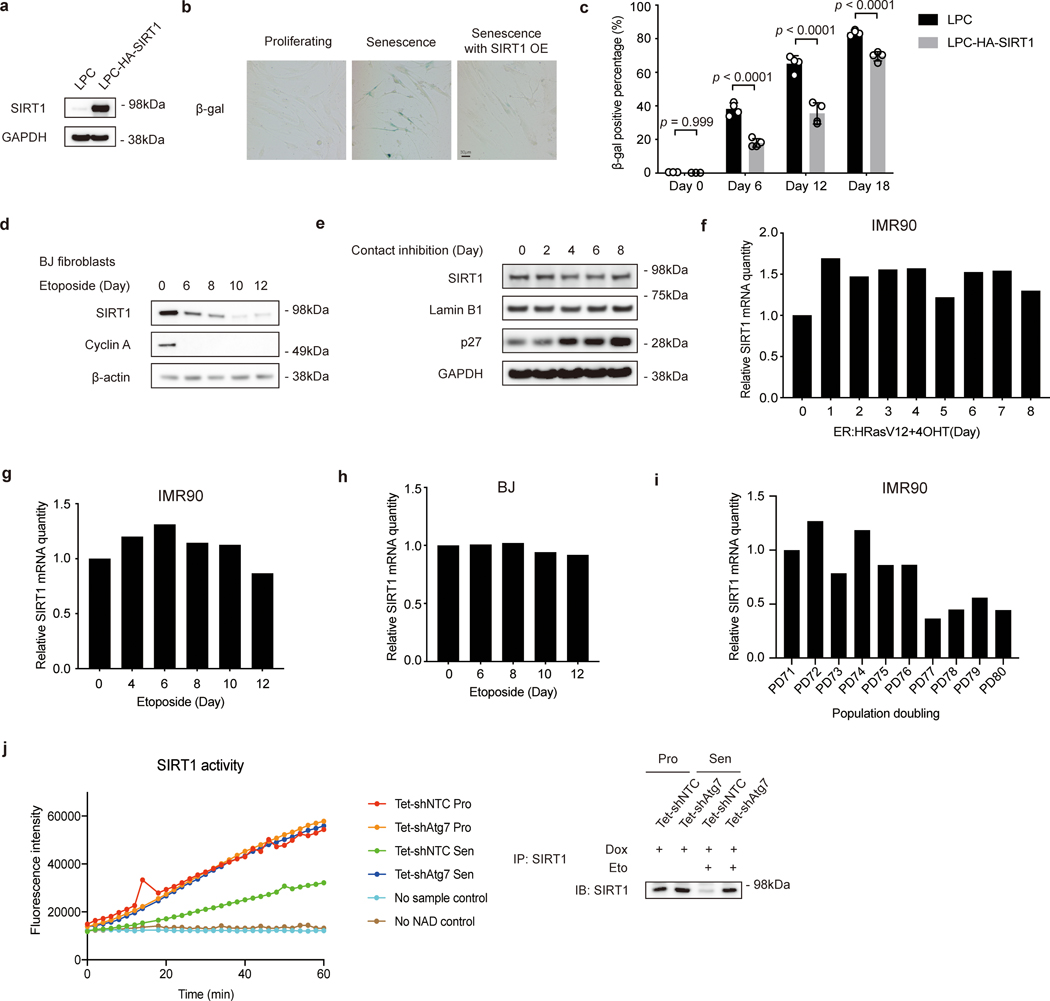
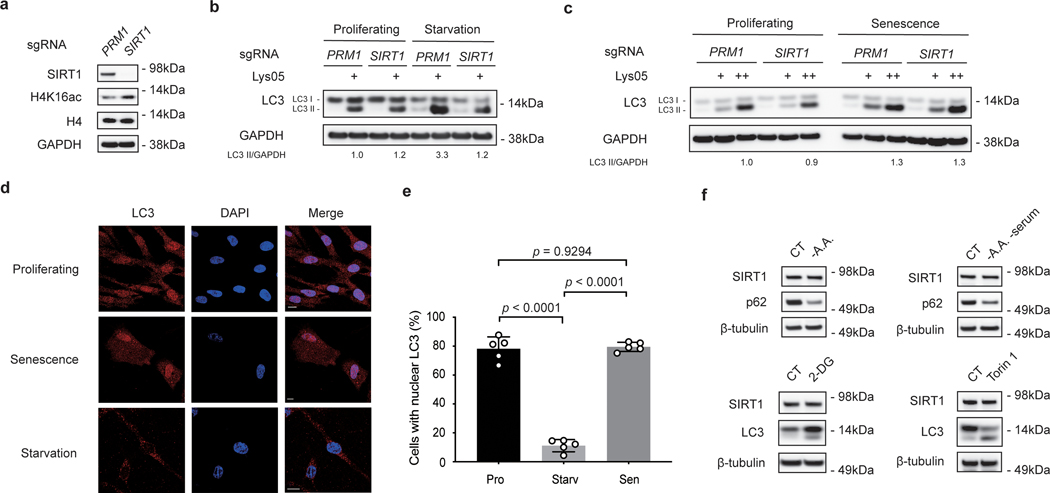
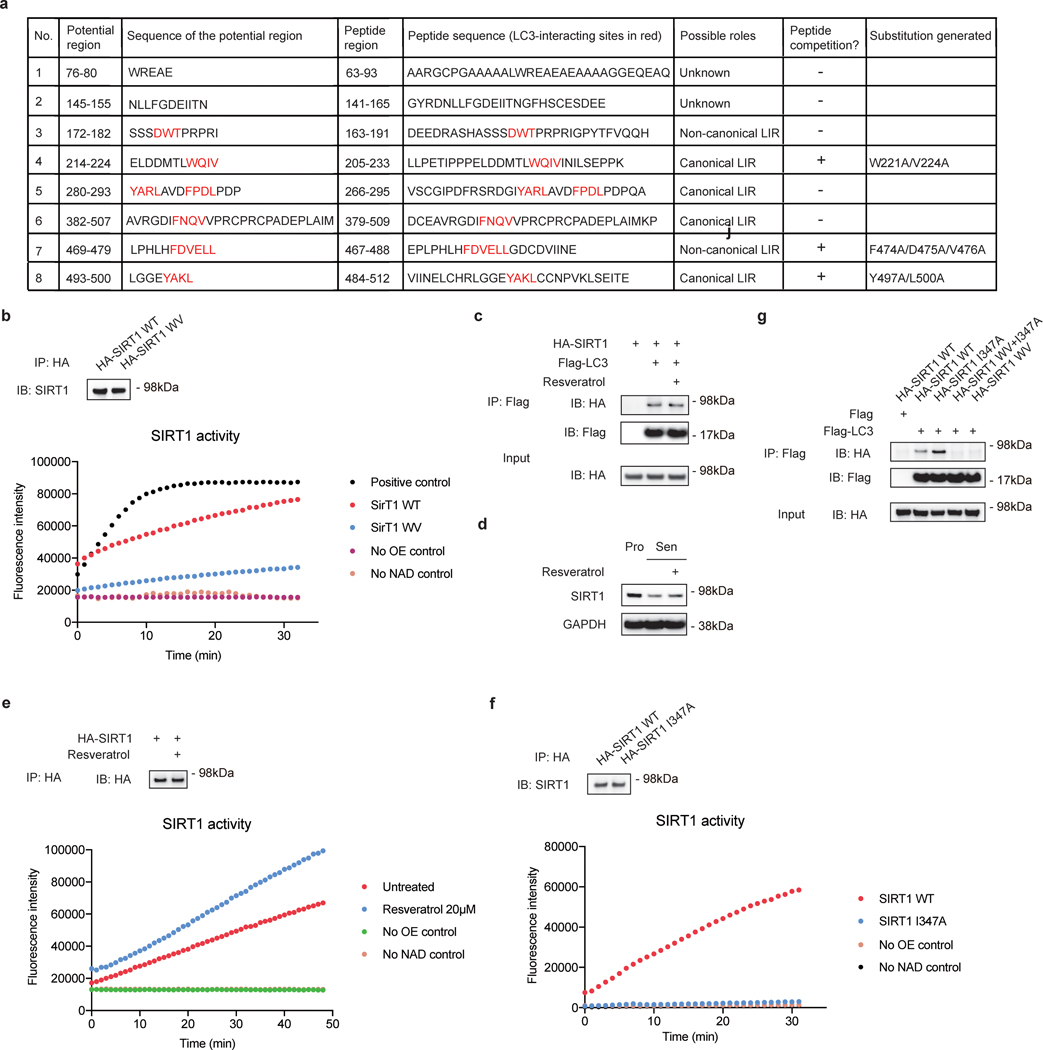
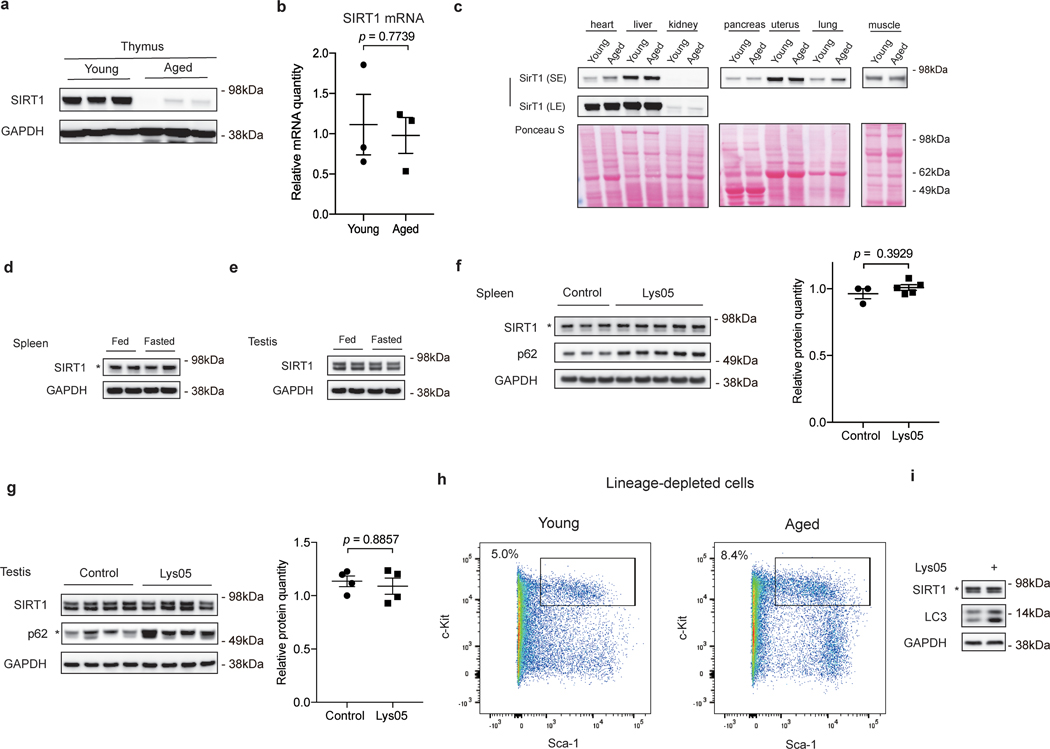
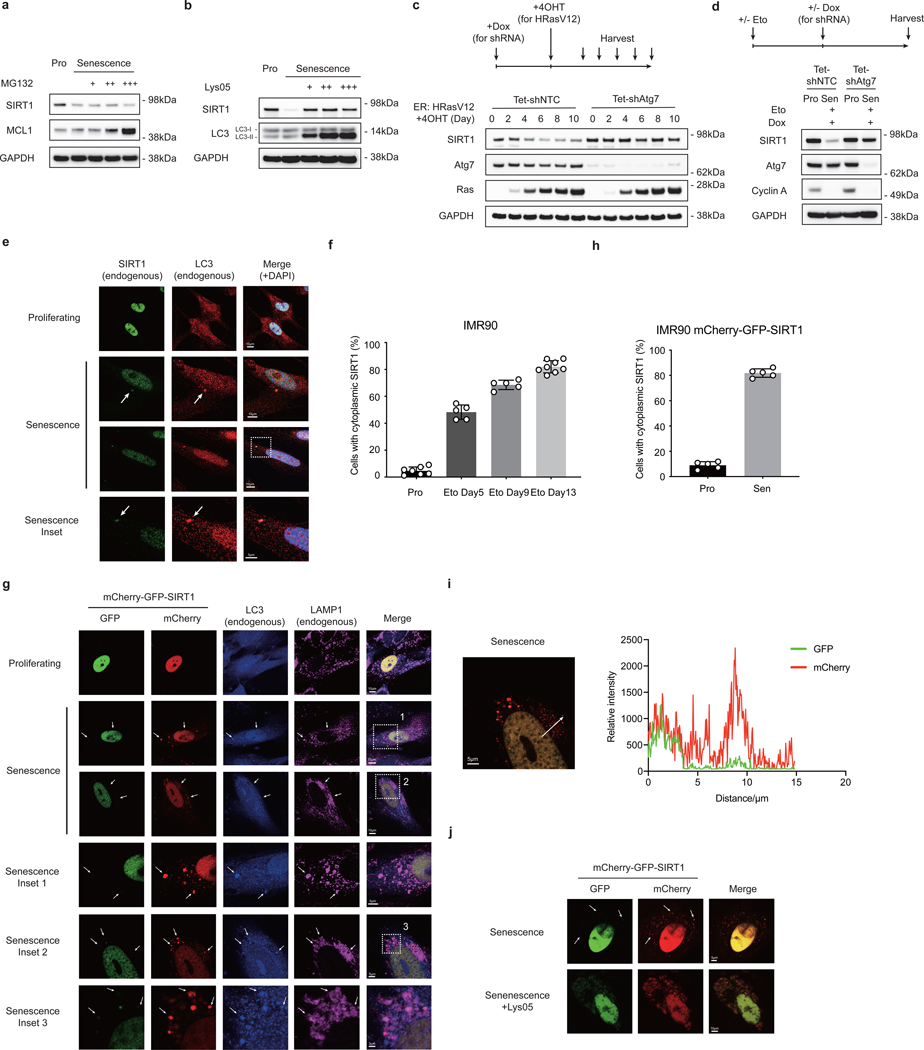
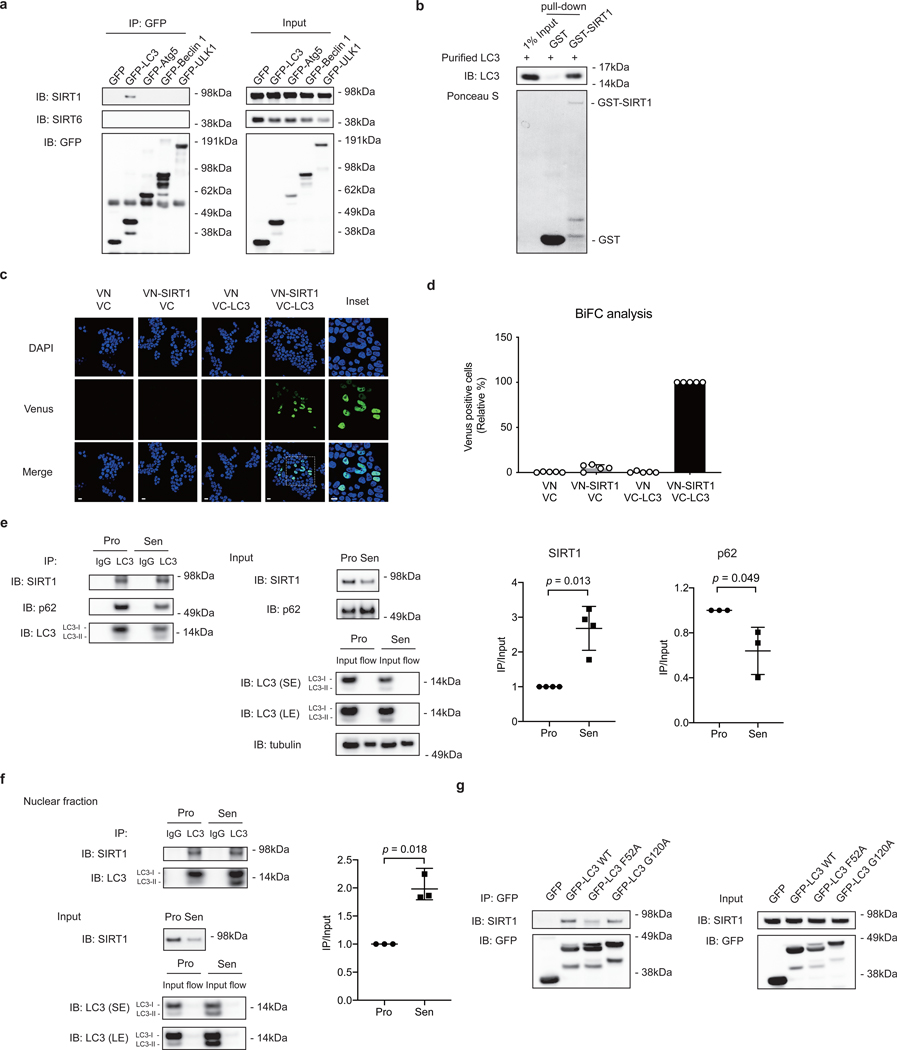
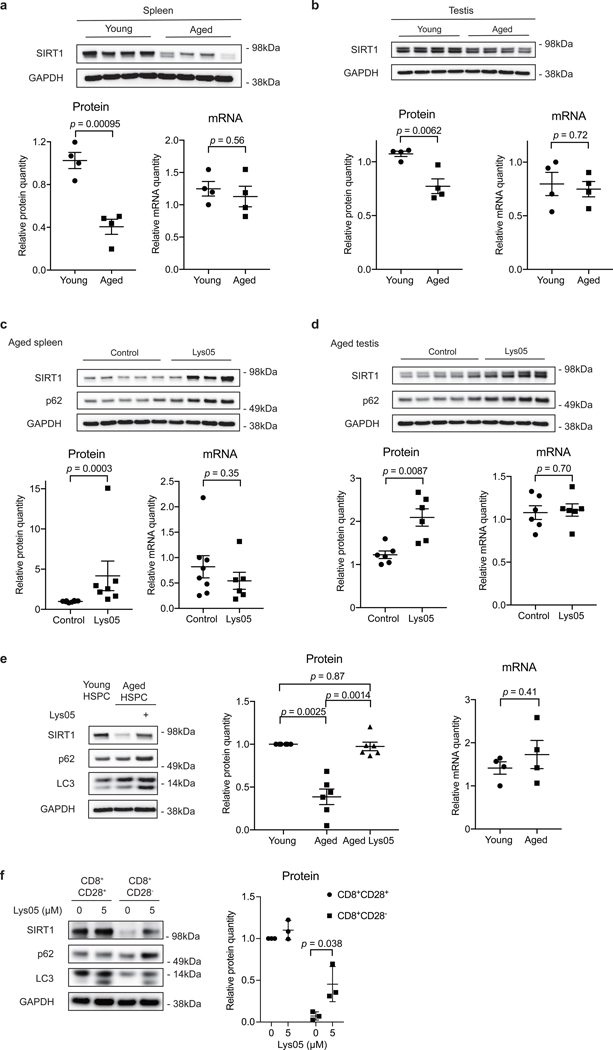
SIRT1 (Sir2) is an NAD+-dependent deacetylase that plays critical roles in a broad range of biological events, including metabolism, the immune response and ageing1-5. Although there is strong interest in stimulating SIRT1 catalytic activity, the homeostasis of SIRT1 at the protein level is poorly understood. Here we report that macroautophagy (hereafter referred to as autophagy), a catabolic membrane trafficking pathway that degrades cellular components through autophagosomes and lysosomes, mediates the downregulation of mammalian SIRT1 protein during senescence and in vivo ageing. In senescence, nuclear SIRT1 is recognized as an autophagy substrate and is subjected to cytoplasmic autophagosome-lysosome degradation, via the autophagy protein LC3. Importantly, the autophagy-lysosome pathway contributes to the loss of SIRT1 during ageing of several tissues related to the immune and haematopoietic system in mice, including the spleen, thymus, and haematopoietic stem and progenitor cells, as well as in CD8+CD28- T cells from aged human donors. Our study reveals a mechanism in the regulation of the protein homeostasis of SIRT1 and suggests a potential strategy to stabilize SIRT1 to promote productive ageing.


Figures

Extended Data Fig. 1
Extended Data Fig. 1. Characterization of SIRT1 role and mRNA levels in cellular senescence.
a, Western blot showing SIRT1 expression in IMR90 cells stably expressing LPC vector or LPC-HA-SIRT1 construct; n = 3 independent experiments. b, β-gal-stained cells at day 9 post etoposide treatment were imaged by microscopy; n = 2 independent experiments. OE: overexpression. c, Percentages of β-gal staining-positive cells were quantified at indicated days after etoposide treatment. Data are mean ± s.d.; more than 500 cells and 5 fields were counted; two-way ANOVA with Sidak’s multiple comparisons test (p values). d, Western blot showing SIRT1 expression in primary BJ fibroblasts treated with 100 μM etoposide for 48 hrs in time course as indicated; n = 2 independent experiments. e, Western blot showing SIRT1 expression in IMR90 cells cultured at 100% confluency for indicated days; n = 2 independent experiments. f-i, RT-qPCR time course analysis of proliferating and senescent IMR90 cells induced by overexpressing ER:HRasV12 treated with 4OHT (f), by etoposide for 48 hrs (g) and BJ cells treated with etoposide for 48 hrs (h), and in IMR90 replicative senescent cells (i). Data were normalized to GAPDH; the bar indicates the average of three technical replicates. PD, population doubling. j, SIRT1 deacetylation activity assay of endogenous SIRT1 protein immunoprecipitated from extracts of proliferating or senescent IMR90 cells expressing inducible hairpins of shNTC and shAtg7. For senescent cells, cells were induced by Dox for 5 days, and then were subjected to etoposide treatment for 48hrs; Cells at Day 8 after etoposide treatment were harvested for analysis. For proliferating cells, cells were induced by Dox for 5 days and then were harvested for analysis. Proteins loaded were analyzed by western blotting. This experiment has been repeated for two times. Statistical information and unprocessed blots are provided as source data.
Extended Data Fig. 2
Extended Data Fig. 2. Characterization of SIRT1-LC3 interaction.
a, IP of extracts from proliferating and senescent IMR90 cells. Quantification: SIRT1 IP bands were normalized to LC3 IP and SIRT1 input bands. Mean ± s.d.; n = 6 independent experiments; paired two-tailed Students’ t-test. b, IP of extracts from proliferating and contact-inhibited IMR90 cells (at 100% confluency for 8 days). This experiment has been repeated once. Excessive beads and antibodies were used in the IP to capture nearly 100% of LC3 protein in the lysates. Flow: flow-through. c, IP of extracts from proliferating and contact-inhibited cells; n = 3 independent experiments. d, IP of nuclear extracts from proliferating and senescent cells. Excessive beads and antibodies were used to capture nearly 100% of LC3 protein in the lysates. This experiment has been repeated once. Flow: flow-through. e, IP of nuclear extracts from proliferating and senescent cells; n = 2 independent experiments. In a,d,e, senescent cells were harvested at day 8 after etoposide treatment. f, Western blotting of nuclear (Nuclear) and cytoplasmic (Cyto) extracts from proliferating and senescent cells; n = 2 independent experiments. g, Endogenous LC3 IP of IMR90 cell extracts with or without protein phosphatase Lambda treatment. Quantification: SIRT1 IP bands were normalized to LC3 IP and SIRT1 input bands. Mean ± s.d.; paired one-tailed Students’ t-test; n = 5 independent experiments. h-i, Mass spectrometry analysis of SIRT1 immunoprecipitated from proliferating and senescent IMR90 cells. h, Boxplot showing the peptide intensity distribution of SIRT1. N = 54 peptides; p value = 0.25; unpaired two-tailed Student’s t-test. The median of the data was indicated as the line in the box, and edges stand for the 25th/75th percentile. i, Phosphorylated peptides identified by mass spec and their phosphorylation levels in proliferating and senescence states. AA: amino acid. Source data are provided.
Extended Data Fig. 3
Extended Data Fig. 3. Characterization of SIRT1 deacetylation role in starvation and senescence.
a-c, IMR90 cells that undergo CRISPR/Cas9-mediated gene inactivation of non-targeting control (PRM1, as PRM1 is involved in spermatogenesis and is not expressed in IMR90 cells) or SIRT1 were analyzed under starvation and senescence conditions. This experiment has been repeated for two times. a, Cells were analyzed by western blotting. b, Cells were subjected to 250 μM Torin 1 and 5 μM Lys05 treatment for 24 hrs, and analyzed by western blotting. Relative LC3-II intensities to GAPDH were quantified. c, Cells at day 6 after etoposide-treated senescence were subjected to 2 μM or 5 μM Lys05 treatments for 24 hrs, and analyzed by western blotting. Relative LC3-II intensities to GAPDH were quantified. d-e, IMR90 cells under proliferating, starvation (Torin 1 250 μM for 24 hrs) and senescence (induced by etoposide treatment, harvested at day 7) conditions were stained with LC3 antibody and analyzed. d, Cells were imaged by confocal microscopy. Scale bar: 10 μm. e, Percentages of cells with nuclear LC3 signals were quantified. Starv: starvation. Mean ± s.d.; more than 500 cells were counted; each data point (n) represents cells in 10 random fields, n = 5 for all conditions; one-way ANOVA coupled with Turkey’s multiple comparisons test. f, IMR90 were treated as indicated ways for 24 hrs and analyzed by western blotting; n = 2 independent experiments. CT: control. A.A.: amino acids. 2-DG: treatment of 10 mM 2-DG. Torin 1: treatment of 250 μM Torin 1. Statistical information and unprocessed blots are provided as source data.
Extended Data Fig. 4
Extended Data Fig. 4. Characterization of SIRT1 mutants and peptides.
a, Information of potential SIRT1-LC3 interaction regions identified in the peptide array as in Fig. 4a, and the corresponding synthetic peptides and mutants. Key amino acid residues are labeled in red. Potential region: LC3-binding regions on SIRT1 identified in the peptide array as in Fig. 4a. Peptide region: synthetic peptides tested in the peptide competition IP as in Fig. 4b. Peptide competition: results of the peptide competition IP as in Fig. 4b. Substitution generated: SIRT1 mutants tested in the IP as in Fig. 4c. b, SIRT1 deacetylation activity assay of SIRT1 WT or WV mutant immunoprecipitated from extracts of HEK293T expressing corresponding HA-tagged constructs. Proteins loaded were analyzed by western blotting. This experiment has been repeated for two times. c, IP of HEK293T cells expressing HA-SIRT1 and Flag-LC3 constructs; n = 2 independent experiments. Cells were pre-treated with 20 μM resveratrol for 6 hrs. d, IMR90 cells at day 6 after etoposide-initiated senescence were subjected to treatment with 20 μM resveratrol for 48 hrs; n = 2 independent experiments. Cells were then harvested for western blotting. e, HEK293T cells expressing HA-SIRT1 and Flag-LC3 were treated with 20 μM resveratrol for 6 hrs, and were then harvested for SIRT1 activity assay. This experiment has been repeated for two times. f, SIRT1 deacetylation activity assay of SIRT1 WT or I347A mutant immunoprecipitated from extracts of HEK293T expressing corresponding HA-tagged constructs. Proteins loaded were analyzed by western blotting; n = 2 independent experiments. g, IP of HEK293T cell lysates expressing Flag-tagged LC3 and HA-tagged SIRT1 WT or I347A, WV+I347A, or WV mutants. This experiment has been repeated for two times. Statistical information and unprocessed blots are provided as source data.
Extended Data Fig. 5
Extended Data Fig. 5. Analysis of SIRT1 in mouse tissues and HSPCs.
a,b, Thymus from young (2–4 months) and aged (19–26 months) C57BL/6 mice were lysed and analyzed by western blotting (a) and RT-qPCR (b); n = 3 biologically independent animals in each group. RT-qPCR data were normalized to 18S; mean ± s.e.m.; unpaired two-tailed Students’ t-test. c. Indicated organs and tissues of young (3 months) and aged (19 months) mice were dissected and analyzed by western blotting; n = 2 independent experiments. SE: short exposure; LE: long exposure. d,e, Young (3 months) mice were fed or fasted for 24 hrs. Spleens (d) and Testes (e) were harvested for western blotting; n = 2 biologically independent animals in each group. f,g, Young (2–4 months) mice were subjected to daily i.p. injection of 10 mg/kg Lys05 in PBS or PBS control in 100 μL volume for two weeks. Spleens (f) and testes (g) were analyzed by western blotting. Western blot quantification: SIRT1 bands were normalized to GAPDH bands. For spleens, data are mean ± s.e.m.; control group n = 3 animals, Lys05 group n = 5 animals; two-tailed Mann-Whitney test. For testes, data are mean ± s.e.m.; n = 4 animals; two-tailed Mann-Whitney test. h, Representative flow cytometry plots of cell sorting of lineage-depleted bone marrow cells from young and aged mice to isolate Lin-Sca-1+c-Kit+ cells (HSPC populations). Boxes indicate cell populations isolated. i, HSPC populations were isolated from young (2–4 months) mice, cultured with or without 2 μM Lys05 for 24 hours and analyzed by western blotting. This experiment has been repeated once. Statistical information and unprocessed blots are provided as source data.
Figure 1.
Figure 1.. SIRT1 protein is reduced during cellular senescence.
a, Western blot showing SIRT1 expression in primary IMR90 fibroblasts with indicated population doublings; n = 2 independent experiments. PD: population doubling. b, Western blot showing SIRT expression in IMR90 cells stably expressing ER:HRasV12. Days of 4-hydroxytamoxifen (4OHT) induction are indicated; n = 2 independent experiments. Asterisk indicates SIRT1 band. c, Western blot showing SIRT1 expression in DNA damage-induced senescent cells. Cells were treated 100 μM etoposide for 48 hrs, harvested at indicated days after treatment; n = 2 independent experiments. d,e, Gene expression level of SIRT1 and CDKN2A in proliferating (Pro) and in oncogene-induced senescence (OIS) condition (d) and replicative senescence (RS) condition (e). FPKM: fragments per kilobase million. In d,e, mRNA levels are normalized against ACTB; unpaired two-tailed Students’ t-test; data are mean ± s.d.; n=3 biologically independent samples. Statistical information and unprocessed blots are provided as source data.
Figure 2.
Figure 2.. SIRT1 is subjected to autophagosome-lysosome degradation during cellular senescence.
a,b, Western blot showing SIRT expression in proliferating (Pro) and DNA-damage induced senescent IMR90 cells (day 6 after etoposide treatment) treated with MG132 (a) and Lys05 (b). MG132 were added at 0.125, 0.25 and 0.5 μM for 48 hrs. The proteasomal substrate MCL1 serves as control showing the effects of MG132. Lys05 were added at 2, 3 and 5 μM for 48 hrs. c,d, Western blot showing changes of SIRT1 expression in IMR90 expressing inducible hairpins of non-targeting control (shNTC) and shAtg7, in response to OIS induced by 4-hydroxytamoxifen (4OHT) for indicated days (c) and after the establishment of senescence induced by etoposide (d). Doxycycline (Dox) was added on day 4 after treatment of etoposide (d). In c,d, hairpin expression was induced by Dox treatment for 5 days; Sen: senescence. In a-d, each experiment has been repeated for two times. e,f, Confocal microscopy analysis of cytoplasmic SIRT1 in proliferating and senescent IMR90 at day 9 after etoposide treatment (e) and quantification of the percentage of cells with cytoplasmic SIRT1 puncta (f). Arrows indicate co-localization of cytoplasmic SIRT1 puncta and LC3. Eto: etoposide. g,h, Confocal microscopy analysis of IMR90 stably expressing mCherry-GFP-SIRT1 under proliferating and at day 14 after etoposide treatment (g) and quantification of the percentage of cells with cytoplasmic mCherry signals (h). Cells were co-stained with LC3 and LAMP1 antibodies. In f,h, data are mean ± s.d.; more than 500 cells; each data point (n) represents cells in 10 random fields, n = 7, 5, 5, 8 for respective conditions (f) and n = 5 for all conditions (h). i. Relative intensities of mCherry and GFP signals of a typical senescent cell as in (g) were quantified by LAS X Core software. In g-i, each experiment has been repeated for two times. j, Confocal microscopy analysis of senescent cells (etoposide) stably expressing mCherry-GFP-SIRT1 with and without Lys05 treatment. On day 6 after etoposide treatment, cells were treated with 5 μM Lys05 for 48 hrs; n=2 independent experiments. In g, j, arrows indicate cytoplasmic SIRT1 puncta with strong mCherry signals and fading GFP signals. Source Data are provided.
Figure 3.
Figure 3.. SIRT1 associates with autophagy protein LC3.
a, IP of extracts from HEK293T cells expressing GFP-tagged constructs; n = 2 independent experiments. b, GST-SIRT1 pull-down of bacteria-expressed and purified LC3 protein; n = 2 independent experiments. c,d, BiFC analysis of SIRT1-LC3 interaction. HEK293T cells were transfected with indicated combinations of constructs. c, Cells were imaged by confocal microscopy; This experiment has been repeated for 3 times. Scale bar: 15 μm. d, Relative percentage of Venus-positive cells were quantified and normalized to VN-SIRT1+VC-LC3 condition (as 100%). Mean ± s.d.; more than 500 cells and n = 5 random fields. e, IP of extracts from proliferating and senescent IMR90 cells. Senescent cells were harvested for IP at day 8 after etoposide treatment. Excessive beads and antibodies were used in the IP to capture nearly 100% of LC3 protein in the lysates. Flow: flow-through. Western blot quantification: SIRT1 or p62 IP bands were normalized to LC3 IP and SIRT1 or p62 input bands. Mean ± s.d.; n = 3 independent experiments; paired two-tailed Students’ t-test. f, IP of nuclear extracts from proliferating and senescent IMR90 cells. Senescent cells were harvested for IP at day 8 after etoposide treatment. Excessive beads and antibodies were used in the IP to capture nearly 100% of LC3 protein in the lysates. Flow: flow-through. Western blot quantification: SIRT1 IP bands were normalized to LC3 IP and SIRT1 input bands. Mean ± s.d.; n = 3 independent experiments; paired two-tailed Students’ t-test. g, IP of HEK293T cells expressing GFP-tagged LC3 wild type (WT) or mutant constructs; n = 2 independent experiments. Statistical information and unprocessed blots are provided as source data.
Figure 4.
Figure 4.. SIRT1 interacts with LC3 through a LIR motif.
a, SIRT1 peptide array showing potential interaction regions with LC3. 20-mer peptides covering full-length SIRT1 with a moving window of 3 residues were synthesized and incubated on a cellulose membrane. The array was probed with GST-LC3B. Eight potential regions for LC3 binding were boxed and numbered. b, IP of HEK293T cells expressing HA-tagged SIRT1 and Flag-tagged LC3, with addition of DMSO or 500 μM synthetic SIRT1 peptides as indicated; n = 3 independent experiments. c, IP of HEK293T cells expressing HA-tagged SIRT1 WT, W221A/V224A (WV), F474A/D475A/V476A or Y497A/L500A substitutions; n = 2 independent experiments. d, IP of HEK293T cells expressing Flag-tagged LC3 and HA-tagged SIRT1 WT, WV or E214A/D216A/D217A (EDD) mutants; n = 2 independent experiments. e, Scheme of SIRT1 showing the location of the 205–233 peptide. Potential amino acid residues involved in LC3 binding are labeled in red, including the core LIR motif WQIV. Location of 205–233 peptide is labeled in blue; locations of other peptides tested are labeled in grey. f, IP of HEK293T cells expressing HA-tagged SIRT1 and Flag-tagged LC3, with addition of DMSO or 500 μM synthetic SIRT1 peptides as indicated; n = 2 independent experiments. g, IMR90 cells stably expressing HA-tagged SIRT1 I347A or WV+I347A mutants were infected with HRasV12 retrovirus, selected by antibiotics and harvested at indicated days for western blotting; n = 2 independent experiments. h-i, Senescent IMR90 cells expressing mCherry-GFP-SIRT1 I347A or WV+I347A mutants were analyzed. Senescence was initiated by etoposide treatment for indicated days. h, Cells at day 7 after etoposide treatment were imaged by confocal microscopy. Scale bar: 5 μm. i, Percentages of cells with cytoplasmic SIRT1 puncta were quantified. Data are mean ± s.d.; more than 500 cells were counted; each data point (n) represents cells in 10 random fields, n = 5 for all conditions; two-way ANOVA with Sidak’s multiple comparisons test. Statistical information and unprocessed blots are provided as source data.
Figure 5.
Figure 5.. SIRT1 undergoes lysosomal degradation during aging in mouse and human.
a,b, Spleens (a) and testes (b) from young (2–4 months) and aged (19–26 months) C57BL/6 mice were analyzed by western blotting and RT-qPCR. Data are mean ± s.e.m.; unpaired two-tailed Students’ t-test; n = 4 animals. c,d, Spleens (c) and testes (d) were analyzed by western blotting and RT-qPCR for SIRT1 expression, from aged (19–24 months) mice subjected to daily i.p. injection of 10 mg/kg Lys05 in PBS or PBS control in 100 μL volume for two weeks. Data are mean ± s.e.m.; two-tailed Mann-Whitney test. For spleen protein, control group n = 8 animals, Lys05 group n = 7 animals; RNA, control group n = 8 animals, Lys05 group n = 6 animals. For testis protein and RNA, control group n=6 animals, Lys05 group n=6 animals. e.HSPC populations were isolated from young (2–4 months) and aged (20–26 months) C57BL/6 mice, cultured with or without 2 μM Lys05 for 24 hours and analyzed by western blotting and RT-qPCR. For protein, data are mean ± s.e.m.; one-way ANOVA coupled with Tukey’s test; n=6 independent experiments. For RNA, data are mean ± s.e.m.; unpaired two-tailed Students’ t-test; n=4 independent experiments. f. Freshly sorted CD8+CD28+ (control) and CD8+CD28- T cells were treated with Lys05 at doses of 0 and 5 μM for 14 hours, and then were harvested and analyzed by western blotting. Donor age: 53, 54 and 66. Data are mean ± s.d.; unpaired two-tailed Students’ t-test; n = 3 human donors. In a-f, western blot quantification: SIRT1 bands were normalized to GAPDH bands, for testes both bands of SIRT1 were considered. In a-e, RT-qPCR quantification: data were normalized to 18S. Statistical information and unprocessed blots are provided as source data.

Comment in

  • Autophagy goes nuclear.
    Tan JX, Finkel T. Tan JX, et al. Nat Cell Biol. 2020 Oct;22(10):1159-1161. doi: 10.1038/s41556-020-00587-5. Nat Cell Biol. 2020. PMID: 32989248 No abstract available.

Similar articles

Cited by

References

    1. Hall JA, Dominy JE, Lee Y & Puigserver P. The sirtuin family’s role in aging and age-associated pathologies. J Clin Invest 123, 973–979 (2013). - PMC - PubMed
    1. Haigis MC & Sinclair DA Mammalian sirtuins: biological insights and disease relevance. Annu Rev Pathol 5, 253–295 (2010). - PMC - PubMed
    1. Lin SJ, Defossez PA & Guarente L. Requirement of NAD and SIR2 for lifespan extension by calorie restriction in Saccharomyces cerevisiae. Science 289, 2126–2128 (2000). - PubMed
    1. Tissenbaum HA & Guarente L. Increased dosage of a sir-2 gene extends lifespan in Caenorhabditis elegans. Nature 410, 227–230 (2001). - PubMed
    1. Rogina B & Helfand SL Sir2 mediates longevity in the fly through a pathway related to calorie restriction. Proc Natl Acad Sci U S A 101, 15998–16003 (2004). - PMC - PubMed

Publication types

MeSH terms