. 2020 Nov;39(45):6920-6934.
doi: 10.1038/s41388-020-01469-8. Epub 2020 Sep 28.

Increased baseline RASGRP1 signals enhance stem cell fitness during native hematopoiesis

Affiliations

Increased baseline RASGRP1 signals enhance stem cell fitness during native hematopoiesis

Laila Karra et al. Oncogene. 2020 Nov.

Abstract

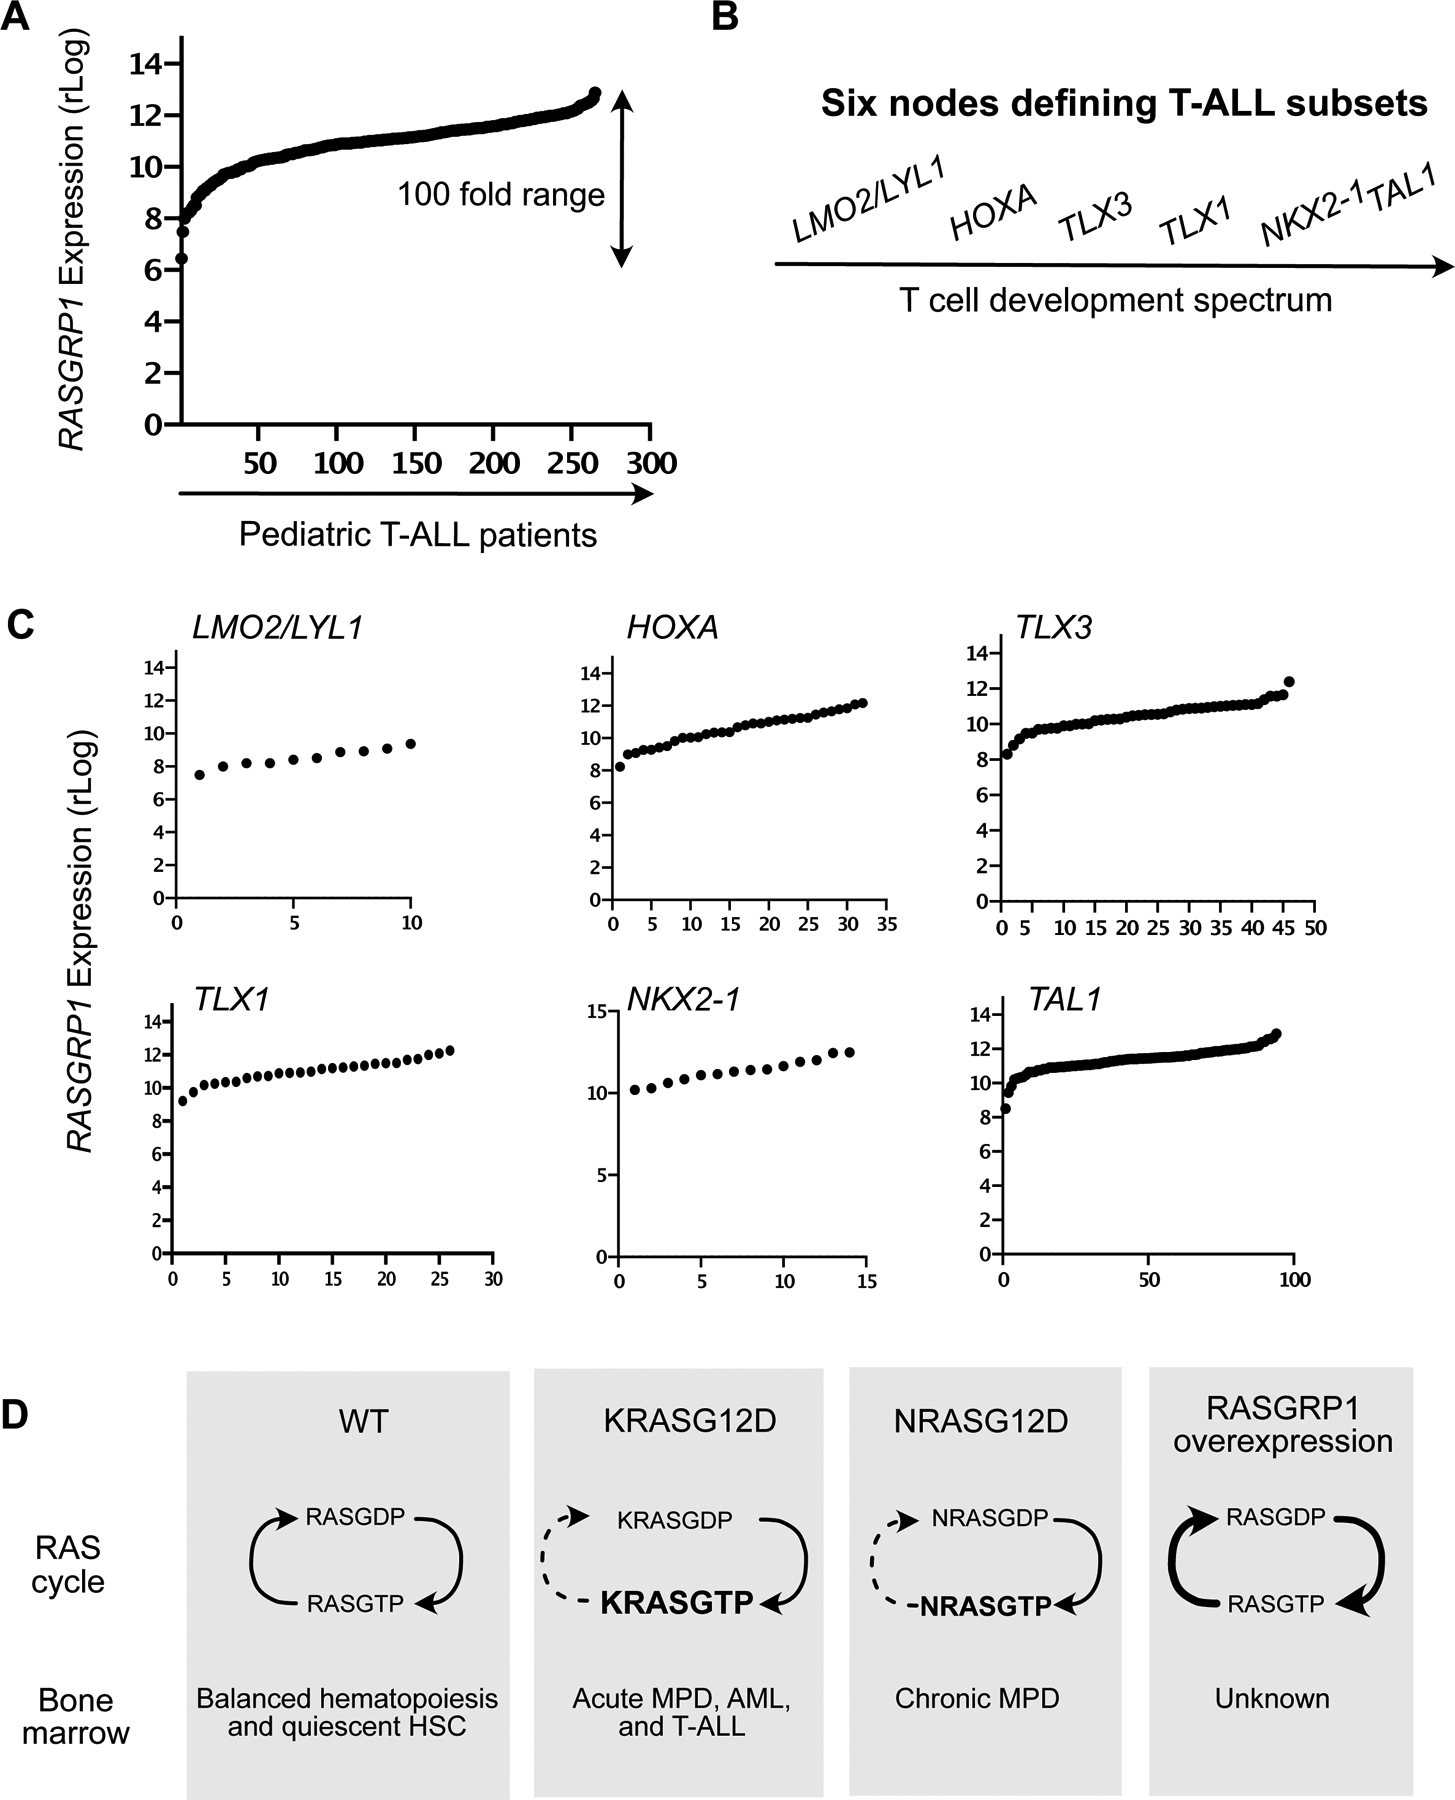
Oncogenic mutations in RAS genes, like KRASG12D or NRASG12D, trap Ras in the active state and cause myeloproliferative disorder and T cell leukemia (T-ALL) when induced in the bone marrow via Mx1CRE. The RAS exchange factor RASGRP1 is frequently overexpressed in T-ALL patients. In T-ALL cell lines overexpression of RASGRP1 increases flux through the RASGTP/RasGDP cycle. Here we expanded RASGRP1 expression surveys in pediatric T-ALL and generated a RoLoRiG mouse model crossed to Mx1CRE to determine the consequences of induced RASGRP1 overexpression in primary hematopoietic cells. RASGRP1-overexpressing, GFP-positive cells outcompeted wild type cells and dominated the peripheral blood compartment over time. RASGRP1 overexpression bestows gain-of-function colony formation properties to bone marrow progenitors in medium containing limited growth factors. RASGRP1 overexpression enhances baseline mTOR-S6 signaling in the bone marrow, but not in vitro cytokine-induced signals. In agreement with these mechanistic findings, hRASGRP1-ires-EGFP enhances fitness of stem- and progenitor- cells, but only in the context of native hematopoiesis. RASGRP1 overexpression is distinct from KRASG12D or NRASG12D, does not cause acute leukemia on its own, and leukemia virus insertion frequencies predict that RASGRP1 overexpression can effectively cooperate with lesions in many other genes to cause acute T-ALL.


Conflict of interest statement

Conflict of interest disclosure

Jeroen Roose is a co-founder and scientific advisor of Seal Biosciences, Inc. and on the scientific advisory committee for the Mark Foundation for Cancer Research. C.G.M. receives research funding from Loxo Oncology, Abbvie, and Pfizer, and speaking fees from Amgen.

Figures

Figure 1:
Figure 1:. T-ALL patient analysis and mouse models.
(A) Regularized log (rLog, normalized by DESeq2 R package) gene expression values of RASGRP1 expression in 264 pediatric T-ALL patients. (B) Schematic of six subtypes in T-ALL. (C) rLog values of RASGRP1 expression, plotted in the distinct LMO2/LYL1-, HOXA-, TLX3-, TLX1-, NKX2–1-, and TAL1- nodes. (D) Schematic representation of possible signaling networks in the BM of normal, oncogenic KrasG12D and hRASGRP1 overexpressing mice.
Figure 2:
Figure 2:. In vivo accumulation of hRASGRP1-overexpressing cells in RoLoRiG mouse model
(A) Schematic representation of the RoLoRiG model with overexpression of hRASGRP1-ires-EGFP. hRASGRP1 stands for human RASGRP1. hRASGRP1-ires-EGFP construct was knocked into the Rosa26 locus. A stop codon is flanked by LoxP sites, which is excised when CRE recombinase is induced by injection of polyinosinic-polycytidylic acid (pIpC). (B) Representative Western Blot showing expression of hRASGRP1 detected with a human-specific monoclonal antibody in lymph node protein lysates of RoLoRiG+/+ Mx1CRE+ mice, three months following pIpC injection. The Jurkat T-cell line was used as a positive control for hRASGRP1, TBP as loading control. (C) Percentages of GFP+ cells in peripheral blood of RoLoRiG+/+ Mx1CRE+ mice on days 21, 62, and 94 after pIpC injection. Data are presented as mean ± SEM. Each symbol represents a single mouse in all figures (n>4 in Figure 2C). (D, E, F) GFP+ cells within of T-, myeloid-, and B- cells in RoLoRiG+/+Mx1CRE+ mice with or without pIpC injection on days 21, 62 and 94. (G) Splenic weights from RoLoRiG+/+Mx1CRE- and RoLoRiG+/+Mx1CRE+ mice (n>7). Figures 2G–2J are at 94 days post pIpC injection. (H) Percentage of T-, myeloid-, and B- cells in spleens of RoLoRiG+/+Mx1CRE- and RoLoRiG+/+Mx1CRE+ mice (n=6 or more). Increased percentages of CD11b+ cells were accompanied with decreases in B220+ B cells and CD3+ T cells. (I) Percentages of GFP+ cells in spleens of RoLoRiG+/+Mx1CRE+ mice with or without pIpC injection (n=6 or more). (J) Percentages of GFP+ cells in BM of RoLoRiG+/+Mx1CRE+ mice with or without pIpC injection (n>6).
Figure 3:
Figure 3:. hRASGRP1 overexpression in a bone marrow transfer model.
(A) RoLoRiG+/+Mx1CRE- or RoLoRiG+/+Mx1CRE+ mice were injected with pIpC at 4 weeks of age. BM cells were freshly isolated (7–8 weeks) from donor mice (CD45.2), which were either RoLoRiG+/+Mx1CRE- or RoLoRiG+/+Mx1CRE+. Sorted 10 000 LSK cells were co-injected i.v. with 5×10⁵ carrier cells (CD45.1) into lethally irradiated recipients (CD45.1/CD45.2). Recipient mice were bled every 4 weeks until the final analysis at the endpoint (22 weeks). BM: bone marrow; LSK: LinSca1+c-kit+; PB: Peripheral blood; pIpC: polyinosinic-polycytidylic acid. Data are presented as mean ± SEM of n=2 independent experiments. Congenic alleles allow for accurate enumeration of cell populations that are donor-derived (CD45.2) or are radiation-resistant host cells (CD45.1/CD45.2) (Supplemental Figure S3A). (B) Spleen weight from RoLoRiG+/+Mx1CRE- and RoLoRiG+/+Mx1CRE+ mice at endpoint (n>9). Each dot represents a single mouse. **p<0.01. (C) Percentage of T-, myeloid and B-cells in spleen of RoLoRiG+/+Mx1CRE- and RoLoRiG+/+Mx1CRE+ mice at endpoint (n>9). **p<0.01. (D-G) Analyses of percentages of LSK, PreGM, MEP, GMP and CMP within PreGM, and CLP in the BM. (n=9 or more). For additional subsets, see Supplemental Figure S4.
Figure 4:
Figure 4:. Cytokine-induced bone marrow colony formation and signaling.
(A) 50 000 total BM cells from either RoLoRiG+/+Mx1CRE- or RoLoRiG+/+Mx1CRE+ mice were seeded in cytokine-rich (M3434) medium. Representative images of the different colonies are shown after 7 days of incubation (100 μm Scale bar). Original magnification 10X. CFU: clonogenic forming units. For cytokine-induced signaling assays, cells were sorted, rested, stimulated, and processed for phosphor-antibody staining. (B-C) CFU potential of RoLoRiG+/+Mx1CRE- and RoLoRiG+/+Mx1CRE+ cells grown in cytokine-rich medium (n>15). (B) Clonogenic (CFU) potential of RoLoRiG+/+Mx1CRE- and RoLoRiG+/+Mx1CRE+ cells grown in cytokine-rich medium (n>15). (C) As in Figure 4B but in the presence of inhibitors of Ras kinase effector pathways: GDC0941 (0.1μM), U0126 (5μM) and Rapamycin (0.1μM) (n>3). (D) Analysis of p-STAT3 (Y705) and p-STAT5 (Y694) levels in rested and GM-CSF (40ng/ml) stimulated, sorted CD11B+ cells from RoLoRiG+/+Mx1CRE- and RoLoRiG+/+Mx1CRE+ mice. N = 4 independent experiments. ***p<0.001. Unstimulated RoLoRiG+/+Mx1CRE- samples were arbitrarily set at 100. For isotype control antibody staining see Supplemental Figure S5. (E) As in Figure 4D, assessment of p-AKT (S473), p-ERK (T202/Y204), and p-S6 (S235/S236) levels. N = 4 independent experiments. ***p<0.001, *p<0.05.
Figure 5:
Figure 5:. RasGRP1 overexpression drives spontaneous bone marrow colony formation and S6 signaling.
(A) BM CFU analysis in cytokine-poor (M3231) medium. supplemented with either GM-CSF (GM-CFU) or IL-7 (PreB-CFU). Representative images following 7 days of incubation (100 μm Scale bar). Original magnification 10X. Schematic of baseline signaling assays in whole BM. (B) Clonogenic (CFU) potential of RoLoRiG+/+Mx1CRE- and RoLoRiG+/+Mx1CRE+ cells grown in M3231 with 0.01 ng/ml of GM-CSF and inhibitors: GDC0941 (0.1μM), U0126 (5μM) and Rapamycin (0.1μM) (n>4). (C) Clonogenic (PreB-CFU) potential of RoLoRiG+/+Mx1CRE- and RoLoRiG+/+Mx1CRE+ cells using 0.1, 1 and 10 ng/ml of IL-7 (n>3). (D) Analysis of baseline p-STAT3 (Y705), p-STAT5 (Y694), p-AKT (S473), p-ERK (T202/Y204), and p-S6 (S235/S236) signals in RoLoRiG+/+Mx1CRE- and RoLoRiG+/+Mx1CRE+ total BM, immediately fixed after isolation. Mean fluorescence intensity is depicted by the numerical value. Data is representative of four independent experiments.
Figure 6:
Figure 6:. Increased fitness in Native hematopoiesis in RoLoRiG+/+ mice.
(A) Percentage of LSK in the BM of RoLoRiG+/+Mx1CRE- or RoLoRiG+/+Mx1CRE+ mice (n>18). In panel 6A and all subsequent panels in figure 6, data are presented as mean ± SEM. Each symbol represents a single mouse. *p<0.05, **p<0.01, ***p<0.001. (B-F) Percentage of specific developmental stages in the BM RoLoRiG+/+Mx1CRE- or RoLoRiG+/+Mx1CRE+ mice, analogous to the developmental gating scheme used in Figure 3. (G) Inclusion of the ires-EGFP cassette allows for specific assessment of the GFP+ fraction within each of the hematopoietic subsets within the BM. (H-K) Proportions of GFP+ cells within in RoLoRiG+/+Mx1CRE+ mice with or without pIpC injection. (H. LSK; I. MPP, ST-HSC and LT-HSC cells; J. CLP cells; K. MEP, GMP and CMP cells.
Figure 7:
Figure 7:. Co-insertion table of SL3-3 leukemia virus insertions.
SL3–3 leukemia virus insertions that resulted in T-ALL in mice were mapped against each other to understand the relationship between the top 8 SL3–3 insertion sites.

Similar articles

Cited by

References

    1. Terwilliger T & Abdul-Hay M Acute lymphoblastic leukemia: a comprehensive review and 2017 update. Blood Cancer J 7, e577, doi:10.1038/bcj.2017.53 (2017). - DOI - PMC - PubMed
    1. von Lintig FC, Huvar I, Law P, Diccianni MB, Yu AL & Boss GR Ras activation in normal white blood cells and childhood acute lymphoblastic leukemia. Clin Cancer Res 6, 1804–1810 (2000). - PubMed
    1. Hartzell C, Ksionda O, Lemmens E, Coakley K, Yang M, Dail M et al. Dysregulated RasGRP1 Responds to Cytokine Receptor Input in T Cell Leukemogenesis. Science signaling 6, ra21, doi:10.1126/scisignal.2003848 (2013). - DOI - PMC - PubMed
    1. Ksionda O, Melton AA, Bache J, Tenhagen M, Bakker J, Harvey R et al. RasGRP1 overexpression in T-ALL increases basal nucleotide exchange on Ras rendering the Ras/PI3K/Akt pathway responsive to protumorigenic cytokines. Oncogene 35, 3658–3668, doi:10.1038/onc.2015.431 (2016). - DOI - PMC - PubMed
    1. Jackson EL, Willis N, Mercer K, Bronson RT, Crowley D, Montoya R et al. Analysis of lung tumor initiation and progression using conditional expression of oncogenic K-ras. Genes Dev 15, 3243–3248, doi:10.1101/gad.943001 (2001). - DOI - PMC - PubMed

Publication types

MeSH terms

Substances