. 2020 Nov;23(11):1388-1398.
doi: 10.1038/s41593-020-00712-5. Epub 2020 Sep 28.

Anatomically segregated basal ganglia pathways allow parallel behavioral modulation

Affiliations

Anatomically segregated basal ganglia pathways allow parallel behavioral modulation

Jaeeon Lee et al. Nat Neurosci. 2020 Nov.

Abstract

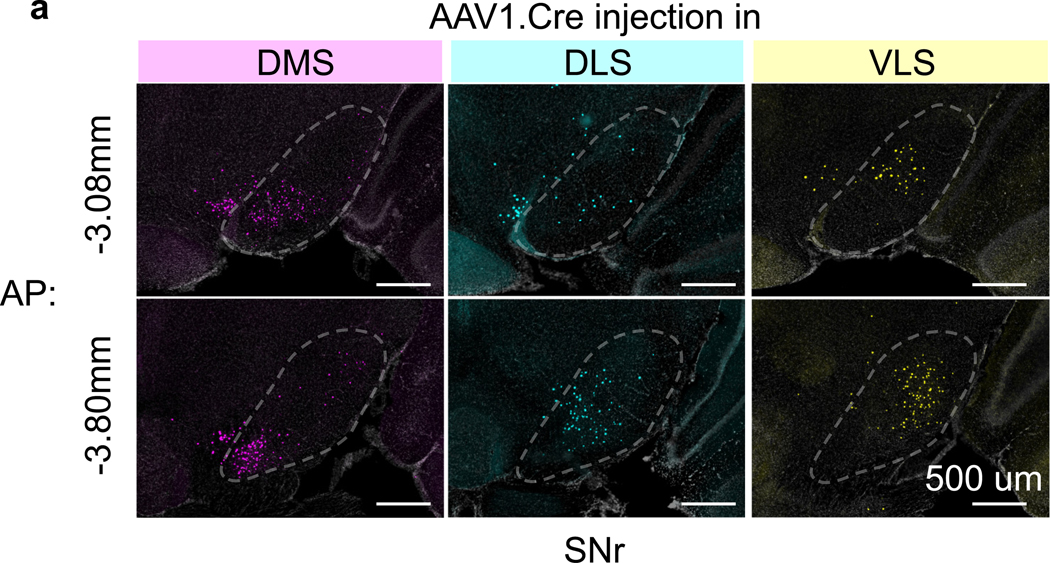
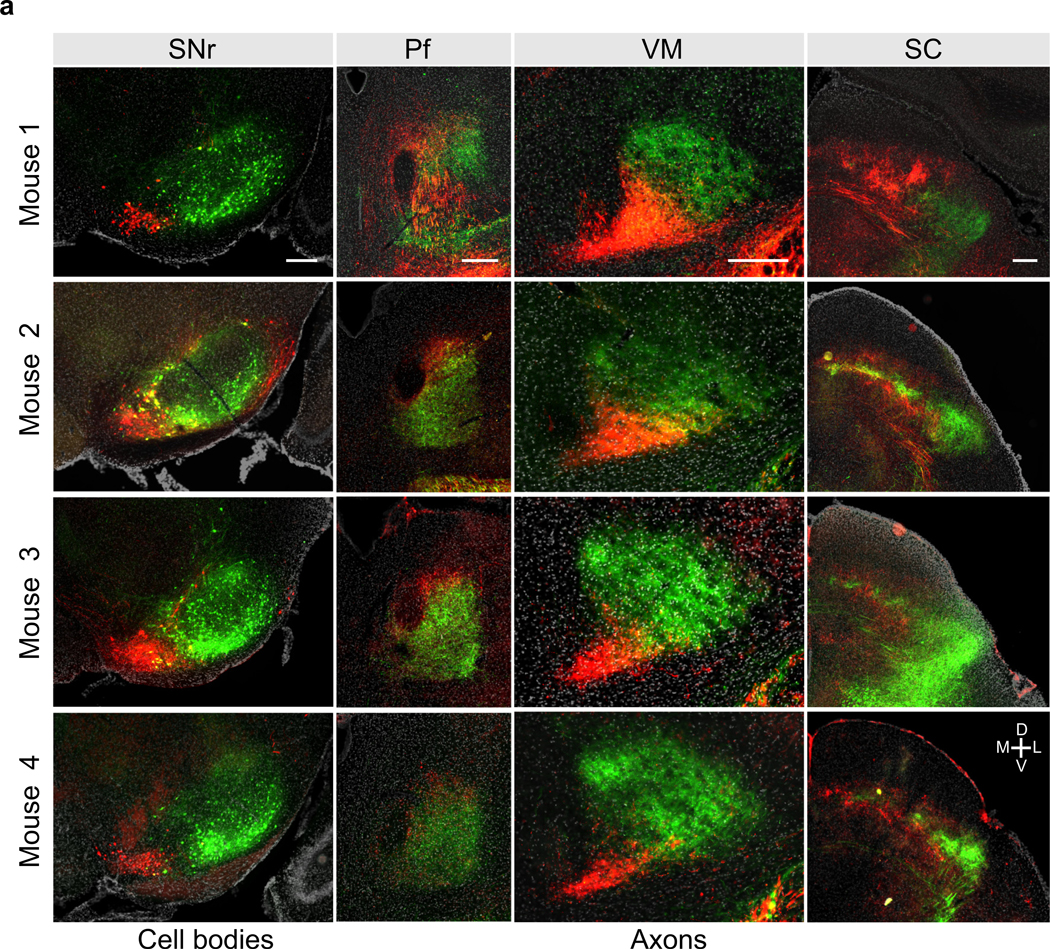
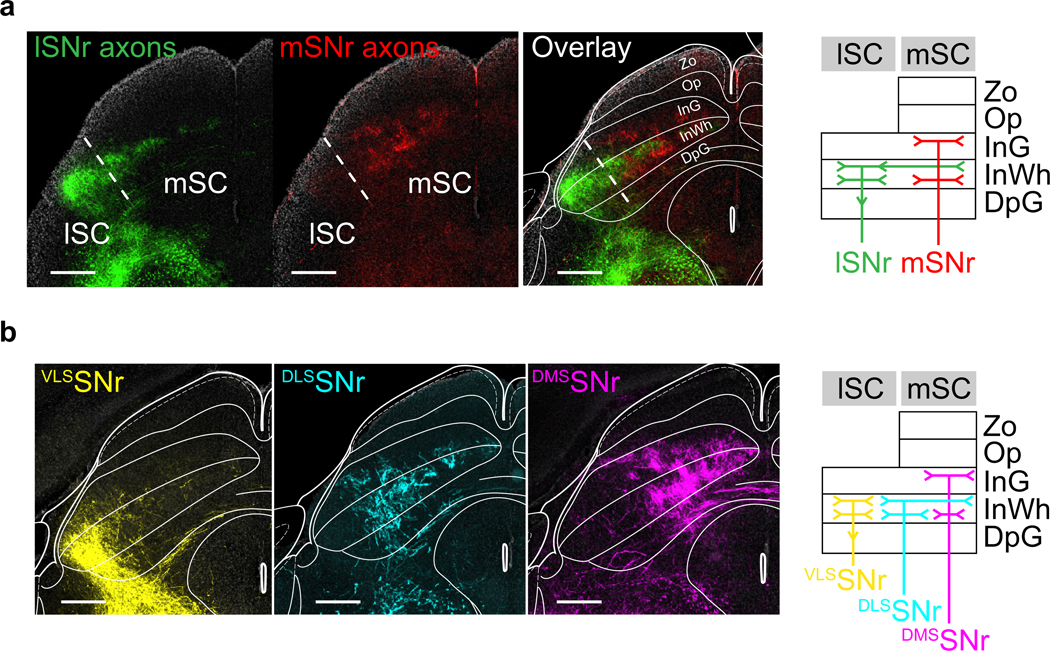
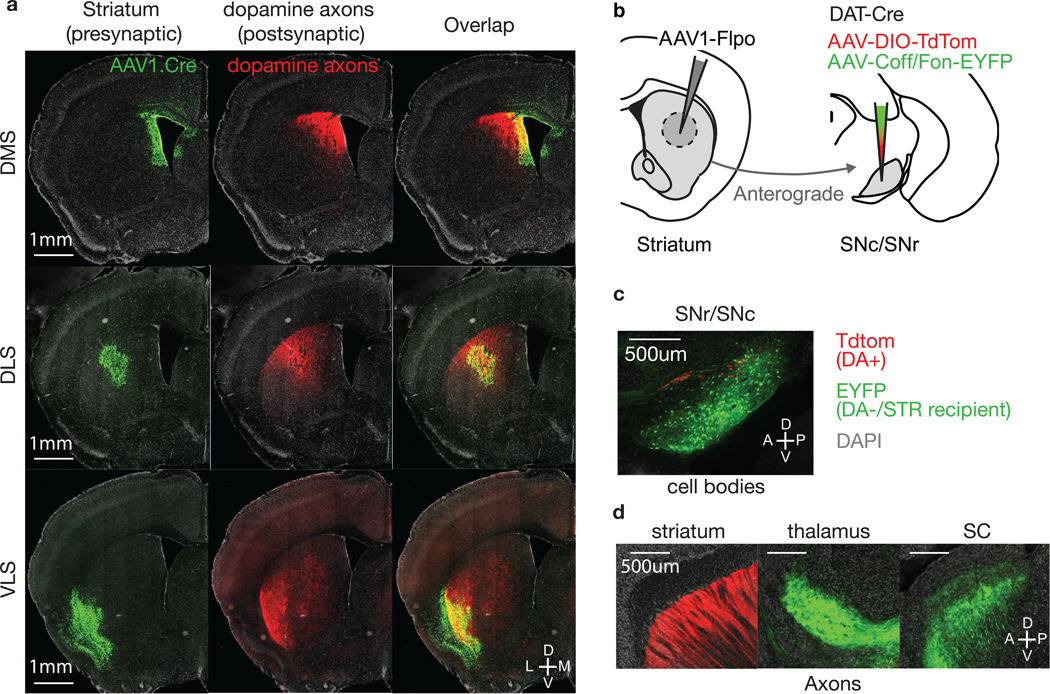
In the basal ganglia (BG), anatomically segregated and topographically organized feedforward circuits are thought to modulate multiple behaviors in parallel. Although topographically arranged BG circuits have been described, the extent to which these relationships are maintained across the BG output nuclei and in downstream targets is unclear. Here, using focal trans-synaptic anterograde tracing, we show that the motor-action-related topographical organization of the striatum is preserved in all BG output nuclei. The topography is also maintained downstream of the BG and in multiple parallel closed loops that provide striatal input. Furthermore, focal activation of two distinct striatal regions induces either licking or turning, consistent with their respective anatomical targets of projection outside of the BG. Our results confirm the parallel model of BG function and suggest that the integration and competition of information relating to different behavior occur largely outside of the BG.


Figures

Extended Data Fig. 1
Extended Data Fig. 1. Topography is maintained across the AP axis of SNr
a). Example histology section in anterior SNr and posterior SNr (see main text and methods for injection protocol). Row represent AP coordinates and each column indicates the location of the AAV1.cre for anterograde tracing (see main text). Scale bar, 500um. Topographical labelling was also observed in anterior part of SNr. Similar results were obtained in n = 9 mice (n = 3 for each site).
Extended Data Fig. 2
Extended Data Fig. 2. EP to LHb projection is topographic
a). Experiment protocol. AAV1-cre and AAV1-Flpo in medial and lateral striatum respectively, followed by a cocktail of viruses encoding either DIO-Tdtom or fDIO-EYFP in EP. b). left, histological sections showing the anterogradely labelled cells from medial (red) and lateral (green) striatum. right, Axonal fibers innervating LHb in a nonoverlapping fashion. Similar results were obtained in n = 2 mice. Scale bar, 1mm, 1mm, 0.1mm from left to right panel.
Extended Data Fig. 3
Extended Data Fig. 3. Topography of SNr output is consistent across mice
a). Histology sections for all injected mice for experiment in Fig. 2c. First row represents column the injection site, and second to fourth column represent axonal fibers in Pf, VM and SC. Each row represents individual mouse. Scale bar, 250um.
Extended Data Fig. 4
Extended Data Fig. 4. SNr output to SC segregated both across medial-lateral axis and across layers
a). left, Example histology section with mSNr axons (red) and lSNr axons (green) from experiment described in Fig 2c. right, Carton diagram summarizing the region and layer specificity of lSNr and mSNr observed. lSNr innervated the lateral SC (abbreviations: Zo: Zona layer of the superior colliculus, Op: optic nerve layer of the superior colliculus, InG: Intermediate gray layer of the superior colliculus, InWh: Intermediate white layer of the superior colliculus, DpG: Deep gray layer of the superior colliculus). lSNr innervated the lSC in InWh, and extending to upper layer of InWh in mSC. mSNr innervated the superfifical part of InG and deeper part of InWh in mSC. Similar results were obtained in n = 4 mice. Scale bar, 500um. b). left, Example histological section with VLSSNr (yellow), DLSSNr (cyan), and DMSSNr (magenta) axons in SC (images reproduced from Fig. 2f). right, Carton diagram summarizing the region and layer specificity of VLSSNr, DLSSNr, and DMSSNr observed. VLSSNr targeted the InWh part of lSC, DLSSNr targeted the central part of SC, extending to the upper layer of InWh in mSC, and DMSSNr targeted the upper InG and the lower InWh. Thus, lSNr axons seem to be a combination of VLSSNr and DLSSNr. Scale bar, 500um. Similar results were obtained in n = 9 mice, 3 for each site.
Extended Data Fig. 5
Extended Data Fig. 5. SNr output to Zona Incerta is topographically organized
a). Example coronal section showing mSNr (red:TdTom)and lSNr (green:EYFP) axon fibers in zona incerta, from experiment described in Fig. 2a. Similar results were obtained in n = 4 mice. b). Example coronal sections showing DMSSNr (magenta:TdTom), DLSSNr (cyan:TdTom) and VLSSNr (yellow:TdTom), axon fibers in zona incerta, from experiment described in Fig. 2e. Similar results were obtained in n = 9 mice, n = 3 for each site.
Extended Data Fig. 6
Extended Data Fig. 6. Brain regions targeted by SNr
a) Example histology section of brain regions targeted by DMSSNr, DLSSNr, and VLSSNr. Each row represent a brain region, and each column is a different SNr subpopulation labelled from distinct striatal regions (see experiment described in Fig. 2e). b) top left, Quantification of normalized fluorescence intensity across brain regions for DMSSNr, DLSSNr, and VLSSNr (see Methods). bottom right, Similar quantification of brain stem regions, IRt and PCRt, but normalized only to total fluorescence in brain stem. Abbreviations. VM/VA: ventromedial/ventral anterior thalamus, PC/CL/CM: paracentral/centrolateral/central medial thalamus, Pf: parafascicular nucleus, LH: lateral hypothalamus, IC: inferior colliculus, SC: superior colliculus, ZI: zona incerta, PAG: paracqeuductal gray, MA3: medial accessory oculomotor nucleus, MLR: mesencephalic locomotor region, PnO: pontine reticular nucleus, oral part, LDTg: laterodorsal tegmental nucleus, PB: parabrachical nuecleus, IRt: intermediate reticular nucleus, PCRt: parvicellular reticular nucelus, Gi: gigantocellular reticular nucleus (DMSSNr: n=2 mice; DLSSNr: n=3 mice; VLSSNr: n=3 mice)
Extended Data Fig. 7
Extended Data Fig. 7. Anterogradely labelled putative dopamine axons in striatum
a) Example coronal sections showing putative dopamine axons in striatum (from experiment described in Fig. 2e). Each row represent a distinct striatal injection of AAV1.cre from DMS, DLS and VLS. Injection site is shown in green (H2b-EGFP), dopamine axons in red (TdTom). For all three striatal injections, dopamine axons tend to co-localize with the injection site. Similar results were obtained in n = 9 mice, 3 for each site. b) Schematic showing experiment for validating the axons observed in striatum are dopamine axons. AAV1-Flpo was injected striatum, followed by a cocktail of AAV-DIO-TdTom and AAV-Coff/Fon-EYFP in SNr/SNc, in a Slc6a3-IRES-Cre mouse, where Cre is expressed in dopamine neurons. This allowed us to anterogradely label SNr neurons, similar to experiment in Fig. 2e, but excluding the dopamine neurons (DA-/STR recipient), while also labelling dopamine neurons as a control. c) Example sagittal section showing the injection site. Dopamine neurons are expressing TdTom (red) whereas non-dopaminergic/anterogradely labelled cells are expressing EYFP (green). Similar results were obtained in n = 2 mice. d) Sagittal sections showing axons in striatum (left), thalamus (middle) and SC (right). Dopaminergic axons (red:TdTom) were only seen in striatum, whereas non-dopaminergic/striatal recipient axon (green:EYFP) were only seen in thalamus and SC. Given the lack of EYFP fibers in striatum, axons seen in striatum from anterograde tracing at striatum (experiment in Fig. 2e) likely are dopamine axons. Similar results were obtained in n = 2 mice.
Extended Data Fig. 8
Extended Data Fig. 8. SC projects back to Pf and VM in a topographical fashion
a). Overlap of SNr axons labelled via anterograde tracing in striatum (AAV1.Cre, see Fig. 2e) and cortical axons. Scale bar, 500um. Allen Institute for Brain Science. Allen Mouse Brain Connectivity Atlas (2011). Available from https://connectivity.brain-map.org/. b). Experimental protocol for labelling medial and lateral SC. Two anterograde tracers (AAV1.Cre and AAV1.Flpo) were injected in ACA/tjM1 respectively, followed by AAV.DIO.TdTom or AAV.fDIO.EYFP in medial or lateral SC. This allowed labelling mSC and lSC without leaking into other regions outside SC. c). Example coronal section showing the injection site in SC (mSC in red, lSC in green). Similar results were obtained in n = 3 mice. Scale bar, 1mm. d). Example coronal sections showing the axonal targets of mSC and lSC. We observed topography in both Pf and VM, similar to SNr topography (see main Text). Similar results were obtained in n = 3 mice. Scale bar, 1mm.
Extended Data Fig. 9
Extended Data Fig. 9. Detailed optical setup for TF stimulation
The optical setup allows depth dependent optical illumination combined with TF. The main components are: P1: pockel cell (or any power modulator), S1: shutter, M1: piezo mirror, M3: small mirror (0.5” diameter), M2: galvo mirror, L1: Achromatic double (AC508–200-A-ML, f=200mm, diameter 2”, Thorlabs), L2: Aspheric condenser (ACL5040-A, f=40mm, diameter 50mm, Thorlabs), X1: XY translation cage mount + Z-axis translation mount (Thorlabs). M2 galvo mirror was used to change the incident angle onto the patchcord attached at the end of X1. M1 was used to correct for any misalignment for each angle.
Extended Data Fig. 10
Extended Data Fig. 10. dSPNs VLS stimulation engage cortical and collicular BG loops
a) Schematic showing protocol for recording activity in tjM1 and lSC while stimulating VLS dSPNs. Mice implanted with a single tapered fiber targeting VLS, and injected with AAV-DIO-CoChR in VLS, similar to experiment described in Fig. 6a (see methods). Extracellular recording with silicon probe was done above tjM1 and lSC, on the same side (right hemisphere) as the stimulation side in striatum (n = 2 mice). b) Mean firing rate during the inter-trial-interval where mice were required to withhold licking, and during which VLS dSPNs stimulation caused contralateral licking (Fig. 6). Mean firing rate of both tjM1 (left) and lSC (right) increased during stim (blue, 100 ms stim) relative to no stim (grey). Shaded light blue represents laser on period (100ms) (n = 102 units in tjM1, n = 65 units in lSC) (mean ± s.e.m across neurons). c) Fraction cells that were significantly modulated by dSPNs stimulation in VLS in tjM1 (top) and SC (bottom). Cells are categorized into either excited (blue), inhibited (red) or no sigficant change (grey). The majority of cells recorded (53% in tjM1, 68% in lSC) were excited by the stimulation (0–500 ms window relative to laser onset, p<0.05, Mann-Whitney U test, see Methods). d) Mean firing rate, during tone presentation, of cells that were significantly modulated during ITI stimulation. Firing rate for tjM1 (left) and lSC (right) in left trials and right trials. Firing rate during no stim (grey) and during stim trials (blue). Shaded light blue represents laser on period (100ms) (n=102 units in tjM1, n=65 units in lSC) (mean ± s.e.m across neurons).
Figure 1.
Figure 1.. Topographically organized projection from BG input to output nuclei
a) Experimental protocol for studying topography in the basal ganglia. top sagittal section, AAV1-Cre is injected into DMS, DLS, or VLS of H2B-EGFP reporter mice (Rosa26-CAG-LSL-H2B-mCherry mouse line). bottom coronal sections, After 2 weeks, the Cre encoded by the virus activates H2B-EGFP expression at the injection site (STR) as well as, due to its anterograde propagation, in the BG output nuclei (GPe – globus pallidus externus; EP – entopeduncular nucleus; SNr – substantia nigra pars reticulata). b) Example coronal sections of striatum showing the injection sites (scale bar, 1mm) with fluorescence of the H2B-EGFP shown in indicated colors – DMS (magenta), DLS (cyan) and VLS (yellow). Similar results were obtained in n = 9 mice (n = 3 for each site). c) Example coronal section (left column) and average relative cell density map of H2B-EGFP expressing cells (right column) in GPe (left), EP (middle) and SNr (right) for injections at three different striatal sites as indicated (top DMS, middle DLS, bottom VLS) (n=3 mice for each striatal injection site, scale bar, 500 μm).
Figure 2.
Figure 2.. Projections of BG output nuclei to downstream targets maintain segregated topography
a) Protocol for tracing medial-lateral topography in GPe. AAV1-Cre and AAV1-Flpo were injected in the medial and lateral striatum, respectively, followed by injection in GPe of a mixture of AAVs encoding fluorophores whose expression is activated by either Cre (AAV-DIO-tdTom) or Flpo (AAV-fDIO-EYFP) recombinase. Anterograde movement of AAV1-Cre activates tdTom expression in the cells of medial striatum target zone of the GPe (MGPe) whereas AAV1-Flpo activates EYFP expression in the lateral striatum target zone (LGPe). b) Example coronal sections showing fluorophore-expressing cell bodies in GPe (left) and labeled their axons downstream of the GPe (right three panels) in SNr, parafasicular nucleus (Pf), and striatum/cortex (STR/CTX) as indicated (scale bar, 1mm). Insets show enlarged images of the SNR, Pf, and CTX. Similar results were obtained in n = 2 mice. c) Protocol as in panel a) but with Cre and Flpo dependent viruses injected in SNr to label the medial and lateral SNr target zones (MSNr and LSNr). d) Example coronal sections showing the infected cell bodies in SNr (left) and their axon downstream of SNr (right three panels) in ventromedial thalamus (VM), Pf, and superior colliculus (SC) (scale bar, 1mm). Insets show enlarged images of the VM and Pf. Similar results were obtained in n = 4 mice. e) Protocol for anterograde tracing from more localized, focal injections of AAV1-Cre into either DMS, DLS or VLS in separate mice, followed by a AAV-DIO-TdTom in SNr. f) Example coronal sections showing the infected cell bodies in SNr (left column) and axons in Pf, VM, SC and brain stem (right four columns) for mice with AAV1-Cre injections into DMS, DLS, or VLS as indicated. Scale bar, 250 μm. IRt: intermediate reticular nucleus, PCRt: parvicellular reticular nucelus, Gi: gigantocellular reticular nucleus. Similar results were obtained in n = 9 mice (n = 3 for each site).
Figure 3.
Figure 3.. The BG output via Pf forms segregated and closed loops
a) Simultaneous mapping Pf input to striatum and BG output to Pf. AAV1-Cre injected into the H2B-EGFP reporter mouse travels retrogradely to label neurons in Pf that project to the injection site as well as anterogradely to labels neurons in SNr targeted by those in the injection site. AAV-DIO-TdTom injected into SNr labels axons in Pf arising from SNr neurons that are in the zone targeted by neurons in striatal injection site. b) Overlap of retrogradely labelled Pf cells (green) and axons (magenta) from anterogradely labelled SNr cells for different location of striatal injection (column, DMS, DLS or VLS). Scale bar, 250um. Similar results were obtained in n = 9 mice (n = 3 for each site). c) Testing topography in slice. Pf cells were retrogradely labelled via CTB injection from two striatal locations, while only one striatal location also received an AAV1.Cre injection. The entire SNr was injected with AAV-DIO-CoChR. Connection strength was tested by patching in voltage clamp and comparing outward current in either DMS projecting cells (red) or DLS projecting cells (green) inside Pf. d) left, Example outward currents observed in distinct Pf cells (red: PfDMS, green: PfDLS). Each row indicates experimental conditions were the location of AAV1.Cre injection was varied (top, DMS, bottom DLS). right, Box plot quantification of peak amplitude outwards currents and number of connected cells out of all cells tested (top, 56 cells from 3 mice, bottom, 49 cells from 3 mice) (P** < 10−3, P*** < 10−4, one sided Mann–Whitney U test). Box depicts 25th percentile, median and 75th percentile and whiskers depict ±2.7 standard deviation; data points outside these ranges are shown as individual circles.
Figure 4.
Figure 4.. BG output via VM forms segregated closed loops via cortical layer 1.
a) Protocol for labelling SNr recipient VM neurons. AAV1-Cre was injected in SNr followed by AAV-DIO-EGFP in VM. b) left, Coronal section showing injection site and labeled cell bodies in VM. center, Labeled VM axons target many layers and densely innervate layer 1 throughout frontal cortex (shown here is tjM1, ACA and fM1 in white arrows). right, Quantification of EGFP fluorescence intensity across cortical depth in the indicated cortical regions. Similar results were obtained in n = 3 mice. Scale bar, 1mm. c) Coronal section showing the injection sites of three different color retrograde tracers (CTB594, CTB488 and CTB647 shown in yellow, cyan and magenta, respectively) in superficial layers of tjM1, fM1 and ACA. Scale bar, 1mm. d) Coronal sections showing retrogradely labelled cells along the anterior-posterior axis of VM (tjM1=yellow, fM1=cyan and ACA=magenta). Similar results were obtained in n = 3 mice. Scale bar, 250um. e) Protocol for examining the segregation of DMS/DLS SNr output pathways in VM. Two different colored CTB were injected into layer 1 of either ACA and fM1, AAV1-Cre was injected focally in the striatum (either DMS or DLS), and AAV-DIO-CoChR was injected broadly in the SNr. f) left, Schematic of the acute preparation for whole cell physiology. Whole-cell voltage clamp recordings were obtained from VM cells retrogradely from ACA (red) or fM1 (green) and optogenetically-evoked synaptic currents were measured at a holding potential (Vh) of 0 mV. center, Example outward currents in VMACA or VMfM1 after optogenetic stimulation of SNr axons (blue line). right, Box plot quantification of average peak amplitude of inhibitory currents evoked across of all cells. In all columns, the top and bottom rows show results from experiments in which AAV-Cre was injected into DMS and DLS, respectively (top: n=34 cells/ 3 mice; bottom: n=18 cells/2 mice) (P* < 10−2, P** < 10−3, one sided Mann–Whitney U test). Box depicts 25th percentile, median and 75th percentile and whiskers depict ±2.7 standard deviation; data points outside these ranges are shown as individual circles.
Figure 5.
Figure 5.. Focal optogenetic stimulation of neurons in striatum using tapered fiber optics
a) Optical setup for depth dependent stimulation via tapered fibers (see Methods). A steering galvanometer mirror controlled the angle at which a low numerical aperture laser beam enters the patchcord (colors indicated four possible incident angles of the laser beam). b) left, Colored coded fluorescence profiles generated by a TF inside fluorescein solution with light entering the patch cord at four different angles. right, quantification of the normalized fluorescence intensity profile along the axis of the fiber. Scale bar: 1 mm. c) Experimental preparation for in vivo validation of focal optogenetic stimulation of striatal neurons. CoChR was expressed selectively in indirect pathway striatal projection neurons by injection of AAV-DIO-CoChR into the striatum of an Adora2a-Cre transgenic mouse. After expression of the optogenetic protein, a fibertrode consisting of a TF attached parallel to silicon probe (SP) was acutely implanted into the striatum of a head restrained animal. d) Example session with multi-units at different depths along the electrode recorded while emitted light from different depths along the TF. Each row shows raw channel voltage traces from contacts in different depths (dorsal to ventral, top to bottom). The colored bars indicates the time of laser injection at each input angle and corresponding emission at each depth. e) Quantification of normalized change in firing rate for units at each contact along the electrode (row) at different depths of stimulation (column).
Figure 6.
Figure 6.. Stimulation of direct pathway projection neurons in VLS induces contralateral licking
a) Experimental protocol to achieve selection optogenetic stimulation of direct pathway neurons in the lateral and medial striatum. AAV-DIO-CoChR was injected into the right striatum in Drdla-Cre mice and two tapered fibers tapered fibers were implanted in the medial and lateral parts of the striatum. b) Example coronal section of a Drdla-Cre mouse processed after training. left, CoChR expression (green) and right, GFAP immunostaining (magenta) show the location of the fibers in the striatum. c) Task structure. Mice were trained to lick either a left or right water reward port after hearing tone A or B, respectively (see Methods). The first lick was considered the choice lick and, if directed towards the correct port, triggered delivery of water drop reward at the corresponding spout. Mice had to refrain from licking during the random inter-trial-interval (2~4 secs) in order for the next tone to be played. d) Stimulation protocol showing that one of 8 sites (4 lateral and 4 medial) were stimulated optogenetically (100 ms, 100 μW) during the inter-trial-interval. e) Example session showing lick raster aligned to laser onset for stimuli delivered to different striatal locations (DMS, DLS, and VLS). f) Probability of the contralateral (blue) or ipsilateral (red) water port licking within 500 ms of laser onset for stimulation of DMS, DLS, and VLS. Data was shown as mean ± s.e.m across 10 sessions from n=5 mice. g) Latency and number of stimulation induced licks. top, The distribution of first lick latencies relative to tone onset (5 mice, 10 sessions, 2123 trials). middle and bottom, Distributions of first lick latency and the number of licks for all lick-inducing optogenetic stimuli (119 trials, 5 mice, 10 sessions).
Figure 7.
Figure 7.. dSPNs stimulation outside VLS does not interfere with cue-evoked licking
a) left, Example session where dSPNs stimulation was applied in VLS during tone presentation (see Methods). Each dot represents spout contact on the left (blue) or right (red) relative tone onset. Trials are sequentially sorted by trial type (left vs right), stimulation (no stim vs stim) and outcome (correct vs incorrect vs miss). right, Summary of the outcome for left trials and right trials. Stimulation on right trials, but not left trials, caused a significant increase in incorrect outcome percentage. b) left, Example session where dSPNs stimulation was applied to DMS. right, Stimulation did not change the percentage outcome for both left and right trials. c) left, summary graph for eight striatal sites stimulated for left and right trials during tone presentation. Each dot represents a single striatal site of stimulation, with the color representing the change in percentage correct outcome (%), and the size representing the p-values. Only stimulation on the right trials in VLS decreased the performance. right, summary graph for ITI stimulation (Fig. 6) replotted for comparison. P-values were calculated by bootstrapping (see Methods). (Tone stimulation left trials, DMSVMS fiber: p=0.90, 0.95, 0.86, 0.25; DLSVLS fiber: p=0.99, 0.77, 0.56, 0.026. Tone stimulation right trials, DMSVMS fiber: p=0.65, 0.93, 0.62, 0.71; DLSVLS fiber: p=10−5 for all sites. ITI stimulation, DMSVMS fiber: p=10−5, 10−5, 2.0 × 10⁻⁵, 1.5 × 10⁻² from bottom to top; DLSVLS fiber: p=10−5 for all sites. All p-values from each fiber reported from bottom to top site). d) Breakdown of change in outcome (%) for VLS stimulation in left and right trials. Summary graph for left/right trials for no stim and stim trials. Each dot represents a session from one individual mouse (n = 5 mice). Each trial outcome is categorized into correct (grey), incorrect (green) or miss (orange). Stimulation on the right trials increased the percentage incorrect (%) relative to no stim trials.
Figure 8.
Figure 8.. DMS and VMS direct pathway stimulation induce contralateral turning
a) Experimental protocol for examining the effects of focal striatal stimulation on turning. A mouse was placed in an open field and optogenetic stimuli were delivered to different striatal regions via TFs w for 0.8 sec every 10~15 sec (see Methods). b) Two example trials in which stimulation in medial striatum induced contralateral turning. Time relative to laser onset is indicated in white in the bottom left for each frame. The nose and body positions are indicated in red and green respectively. c) Example session for one mouse showing cumulative turn angle relative to that at laser onset (defined as zero degrees) for stimulation in VMS, DMS, VLS, and DLS (left to right). The period during which the laser was on is indicated in blue (20 trials per stimulation site). Data are shown as mean ± s.e.m across trials. d) Baseline subtracted turn angle (cumulative angle turned during stimulation – angle pre stimulation, see Methods) for VMS, DLS, VLS, and DLS. Data are shown as mean ± s.e.m across mice (n=4). VMS was defined as the 2nd site from bottom in the DMSVMS fiber. e) Contralateral turn angle for all the each of the 8 stimulated regions. The color of each circle indicates the effect size (baseline subtracted cumulative turned angle in degrees) whereas its size indicates the p-value (DMSVMS fiber: p=10−5, 10−5, 2.3 × 10⁻⁴, 2.4 × 10⁻³; DLSVLS fiber: p=10−5, 10−5, 3.5 × 10⁻⁴, 7.3 × 10⁻³. All p-values from each fiber reported from bottom to top site). f) As in panel (e) but showing contralateral lick probability in lateralized licking task for stimulation during ITI (Figure 7c right panel, reproduced for comparison). P-values were calculated by bootstrapping (see Fig 7c).

References

    1. Roseberry TK et al. Cell-Type-Specific Control of Brainstem Locomotor Circuits by Basal Ganglia. Cell 164, 526–537 (2016). - PMC - PubMed
    1. Kravitz AV et al. Regulation of parkinsonian motor behaviours by optogenetic control of basal ganglia circuitry. Nature 466, 622–626 (2010). - PMC - PubMed
    1. Tai L-H, Lee AM, Benavidez N, Bonci A & Wilbrecht L Transient stimulation of distinct subpopulations of striatal neurons mimics changes in action value. Nat. Neurosci. 15, 1281–1289 (2012). - PMC - PubMed
    1. Xiong Q, Znamenskiy P & Zador AM Selective corticostriatal plasticity during acquisition of an auditory discrimination task. Nature 521, 348–351 (2015). - PMC - PubMed
    1. Znamenskiy P & Zador AM Corticostriatal neurons in auditory cortex drive decisions during auditory discrimination. Nature 497, 482–485 (2013). - PMC - PubMed

Additional References

    1. Guo ZV et al. Flow of Cortical Activity Underlying a Tactile Decision in Mice. Neuron 81, 179–194 (2014). - PMC - PubMed
    1. Cebrián C, Parent A & Prensa L. Patterns of axonal branching of neurons of the substantia nigra pars reticulata and pars lateralis in the rat. J. Comp. Neurol. 492, 349–369 (2005). - PubMed
    1. Oldenburg IA & Sabatini BL Antagonistic but Not Symmetric Regulation of Primary Motor Cortex by Basal Ganglia Direct and Indirect Pathways. Neuron 86, 1174–1181 (2015). - PMC - PubMed

Publication types

MeSH terms