. 2020 Nov;16(11):1179-1188.
doi: 10.1038/s41589-020-00652-y. Epub 2020 Sep 28.

PROTAC-mediated degradation reveals a non-catalytic function of AURORA-A kinase

Affiliations

PROTAC-mediated degradation reveals a non-catalytic function of AURORA-A kinase

Bikash Adhikari et al. Nat Chem Biol. 2020 Nov.

Abstract

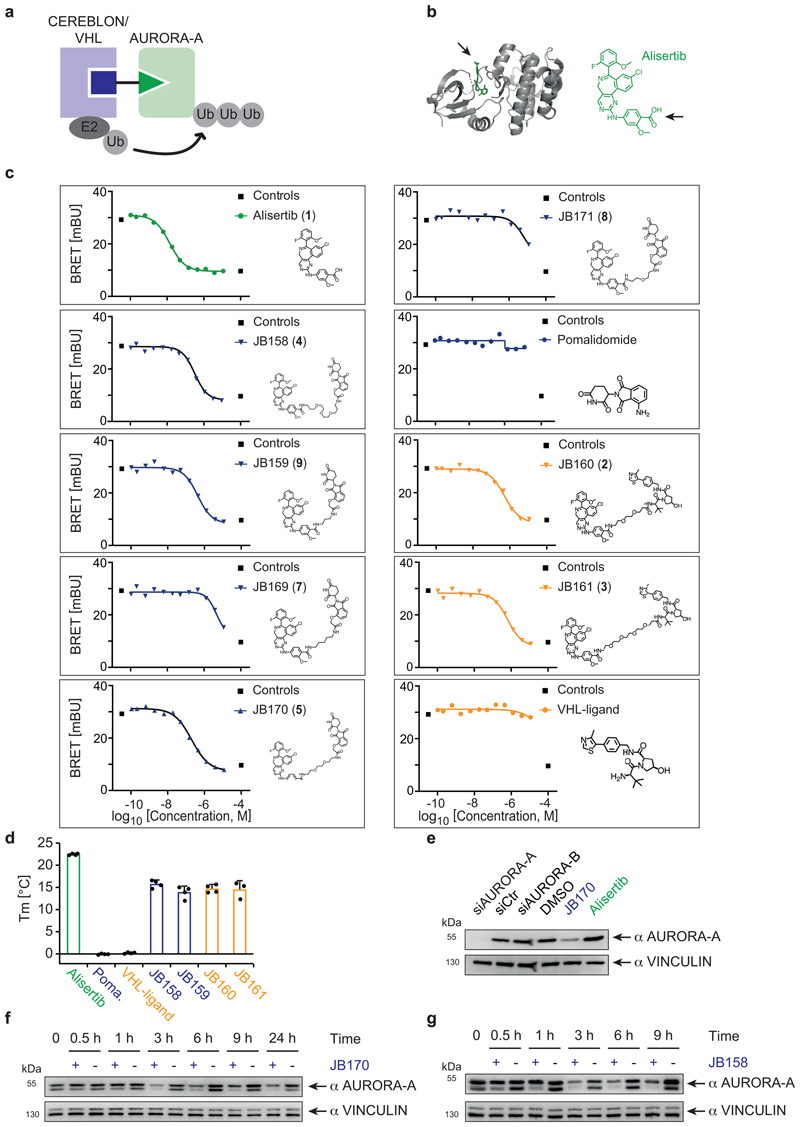
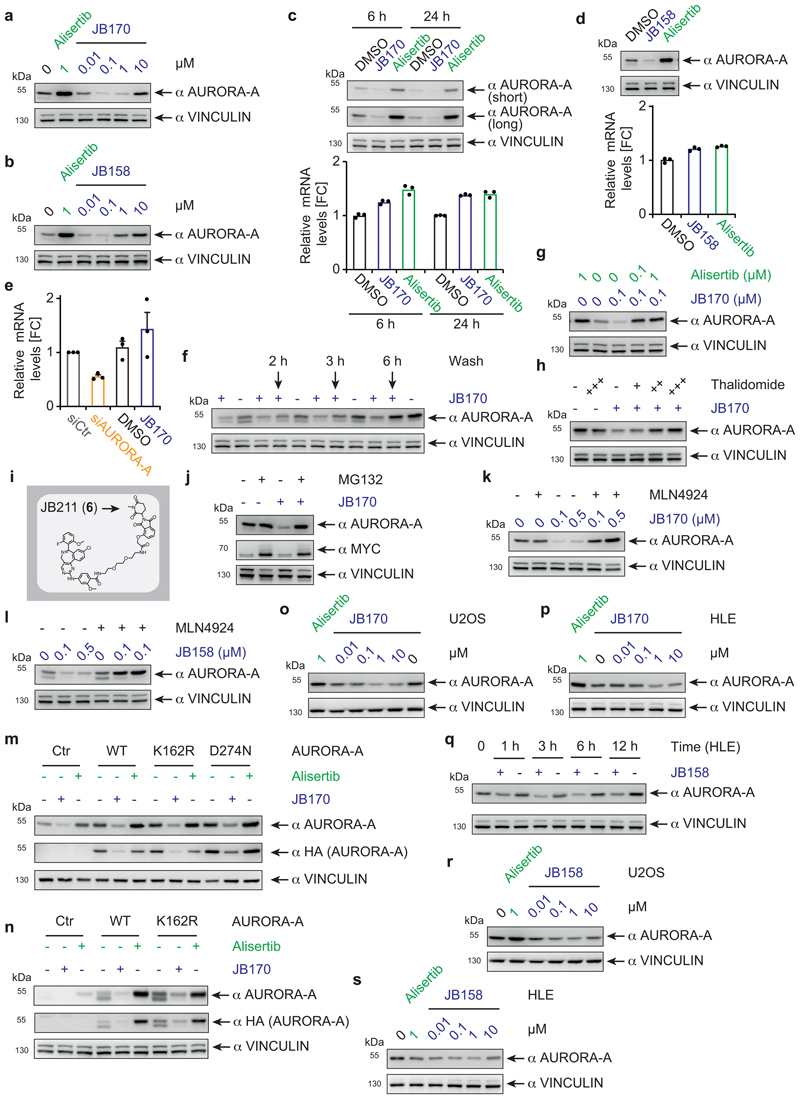
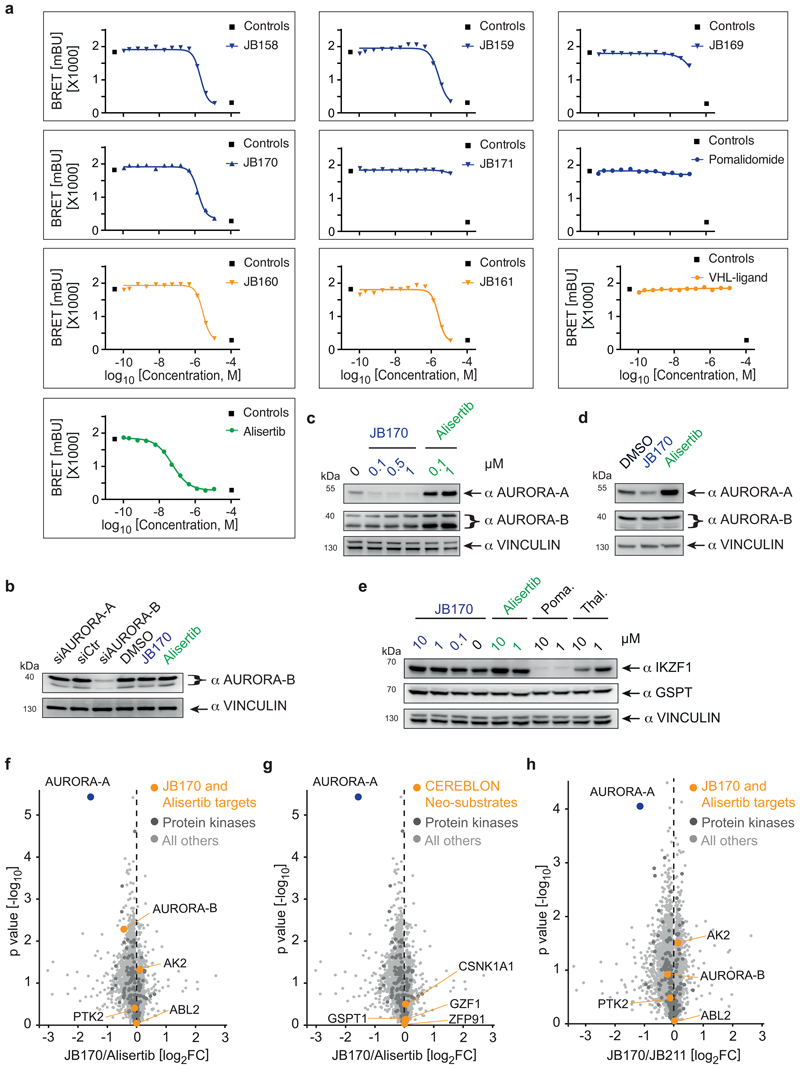
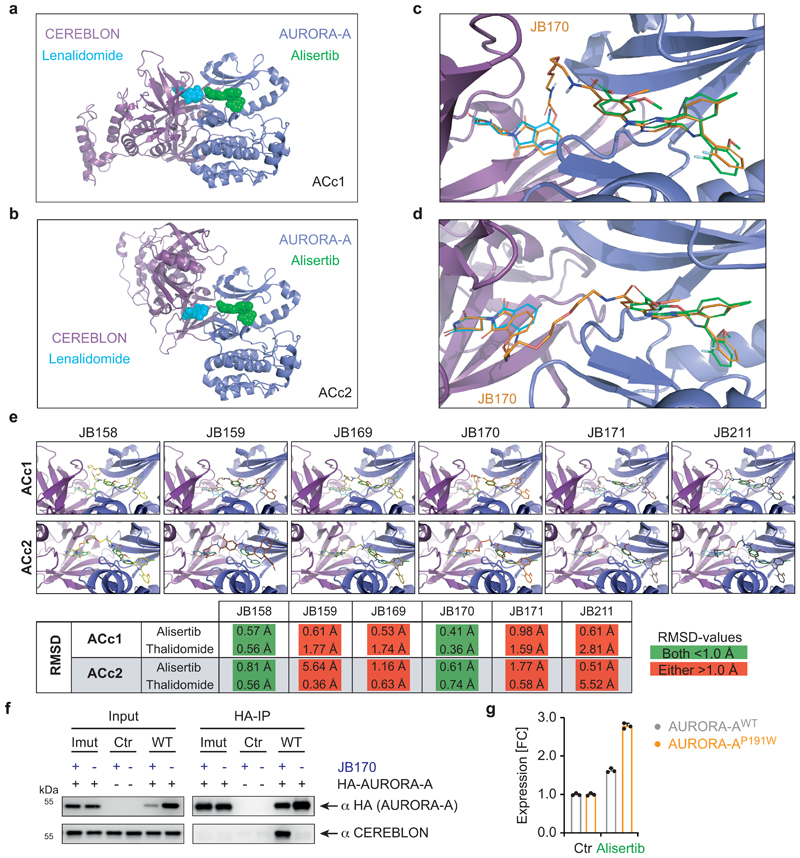
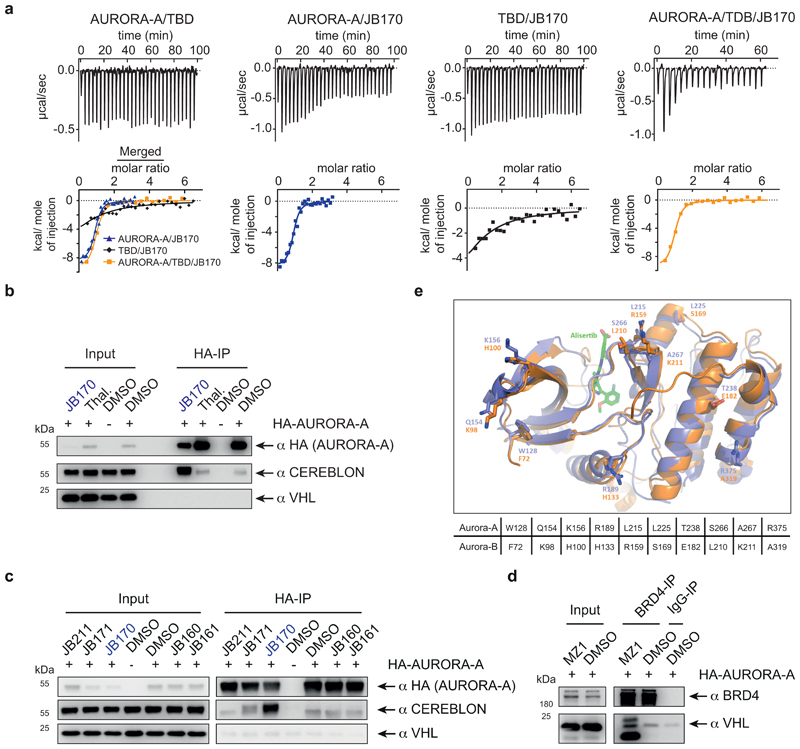
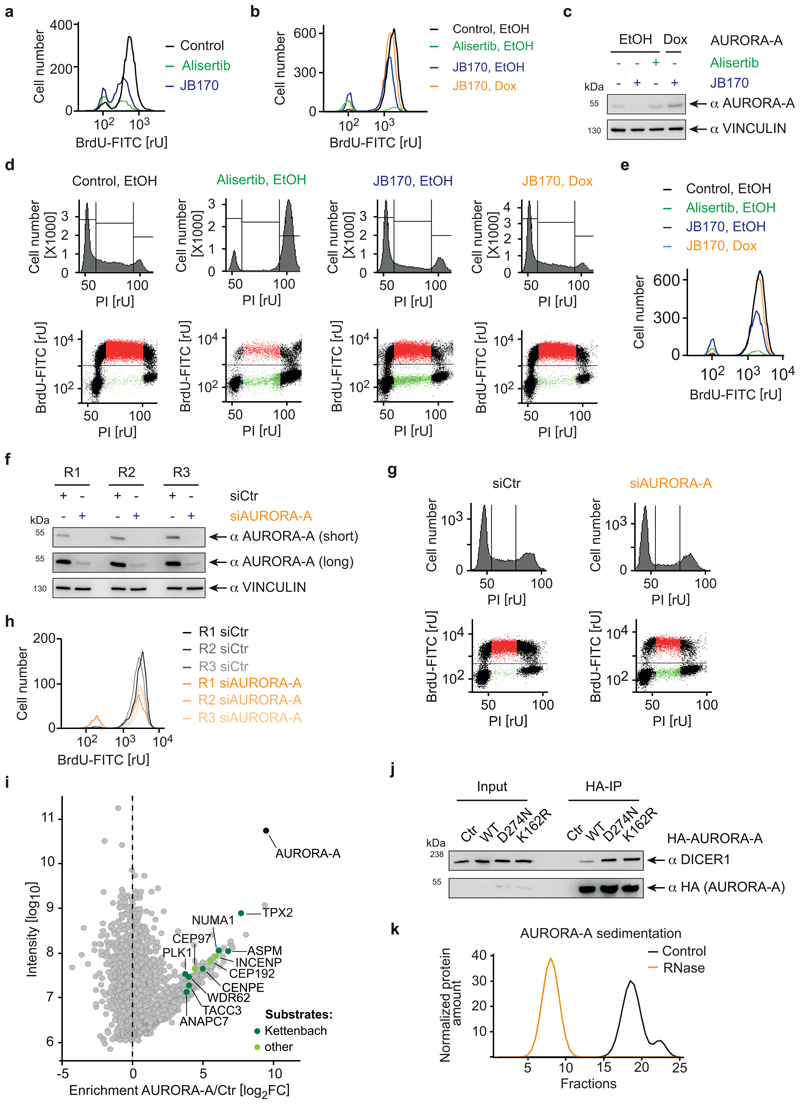
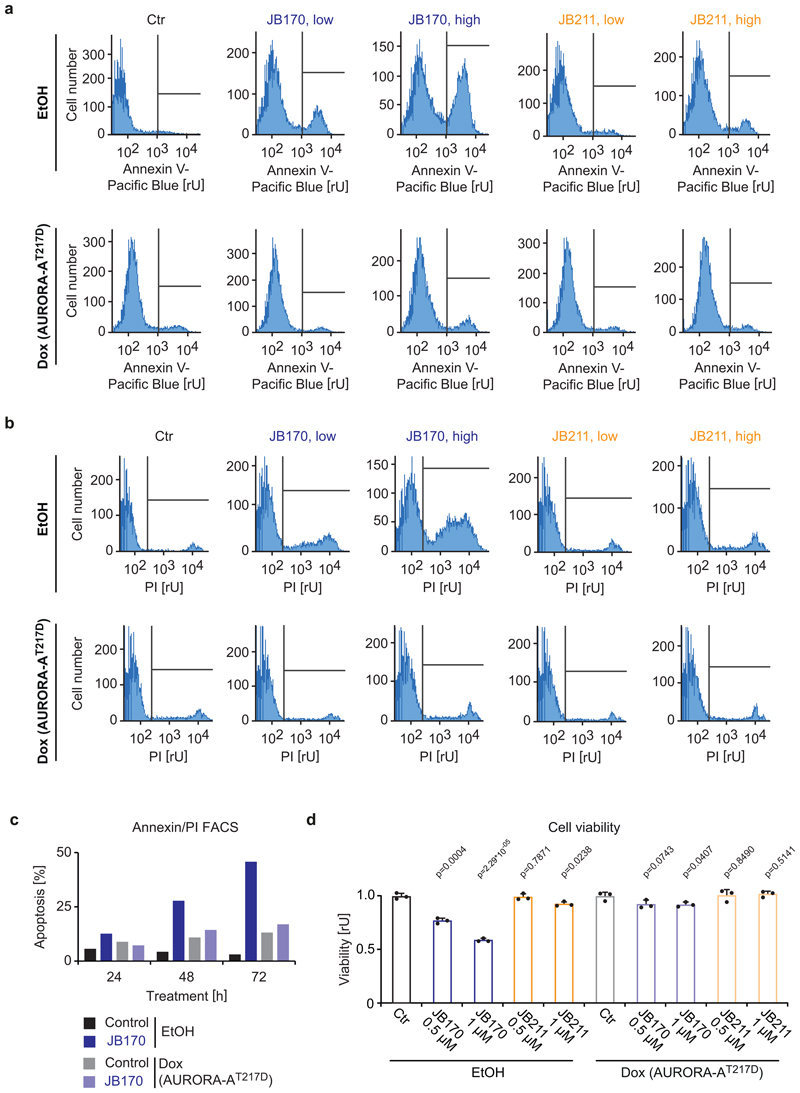
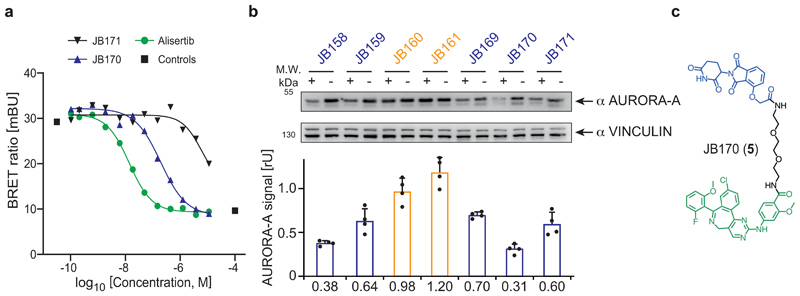
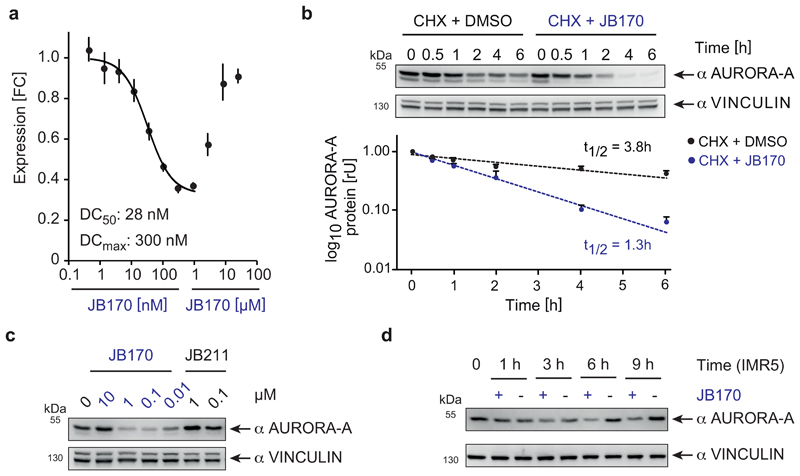
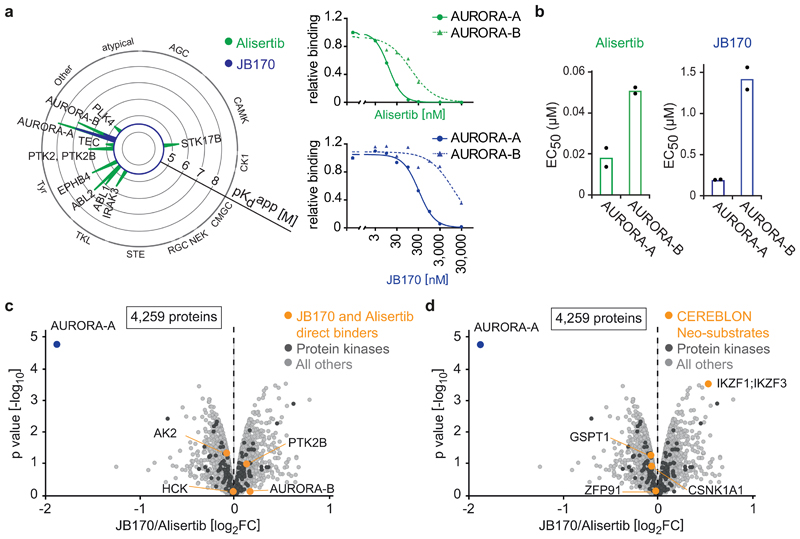
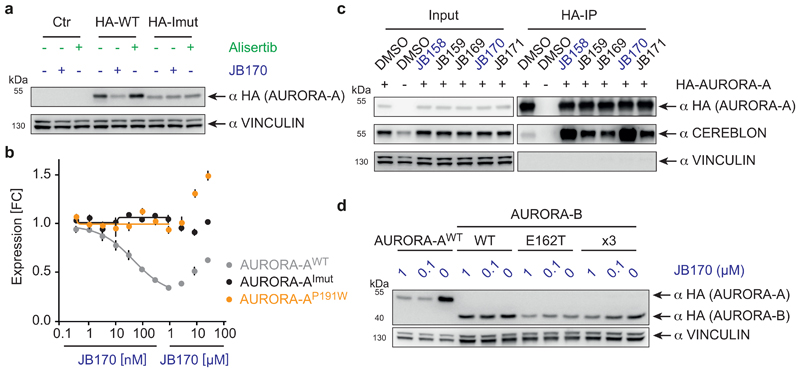
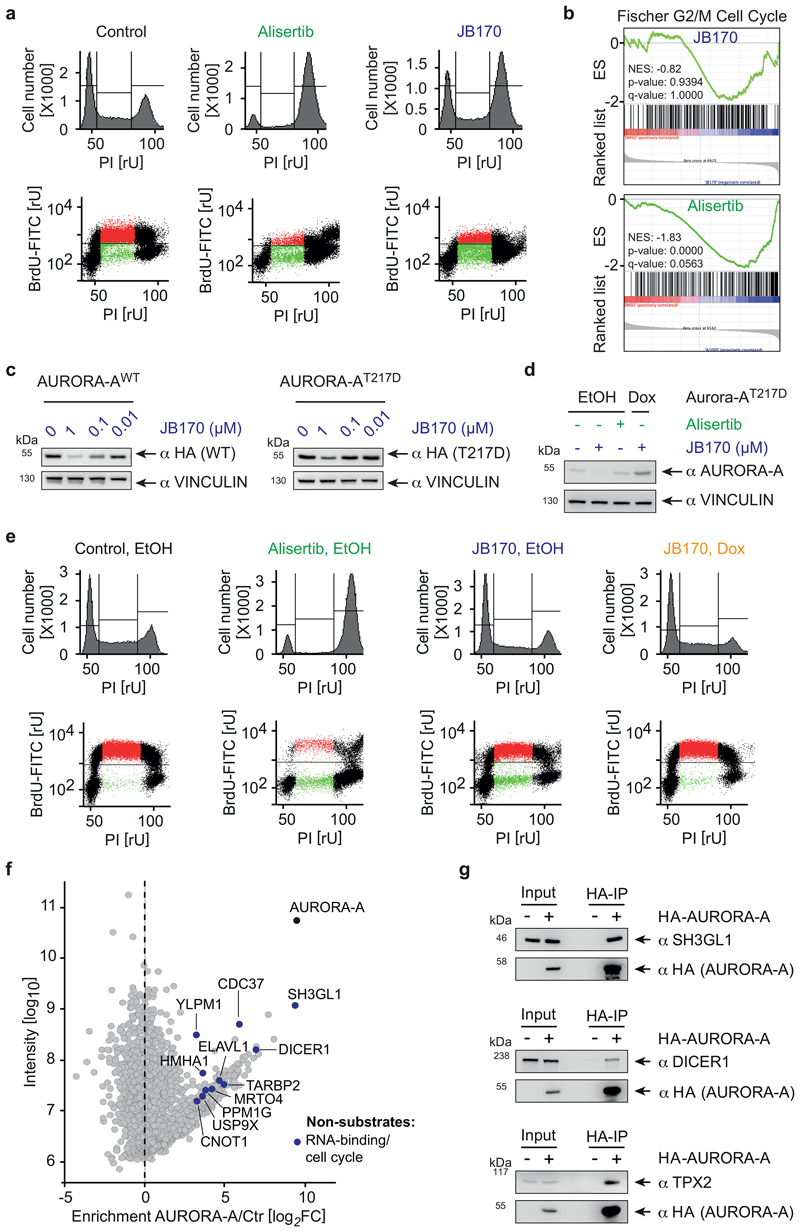
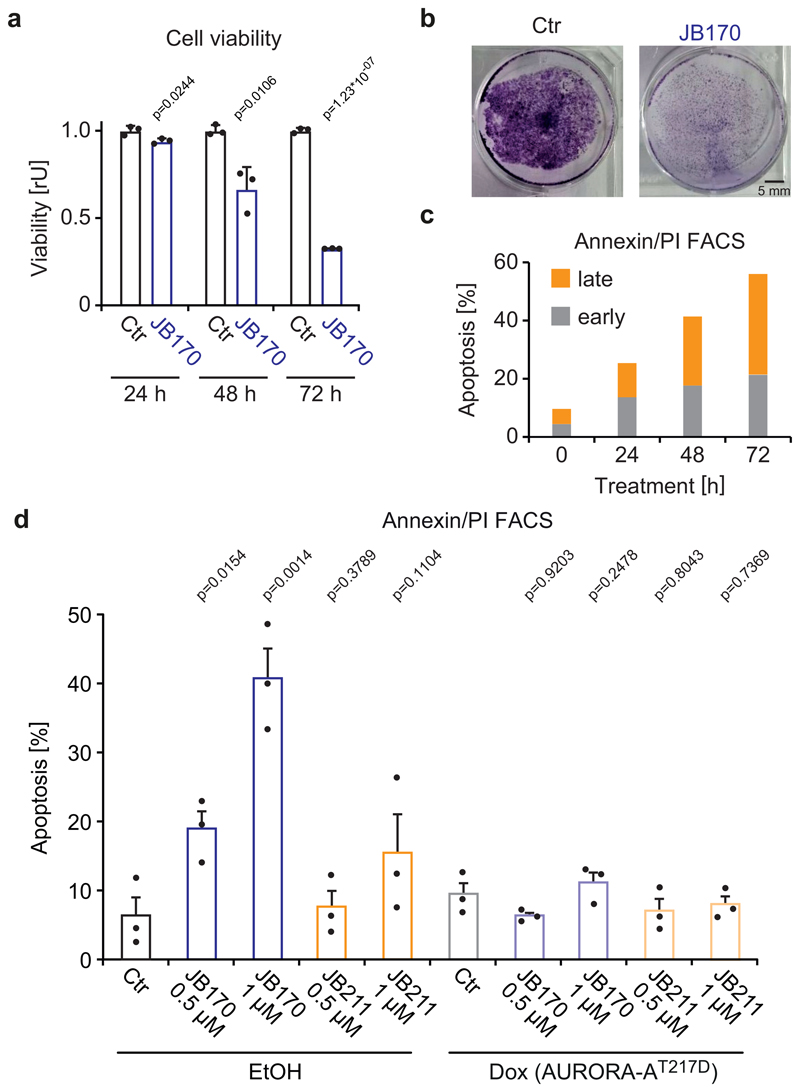
The mitotic kinase AURORA-A is essential for cell cycle progression and is considered a priority cancer target. Although the catalytic activity of AURORA-A is essential for its mitotic function, recent reports indicate an additional non-catalytic function, which is difficult to target by conventional small molecules. We therefore developed a series of chemical degraders (PROTACs) by connecting a clinical kinase inhibitor of AURORA-A to E3 ligase-binding molecules (for example, thalidomide). One degrader induced rapid, durable and highly specific degradation of AURORA-A. In addition, we found that the degrader complex was stabilized by cooperative binding between AURORA-A and CEREBLON. Degrader-mediated AURORA-A depletion caused an S-phase defect, which is not the cell cycle effect observed upon kinase inhibition, supporting an important non-catalytic function of AURORA-A during DNA replication. AURORA-A degradation induced rampant apoptosis in cancer cell lines and thus represents a versatile starting point for developing new therapeutics to counter AURORA-A function in cancer.


Conflict of interest statement

Declaration of Interests

BK is cofounder and shareholder of msAId GmbH and OmicScouts GmbH. BK has no operational role in either company. The University of Würzburg filed a patent for degraders described in the study, and EW is listed as an inventor.

Figures

Extended Data Figure 1
(a) Model of bifunctional degrader molecules (PROTACs) of AURORA-A. (b) Ribbon model of AURORA-A and structural formula of alisertib. The structure of AURORA-A bound to MLN8054 (PDB: 2X81) identified a solvent-exposed carboxyl group on the compound to which linkers could be attached by amide bonds. (c) Degrader and ligand structures and their effects on AURORA-A-NanoLuc target engagement. HEK293 cells transfected with an AURORA-A-NanoLuc fusion construct were incubated with various concentrations of the AURORA-A degrader molecules or their components together with an energy transfer probe for 2 hours and luminescence was measured. EC50 values were calculated by assuming a sigmoidal dose-response relationship (four parameters). The graph shows one of the two biological replicates. The graphs display the profile of each compound for the assay as shown in Fig. 1a. (d) Bar diagram showing the binding of degrader molecules to AURORA-A. AURORA-A was incubated with degrader molecules and binding was analyzed by thermal shift assays and compared to alisertib. Pomalidomide and VHL-binding moieties were used as controls. Bars represent mean ± s.d. for n = 4 replicates (n = 3 for JB161) (e) Immunoblot of AURORA-A. AURORA-A and AURORA B were depleted in IMR5 cells by siRNA and AURORA-A levels were compared to cells treated with JB170 (1 µM) or alisertib (1 µM) and to control cells (Ctr). (f) Immunoblot of AURORA-A. MV4-11 cells were treated with 0.1 µM JB170 for the indicated times and AURORA-A levels were compared to control cells. (g) Immunoblot of AURORA-A. MV4-11 cells were treated with 0.1 µM JB158 for the indicated times, and AURORA-A levels were compared to control cells.
Extended Data Figure 2
(a) Immunoblot of AURORA-A. MV4-11 cells were treated with various concentrations of JB170 and alisertib for 6 hours, and AURORA-A levels were compared to control cells. (b) Immunoblot of AURORA-A. MV4-11 cells were treated with various concentrations of JB158 and alisertib for 6 hours and AURORA-A levels were compared to control cells. (c) Immunoblot of AURORA-A and bar diagram of RT-qPCR analysis. RNA and protein were isolated from MV4-11 cells treated with JB170 (0.1 μM) and alisertib (0.1 μM) for 6 and 24 hours. AURORA-A protein (top) and RNA levels (bottom) were analyzed. Short and long exposures are shown for AURORA-A. AURORA-A expression levels were normalized to control cells (DMSO). Bars represent mean of technical replicates. (d) Immunoblot of AURORA-A and bar diagram of RT-qPCR analysis. RNA and protein were isolated from MV4-11 cells treated with JB158 (0.1 µM) or alisertib (0.1 µM) for 6 h. AURORA-A protein (left) and RNA levels (right) were analyzed. Vinculin was used as a loading control. The AURORA-A expression levels are normalized to control cells (DMSO). Bars represent mean of technical replicates. (e) Bar diagram of RT-qPCR analysis. RNA was isolated from IMR5 cells treated with an siRNA against AURORA-A, a non-targeting control (siCtr), JB170 and control cells (DMSO). AURORA-A RNA levels were analyzed by RT-qPCR in comparison to beta-2 microglobulin and normalized to control cells (siCtr). Bars represent mean ± s.e.m. of relative expression for n = 3 biological replicates. (f) Immunoblot of AURORA-A upon washout of JB170. MV4-11 cells were treated with JB170 (0.1 µM) for 3 hours before they were either cultured in JB170-containing or JB170-free medium for up to 6 hours. (g) Immunoblot of AURORA-A. MV4-11 cells were treated with different concentrations JB170 and alisertib for 6 hours and compared to cells treated with one compound or untreated cells. (h) Immunoblot of AURORA-A. MV4-11 cells were treated for 6 hours with JB170 (0.1 µM) and unconjugated thalidomide (+: 1 µM, ++: 10 µM, +++: 20 µM). (i) Structure of JB211 that is an inactive analogue of JB170. (j) Immunoblot of AURORA-A. MV4-11 cells were treated with JB170 (0.1 µM) and proteasomal inhibitor MG132 (10 µM) for 6 hours. (k) Immunoblot of AURORA-A. MV4-11 cells were treated with different concentrations JB170 and the NEDD8 activating enzyme (NAE) inhibitor MLN4924 (3 µM) for 6 hours. (l) Immunoblot of AURORA-A. MV4-11 cells were treated with different concentrations JB158 and the NEDD8-activating enzyme inhibitor MLN4924 (3 µM) for 6 hours. (m) Immunoblot of HA-tagged AURORA-A. Kinase-dead versions of HA-tagged AURORA-A (AURORA-AK162R, AURORA-AD274N) and the HA-tagged wildtype protein (WT) were expressed in IMR5 cells. Cells were then treated with alisertib (1 µM) and JB170 (1 µM) for 18 hours, and AURORA-A levels were analyzed using an anti-HA tag antibody and an anti-AURORA-A antibody. (n) Immunoblot of HA-tagged AURORA-A. Kinase-dead version of HA-tagged AURORA-A, AURORA-AK162R and the HA-tagged wildtype protein (WT) were expressed in MV4-11 cells. Cells were then treated with alisertib (1 µM) or JB170 (1 µM) for 18 hours, and AURORA-A levels were analyzed with an anti-HA tag antibody and an anti-AURORA-A antibody (o) Immunoblot of AURORA-A. U2OS cells were treated with different concentrations of JB170 for 6 hours. (p) Immunoblot of AURORA-A. HLE cells were treated with different concentrations of JB170 for 6 hours. (q) Immunoblot of AURORA-A. HLE cells were treated with JB158 (1 µM) for the indicated time periods. (r) Immunoblot of AURORA-A. U2OS cells were treated with different concentrations of JB158 for 6 hours. (s) Immunoblot of AURORA-A. HLE cells were treated with different concentrations of JB158 for 6 hours.
Extended Data Figure 3
(a) Effects of ligands and degraders on AURORA-B-NanoLuc target engagement. HEK293 cells transfected with an AURORA-B-NanoLuc fusion construct were incubated with various concentrations of the AURORA-A degraders or their components together with an energy transfer probe for 2 hours and luminescence was measured. EC50 values were calculated by assuming a sigmoidal dose-response relationship (four parameters). The graph shows one of the two biological replicates. (b) Immunoblot of AURORA-B. AURORA-A and AURORA B were depleted in IMR5 cells by siRNA and AURORA-B levels were compared to cells treated with JB170 (1 µM) or alisertib (1 µM) and to control cells (Ctr). (c) Immunoblot of AURORA-A and AURORA-B. MV4-11 cells were treated with various concentrations of JB170 and alisertib for 24 hours, and protein levels were compared to control cells. (d) Immunoblot of AURORA-A and AURORA-B. IMR5 cells were treated with DMSO, JB170 or alisertib for 6 hours and protein levels were compared. (e) Immunoblot of AURORA-A, GSPT and IKZF1. MV4-11 cells were treated with JB170, alisertib, pomalidomide (Pom.) and thalidomide (Thal.) for 18 hours. (f, g) Volcano plot showing changes in protein abundance. IMR5 cells were treated with JB170 (1 μM) or alisertib (1 μM) for 6 hours and proteins were analyzed by isobaric labeling (TMT: tandem mass tag) followed by mass spectrometry. The X-axis displays the relative abundance of all identified proteins (6485) in JB170-treated vs. alisertib-treated cells (log2FC). The Y-axis displays the p-value (-log10) from triplicate experiments (Student's t-test, two-sided, permutation-based FDR correction, FDR: 5%). AURORA-A and other alisertib-binding proteins (f) or neosubstrates of CEREBLON (g) are labeled (orange). (h) Volcano plot showing changes in protein abundance. IMR5 cells were treated with JB170 (1 µM) or JB211 (1 µM) for 6 hours, and proteins were analyzed by isobaric labeling (TMT: tandem mass tag) followed by mass spectrometry. The X-axis displays the relative abundance of all identified proteins (6485) in JB170-treated vs. JB211-treated cells (log2FC). The Y-axis displays the p-value (-log10) from triplicate experiments (Student's t-test, two-sided, permutation-based FDR correction, FDR: 5%). AURORA-A, other alisertib-binding proteins and protein kinases are labeled.
Extended Data Figure 4
(a) Model of the AURORA-A (blue) / CEREBLON (purple) complex. Structures of AURORA-A with alisertib and of CEREBLON with lenalidomide were used for protein-protein docking. The top-ranking solution is displayed (ACc1: AURORA-A-CEREBLON complex 1). Alisertib and lenalidomide are shown in green and aqua, respectively. (b) Model of the second-best AURORA-A (blue)-CEREBLON (purple) complex compatible with JB170 binding (ACc2). Structures of AURORA-A with alisertib and of CEREBLON with lenalidomide were used for protein-protein docking. Alisertib and lenalidomide are shown in green and aqua, respectively. (c) Modeled ternary complex structure of JB170 (orange) bound to the ACc1 shown in Extended Data Fig. 4a. Alisertib (green) and lenalidomide (aqua) were modified, connected and minimized to give JB170. (d) Modeled ternary complex of JB170 (orange) bound to the ACc2 shown in Extended Data Fig. 4b. Alisertib (green) and lenalidomide (aqua) were modified, connected and minimized to give JB170. (e) Docking solutions of the active degraders JB170 and JB158 as well as the less functional degraders JB159, JB169, JB171 and negative control JB211 in the AURORA-A (blue)-CEREBLON (purple) complexes ACc1 and ACc2. Scaffolds of thalidomide and alisertib used as light constraints during docking and as reference structures for the substructure root-mean-square deviation of atomic positions (RMSD) measurements are shown. Active degraders (labelled in green) achieve RMSD values below 1 Å with respect to both alisertib and the thalidomide scaffold. (f) Immunoblots of immunoprecipitation experiments. Cells expressing HA-tagged wildtype AURORA-A (WT), a version of AURORA-A (AURORA-AImut) with 12 amino acid substitutions (R137E, K153E, K156E, F157E, I158E, R189E, P191W, K224E, E239R, S266W, A267W and R375E) or an empty vector (Ctr) were treated with 0.5 µM JB170 for 6 hours. AURORA-A was precipitated with an anti-HA tag antibody, and the amount of co-precipitated CEREBLON was tested by immunoblotting. (g) AURORA-A levels based on luciferase measurements. Wildtype (WT) or AURORA-A with one amino acid substitution (AURORA-AP191W) were fused to luciferase fragment (HiBiT) and expressed in MV4-11 cells. Cells were treated with 1 µM alisertib for 6 hours, lysed, complemented with the second luciferase fragment (largeBiT), and measured for luciferase activity. Bars represent mean ± s.d. of n = 3 replicates.
Extended Data Figure 5
(a) Isothermal titration calorimetry experiments of AURORA-A into TBD (left panel, no measurable binding was observed), the binary complexes of AURORA-A/JB170, CEREBLON(TBD)/JB170 and ternary complex of AURORA-A/CEREBLON(TBD)/JB170. Shown are the raw heat rates on the top panel with integrated, baseline-corrected heats per injection and the corresponding fits below. An overlay of all curves (merged) is shown on the bottom left. (b) Immunoblots of immunoprecipitation experiments. AURORA-A was precipitated with an anti-HA tag antibody from MV4-11 cells stably expressing HA-tagged AURORA-A or control cells transduced with an empty vector after treatment with 0.5 µM JB170 or 5 µM thalidomide (Thal.). The amount of co-precipitated CEREBLON and VHL was tested by immunoblotting. (c) Immunoblots of immunoprecipitation experiments. AURORA-A was precipitated with an anti-HA tag antibody from MV4-11 cells stably expressing HA-tagged AURORA-A (+) or from control cells (-) after treatment with CEREBLON-based degraders (JB170, JB171, JB211), VHL-based degraders (JB160, JB161) or DMSO. The amount of co-precipitated CEREBLON and VHL was tested by immunoblotting. (d) Immunoblots of immunoprecipitation experiments. BRD4 was precipitated with a specific antibody from MV4-11 cells after treatment with the VHL-based PROTAC MZ1 or DMSO in the presence of 5 mM MG132 for 1 hour. The amount of co-precipitated VHL was tested by immunoblotting. (e) Structural superposition of AURORA-A (blue, with bound alisertib in green) and AURORA-B. Residues with a maximum distance of 5 Å from CEREBLON in the AURORA-A-CEREBLON complex models are shown in cyan. Non-conserved amino acids near the proposed interaction interfaces of AURORA-A with CEREBLON are highlighted as labeled sticks and provided as a tabular list below the figure.
Extended Data Figure 6
(a) Histogram of BrdU incorporation. The amount of incorporated BrdU is shown for cells in the S-phase in Fig. 5a. (b) Histogram of BrdU incorporation. The amount of incorporated BrdU is shown for cells in the S-phase in Fig 5e. (c) Immunoblot of AURORA-A. IMR5 cells overexpressing HA-tagged AURORA-A upon incubation with doxycycline (Dox) or control cells (EtOH) were treated with JB170 (1 µM) or alisertib (1 µM) for 18 hours. (d) Flow cytometry plots showing cell cycle distribution. IMR5 cells overexpressing AURORA-A upon incubation with doxycycline (Dox) or control cells (EtOH, as shown in Extended Data Fig. 6c) were treated with JB170 (1 µM) or alisertib (1 µM) for 18 hours. Cells were labeled with BrdU, stained with PI, and analyzed by flow cytometry. The amount of intercalating PI (top) and the correlation of BrdU to PI (bottom) are shown. (e) Histogram showing BrdU incorporation for cells in the S-phase in Extended Data Fig. 6d. (f) Immunoblot of AURORA-A. AURORA-A was depleted in IMR5 cells by an siRNA and AURORA-A levels were analyzed by immunoblotting for biological triplicates. Cells were analyzed by flow cytometry as shown in Extended Data Fig. 6g,h. (g) Cell cycle distribution analyzed by flow cytometry. IMR5 cells depleted for AURORA-A by siRNA were labeled with BrdU, stained with PI, and analyzed by flow cytometry. The amount of intercalating PI (top) and the correlation of BrdU to PI (bottom) are shown. (h) Histogram showing BrdU incorporation for cells in the S-phase in Extended Data Fig. 6g and two additional biological replicates. (i) Scatter plot of the AURORA-A interactome. The X-axis displays the enrichment (log2FC) of proteins in HA-AURORA-A-expressing cells compared to control cells (Ctr). The Y-axis displays the protein intensities (log10). Substrates of AURORA-A are labeled. (j) Immunoblots of HA-tagged AURORA-A and DICER1. HA-precipitations were performed from HEK293 cells transfected to express versions of HA-tagged catalytically inactive AURORA-A (AURORA-AD274N, AURORA-AK162R) or the wildtype protein. Exogenous AURORA-A was detected with an anti-HA tag antibody, and levels of DICER1 were analyzed in the input and immunoprecipitant by antibodies recognizing the endogenous protein. Control cells (Ctr) did not express HA-tagged protein. (k) AURORA-A sedimentation profile in the presence and absence of RNases. The graph is a re-analysis of published data46 retrieved from http://r-deep.dkfz.de/.
Extended Data Figure 7
(a, b) Cell death assay. IMR5 cells expressing AURORA-AT217D upon incubation with doxycycline (Dox) or control cells (EtOH) were treated with JB170 (0.5 μM, low; 1 μM, high) or JB211 (0.5 μM, low; 1 μM, high) for 72 hours. Cells were stained with annexin (a) and PI (b), and apoptotic cells were counted by flow cytometry. (c) Fractions of apoptotic cells analyzed by flow cytometry. IMR5 cells expressing AURORA-AT217D upon incubation with doxycycline (Dox) or control cells (EtOH) were treated with JB170 (1 µM) for indicated times. Cells were stained with annexin and PI, and apoptotic cells were counted by flow cytometry (50,000 sorted events) (d) Bar diagram showing cellular viability. IMR5 cells expressing AURORA-AT217D upon incubation with doxycycline (Dox) or control cells (EtOH) were treated with 0.5 µM and 1 µM JB170 or JB211 for 72 hours, and cellular viability was measured by the alamarBlue assay. Bars represent mean ± s.d. of n = 3 replicate experiments. P-values were calculated with two-tailed unpaired t-test assuming equal variance.
Extended Data Figure 8
Extended Data Figure 8. Visualization of the flow cytometry gating.
(a) FACS gating strategy for cell cycle distribution (BrdU-PI flow cytometry). The gating strategy is shown for one exemplary experiment. (b) FACS gating strategy for the analysis of annexin-positive cells.
Figure 1
Figure 1. Bifunctional degrader molecules induce depletion of AURORA-A in cells.
(a) AURORA-A-NanoLuc target engagement assay. HEK293 cells transfected with an AURORA-A-NanoLuc fusion construct were incubated with various concentrations of alisertib, JB170 or JB171 together with an energy transfer probe for 2 hours and luminescence was measured. The graph shows one of the two biological replicates. (b) Immunoblot and quantification of AURORA-A. MV4-11 cells were treated with VHL- (orange) and thalidomide-based (blue) degraders, and AURORA-A levels were compared to control cells by immunoblotting (top). JB158, JB160, JB161, JB169 and JB170 were used at 0.1 µM whereas JB159 and JB171 at 1 µM. Vinculin was used as a loading control (as in all other immunoblotting experiments). Bar diagram (bottom) shows cellular AURORA-A levels upon degrader treatment. Bars represent mean ± s.d. of n = 4 biological replicates. (c) Structure of the most potent degrader, JB170.
Figure 2
Figure 2. JB170 reduces AURORA-A levels by inducing proteolysis.
(a) AURORA-A levels based on luciferase measurements. AURORA-A was fused to luciferase fragment (HiBiT) and expressed in MV4-11 cells. Cells were treated with different concentrations of JB170 for 6 hours, lysed, complemented with the second luciferase fragment (largeBiT), and measured for luciferase activity (DC50: half maximal degradation concentration, DCmax: maximal degradation concentration). DC50 is calculated with the sigmoidal dose-response (four parameters) equation using only the lower eight concentrations. Data represent mean ± s.d. of n = 3 replicates. (b) Immunoblot and quantification of AURORA-A levels. Protein stability of AURORA-A was analyzed by incubating JB170-treated IMR5 cells and control cells for 0.5, 1, 2, 4, and 6 hours with cycloheximide (CHX). AURORA-A levels were quantified from three biological replicates, and AURORA-A half-life (t1/2) in the presence and absence of JB170 was estimated by linear regression. Data represent mean ± s.e.m. of n = 3 biological replicate experiments. (c) Immunoblot of AURORA-A. MV4-11 cells were treated for 6 hours with different concentrations of JB170 and the related compound JB211 (chemical formula is shown in Extended Data Fig. 2i), which unlike JB170 does not bind CEREBLON. (d) Immunoblot of AURORA-A. IMR5 cells were treated with JB170 (0.1 µM) for the indicated time periods.
Figure 3
Figure 3. JB170 is highly specific for AURORA-A
(a) Radar plot and dose-response profile for alisertib and JB170. Radar plot shows the Kinobead selectivity profile of alisertib and JB170 in a lysate of MV4-11 cells. Each spike represents a protein target; binding affinities are depicted as pKd app (negative decadic logarithms of the apparent Kd app value). The MS-based dose-response profiles (right) show binding curves after non-linear regression and the derived apparent Kd for AURORA-A and AURORA-B for alisertib (top) and JB170 (bottom). (b) Bar diagram showing EC50 values of AURORA-B-NanoLuc target engagement assay for alisertib (left) and JB170 (right). Values are presented as individual points from n = 2 biological replicates of which one is shown in Fig. S3a. (c,d) Volcano plot showing changes in protein abundance. MV4-11 cells were treated with JB170 (0.1 µM) or alisertib (0.1 µM) for 6 hours, and proteins were analyzed by triple-SILAC mass spectrometry. The X-axis displays the relative abundance of all identified proteins (4,259) in JB170-treated vs. alisertib-treated cells (log2FC). The Y-axis displays the p-value (-log10) from triplicate experiments (p-values were calculated from biological triplicates by the limma package). AURORA-A and other alisertib-binding proteins (c) or neosubstrates of CEREBLON (d) are labeled (orange).
Figure 4
Figure 4. Protein-protein interactions between AURORA-A and CEREBLON support ternary complex formation.
(a) Immunoblot of HA-tagged AURORA-A. MV4-11 cells expressing HA-tagged wildtype AURORA-A (WT), cells expressing a mutated version of AURORA-A (AURORA-AImut) with 12 amino acid substitutions (R137E, K153E, K156E, F157E, I158E, R189E, P191W, K224E, E239R, S266W, A267W and R375E), or cells transduced with an empty vector (control) were treated with 1 µM JB170 or alisertib for 6 hours. (b) AURORA-A levels based on luciferase measurements. Wildtype (WT), AURORA-A with one amino acid substitution (AURORA-AP191W) or AURORA-A with 12 amino acid substitutions (R137E, K153E, K156E, F157E, I158E, R189E, P191W, K224E, E239R, S266W, A267W and R375E, AURORA-AImut) were fused to luciferase fragment (HiBiT) and expressed in MV4-11 cells. Cells were treated with different concentrations of JB170 for 6 hours, lysed, complemented with the second luciferase fragment (largeBiT), and measured for luciferase activity. Data represent mean ± s.d. of n = 3 replicates. (c) Immunoblots of immunoprecipitation experiments. AURORA-A was precipitated with an anti-HA tag antibody from MV4-11 cells stably expressing HA-tagged AURORA-A or control cells transduced with an empty vector after cell lysates were incubated with 0.5 µM degrader. The amount of co-precipitated CEREBLON was analyzed by immunoblotting. (d) Immunoblot of HA-tagged AURORA-A and -B. MV4-11 cells expressing HA-tagged wildtype AURORA-A, wildtype AURORA-B (WT), or mutated versions of AURORA-B mimicking the active site of AURORA-A (AURORA-BE162T; AURORA-BR160L,E162T,K165R, x3) were treated with different concentrations of JB170 for 6 hours.
Figure 5
Figure 5. Degrader-mediated depletion and kinase inhibition of AURORA-A induce distinct cellular phenotypes.
(a) Cell cycle distribution analyzed by flow cytometry. MV4-11 cells were treated with alisertib (1 µM) or JB170 (0.5 µM) for 12 hours. Cells were labeled with BrdU, stained with propidium iodide (PI) and analyzed by flow cytometry. The amount of intercalating PI (top) and the correlation of BrdU to PI (bottom) are shown. (b) GSEA enrichment plot. MV4-11 cells were treated with JB170 (0.1 µM) or alisertib (1 µM) for 18 hours. cDNA was prepared and subjected to Illumina sequencing (RNA-sequencing). Gene expression of JB170- and alisertib-treated cells was compared to untreated cells by GSEA (gene set enrichment analysis) and enrichment of the gene-set “Fischer G2/M Cell Cycle” is shown. Vertical black bars indicate the position of genes in the ranked gene list; the enrichment score is shown as a green line (NES, normalized enrichment score). In this analysis, the nominal P-value was calculated using an empirical phenotype-based permutation test procedure. The permutation-based false-discovery rate (FDR) Q value was generated by correcting for gene set size and multiple hypothesis testing. (c) Immunoblot of HA-tagged AURORA-A. IMR5 cells expressing HA-tagged mutant AURORA-AT217D or wildtype AURORA-A (WT) were treated with different concentrations of JB170 for 24 hours. (d) Immunoblot of AURORA-A. IMR5 cells expressing AURORA-AT217D upon incubation with doxycycline (Dox) or control cells (EtOH) were treated with JB170 (1 µM) or alisertib (1 µM) for 18 hours. (e) Cell cycle distribution analyzed by flow cytometry. IMR5 cells expressing AURORA-AT217D upon incubation with doxycycline (Dox) or control cells (EtOH, as shown in Fig. 4d) were treated with JB170 (1 µM) or alisertib (1 µM) for 18 hours. Cells were labeled with BrdU, stained with PI, and analyzed by flow cytometry. The amount of intercalating PI (top) and the correlation of BrdU to PI (bottom) are shown. (f) Scatter plot of the AURORA-A interactome with novel binding proteins. The X-axis displays the enrichment (log2FC) of proteins in HA-AURORA-A-expressing cells compared to control cells (Ctr). The Y-axis displays the protein intensities (log10). All AURORA-A-associated proteins are listed in Supplementary Dataset 4. (g) Immunoblots of HA-tagged AURORA-A and interacting proteins. HA precipitations were performed from HEK293 cells transfected to express HA-tagged AURORA-A or control cells. Exogenous AURORA-A was detected with an anti-HA tag antibody, and levels of SH3GL1, DICER1 and TPX2 were analyzed in the input and immunoprecipitant by antibodies recognizing endogenous proteins.
Figure 6
Figure 6. Degrader-mediated depletion of AURORA-A induces apoptosis in cancer cells.
(a) Bar diagram showing cellular viability. MV4-11 cells were treated with JB170 (1 µM) and cellular viability was measured by the alamarBlue assay at the indicated time points. Bars represent mean ± s.d. for n = 3 replicates. P-values were calculated with two-tailed unpaired t-test assuming equal variance. (b) Colony formation assay. IMR5 cells were treated with JB170 (1 µM) for 4 days and stained with crystal violet. Scale bar represents 5 mm. (c) Cell death analyzed by flow cytometry. MV4-11 cells were treated with JB170 (0.5 µM). Cells were stained with annexin and PI, and early (annexin+, PI-) and late (annexin+, PI+) apoptotic cells were counted by flow cytometry (50,000 sorted events). (d) Quantification of Extended Data Fig. 7a,b. Bars represent mean ± s.e.m. of n = 3 biological replicates. P-values were calculated with one-tailed unpaired t-test assuming equal variance. Homoscedasticity was assessed with Bartlett’s test, and normality was assessed with the Shapiro-Wilk test.

References

    1. Hanahan D, Weinberg RA. Hallmarks of cancer: the next generation. Cell. 2011;144:646–74. - PubMed
    1. Otto T, Sicinski P. Cell cycle proteins as promising targets in cancer therapy. Nat Rev Cancer. 2017;17:93–115. - PMC - PubMed
    1. Nigg EA. Mitotic kinases as regulators of cell division and its checkpoints. Nat Rev Mol Cell Biol. 2001;2:21–32. - PubMed
    1. Marumoto T, Zhang D, Saya H. Aurora-A - a guardian of poles. Nat Rev Cancer. 2005;5:42–50. - PubMed
    1. Kettenbach AN, et al. Quantitative phosphoproteomics identifies substrates and functional modules of Aurora and Polo-like kinase activities in mitotic cells. Sci Signal. 2011;4:rs5. - PMC - PubMed

Publication types

MeSH terms