. 2020 Nov;17(11):1139-1146.
doi: 10.1038/s41592-020-0953-2. Epub 2020 Sep 28.

An optimized acetylcholine sensor for monitoring in vivo cholinergic activity

Affiliations

An optimized acetylcholine sensor for monitoring in vivo cholinergic activity

Miao Jing et al. Nat Methods. 2020 Nov.

Abstract

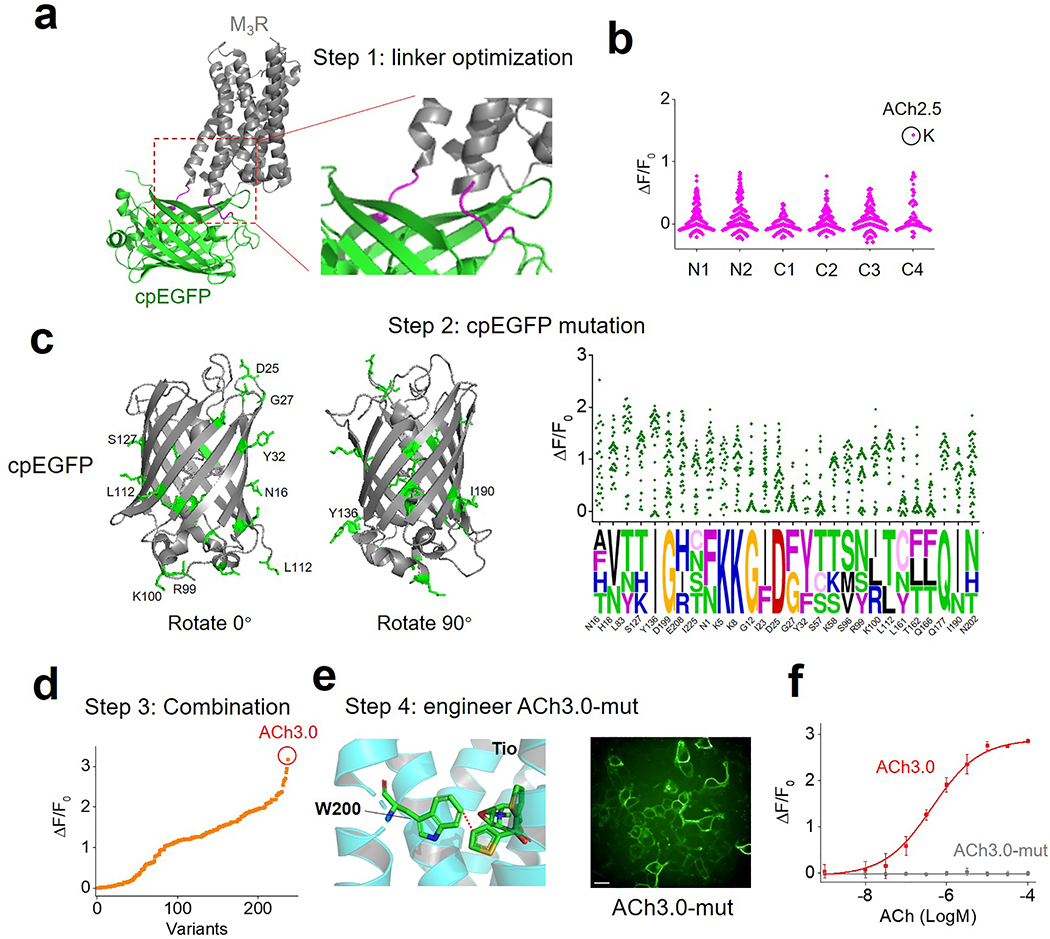
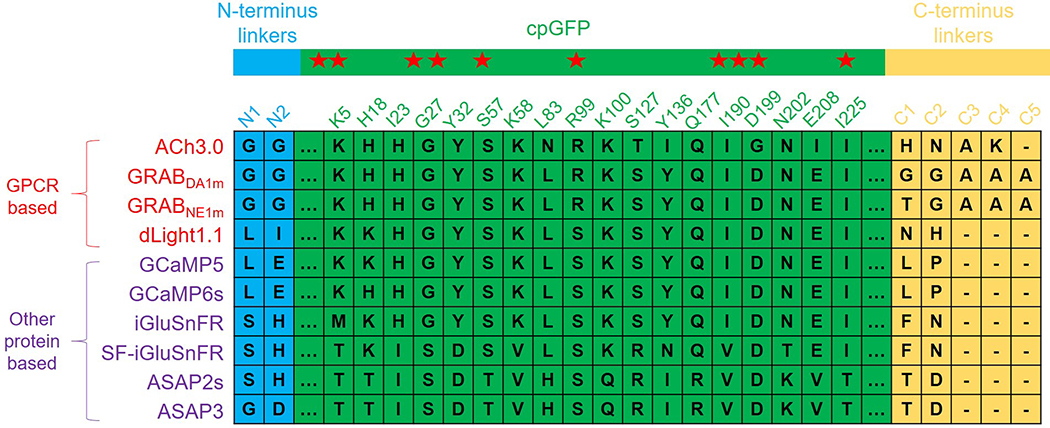
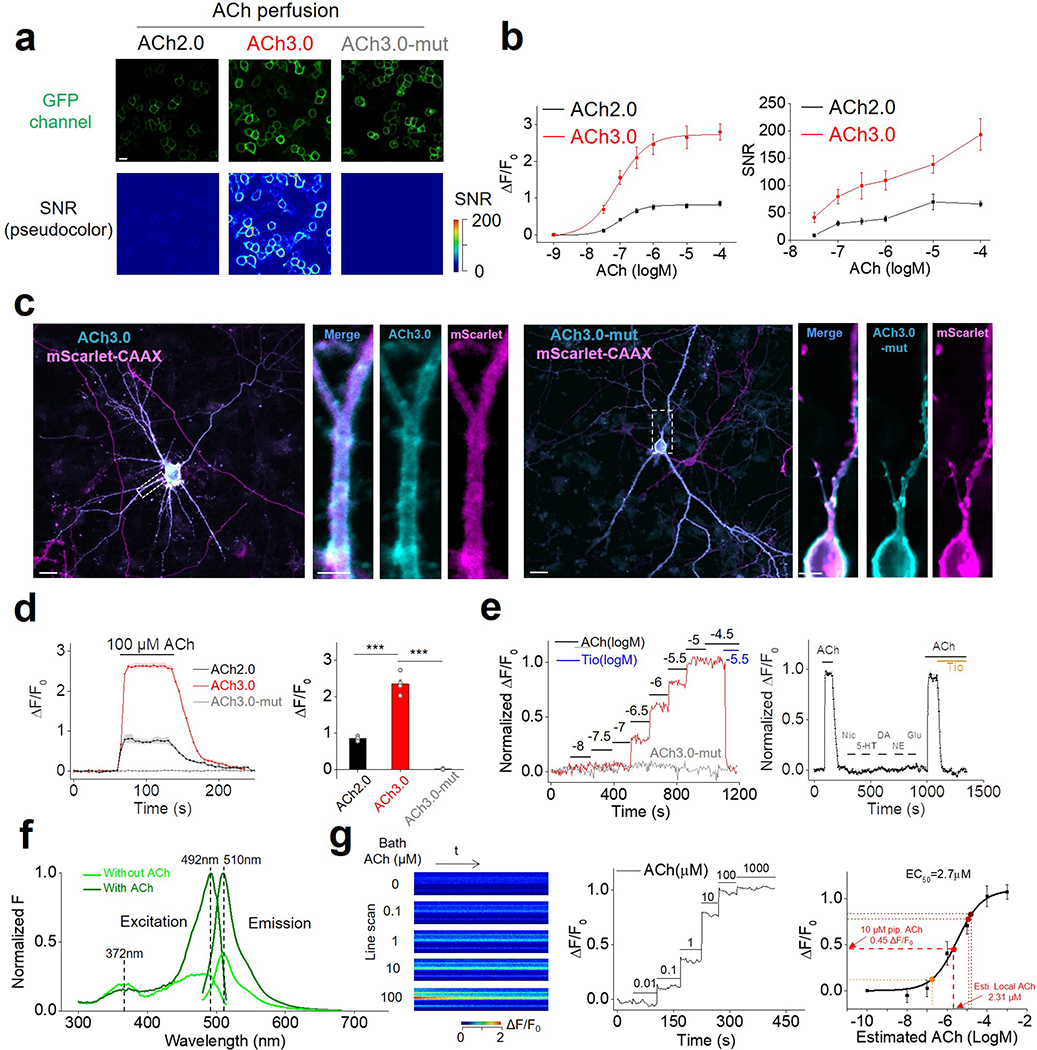
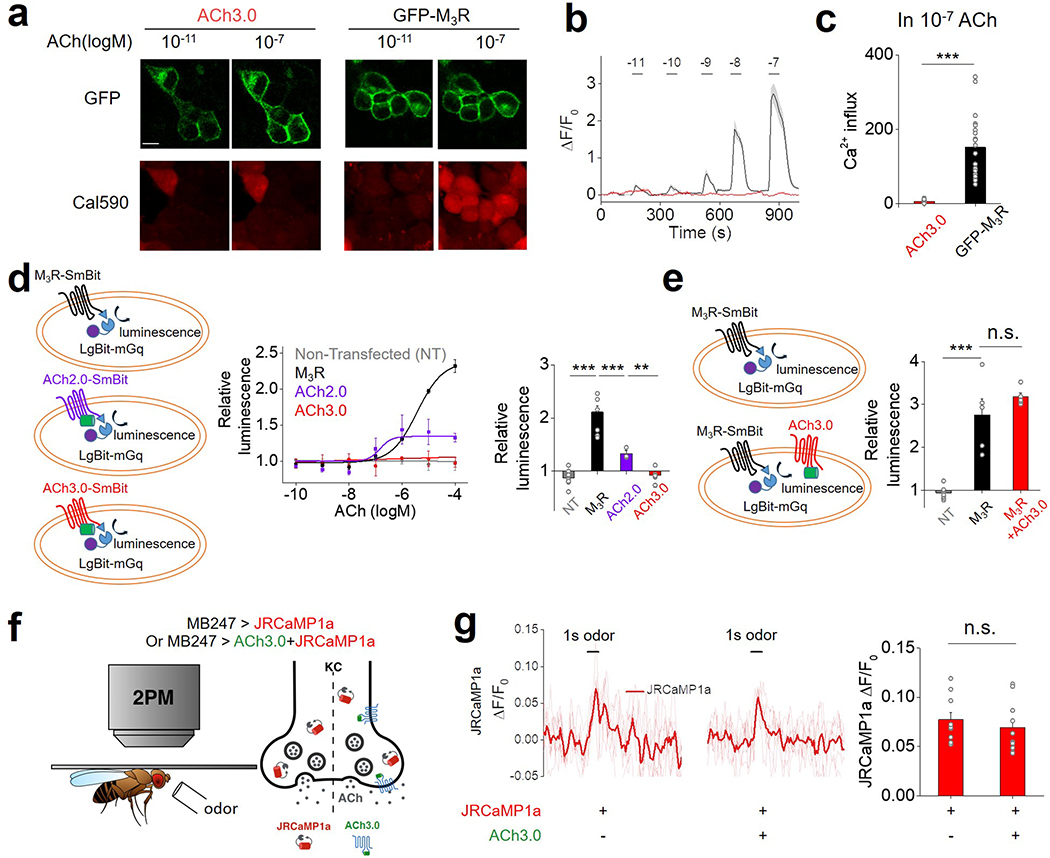
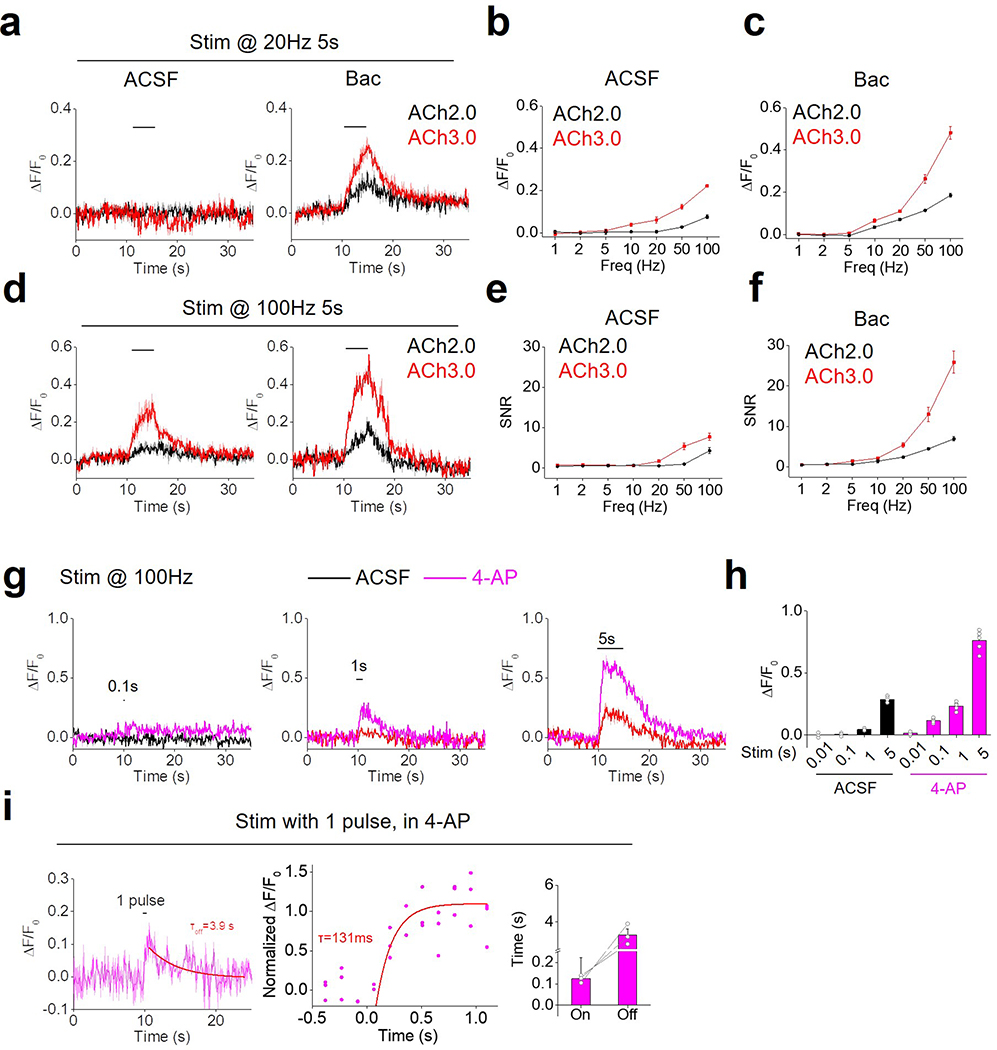
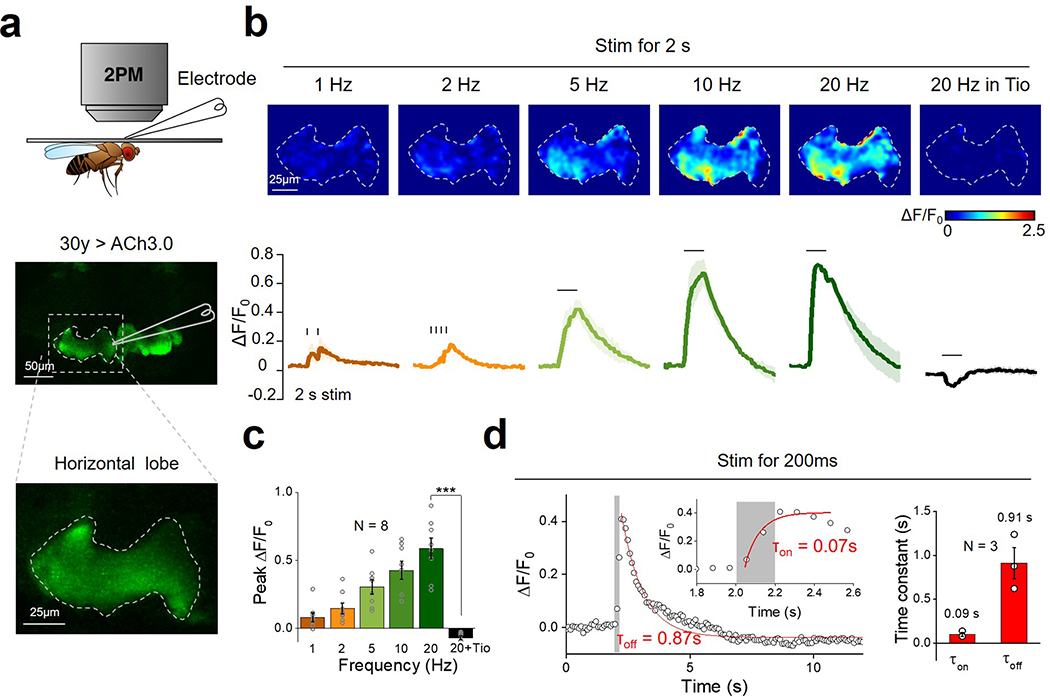
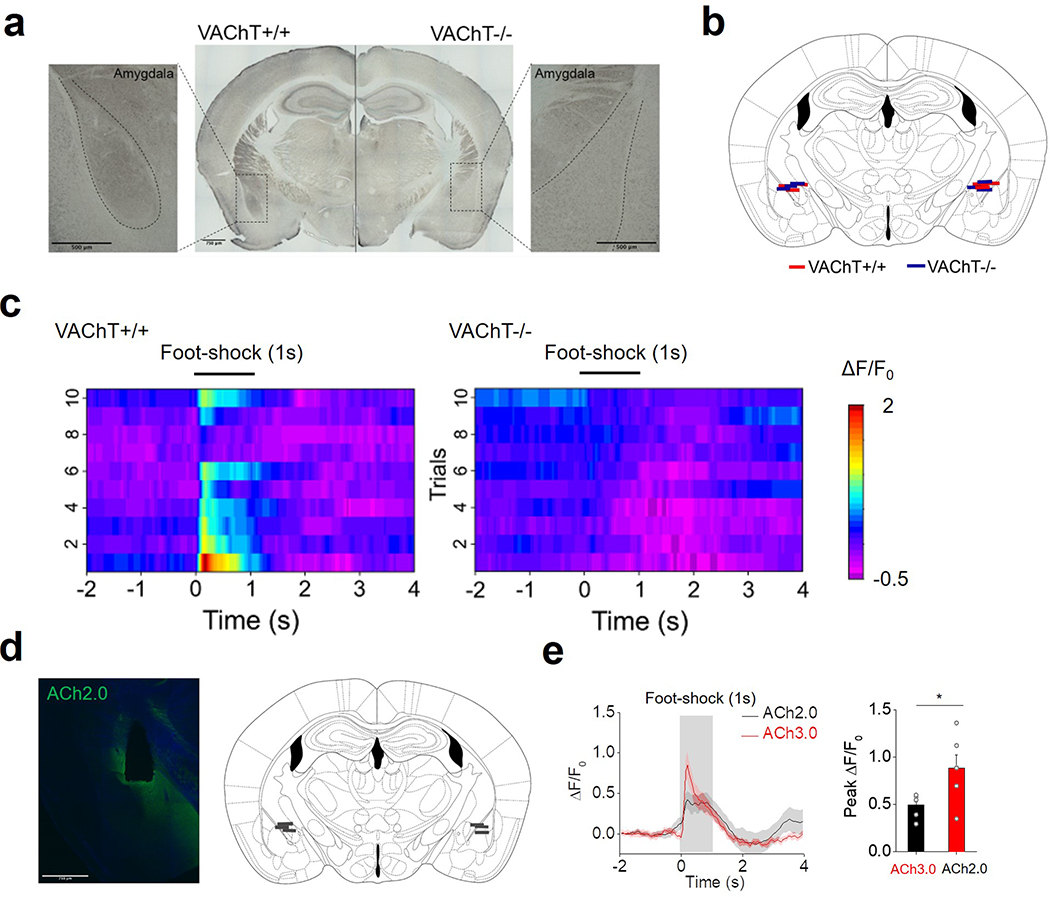
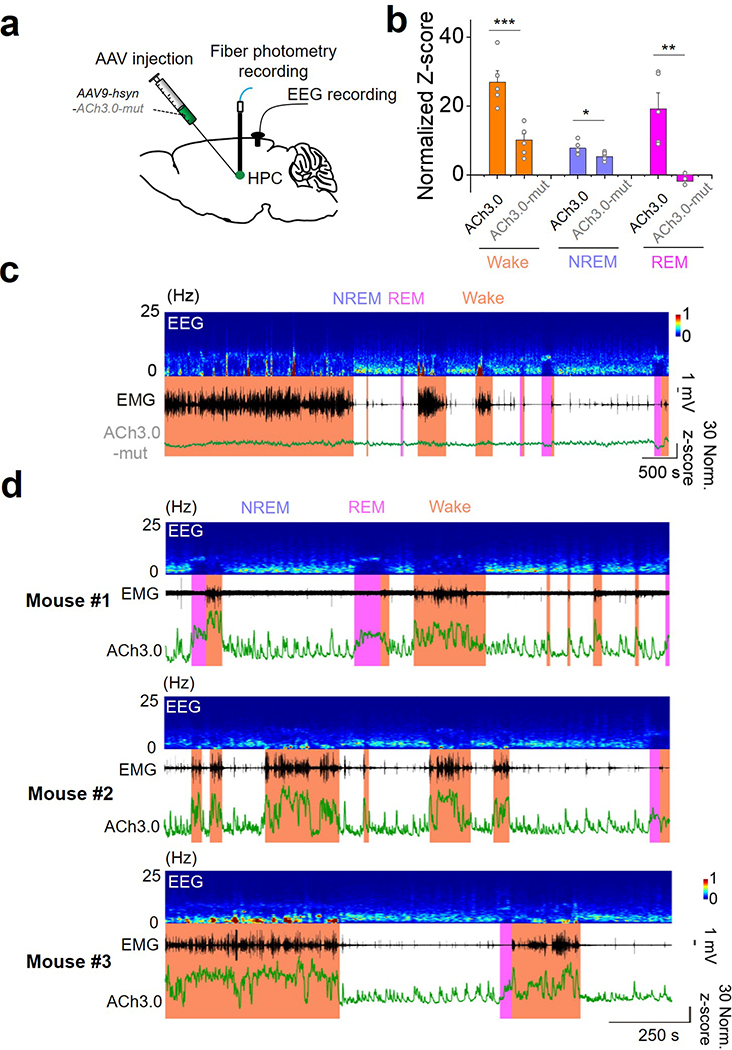
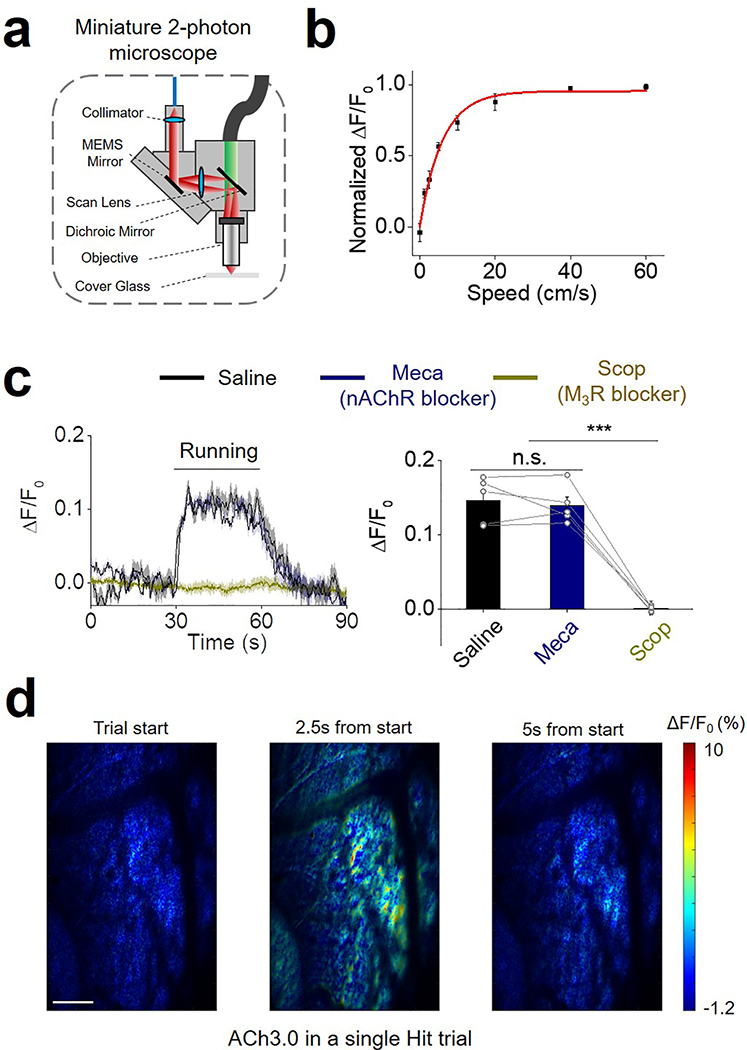
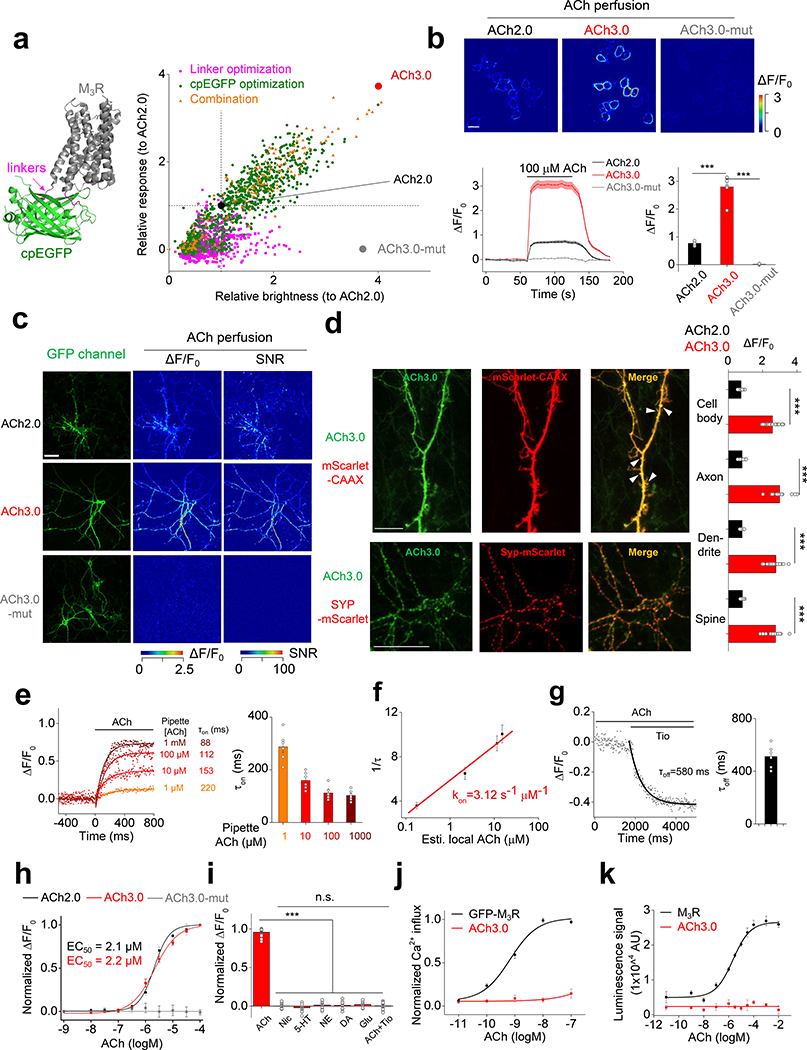
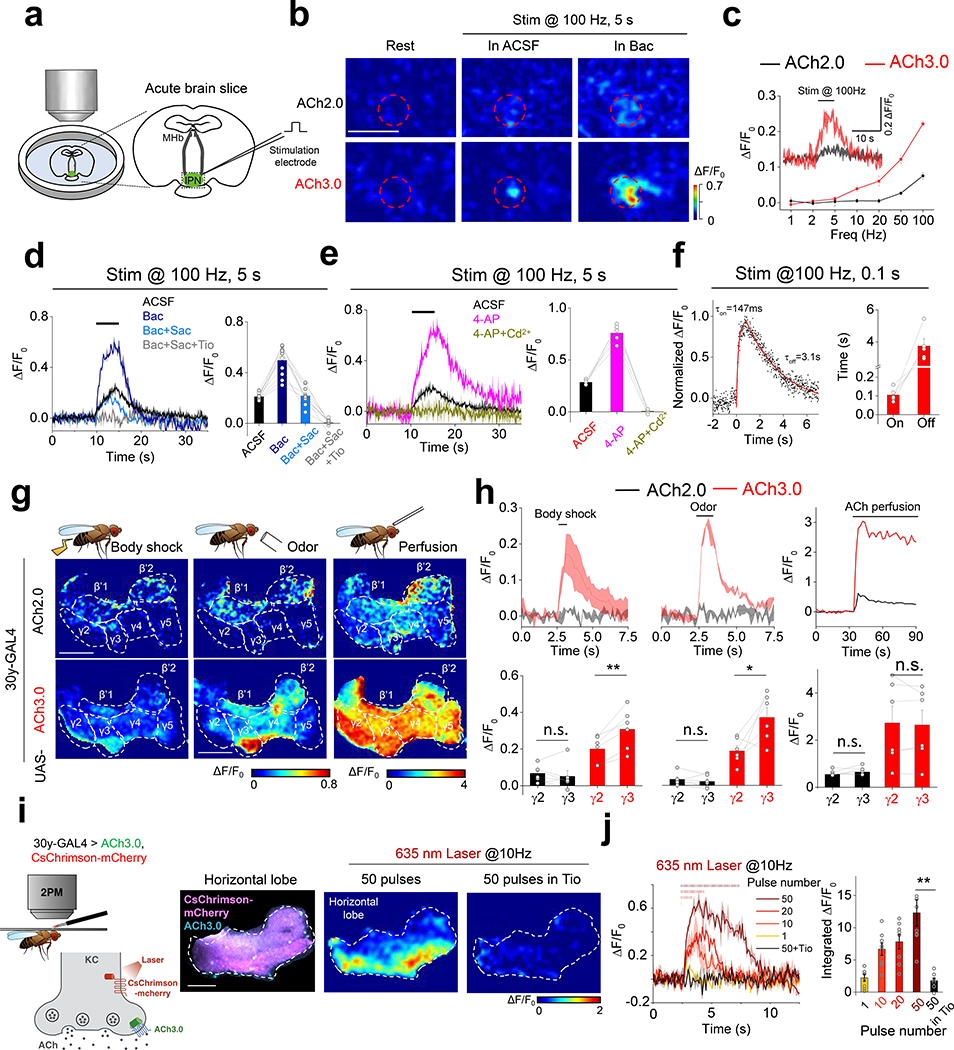
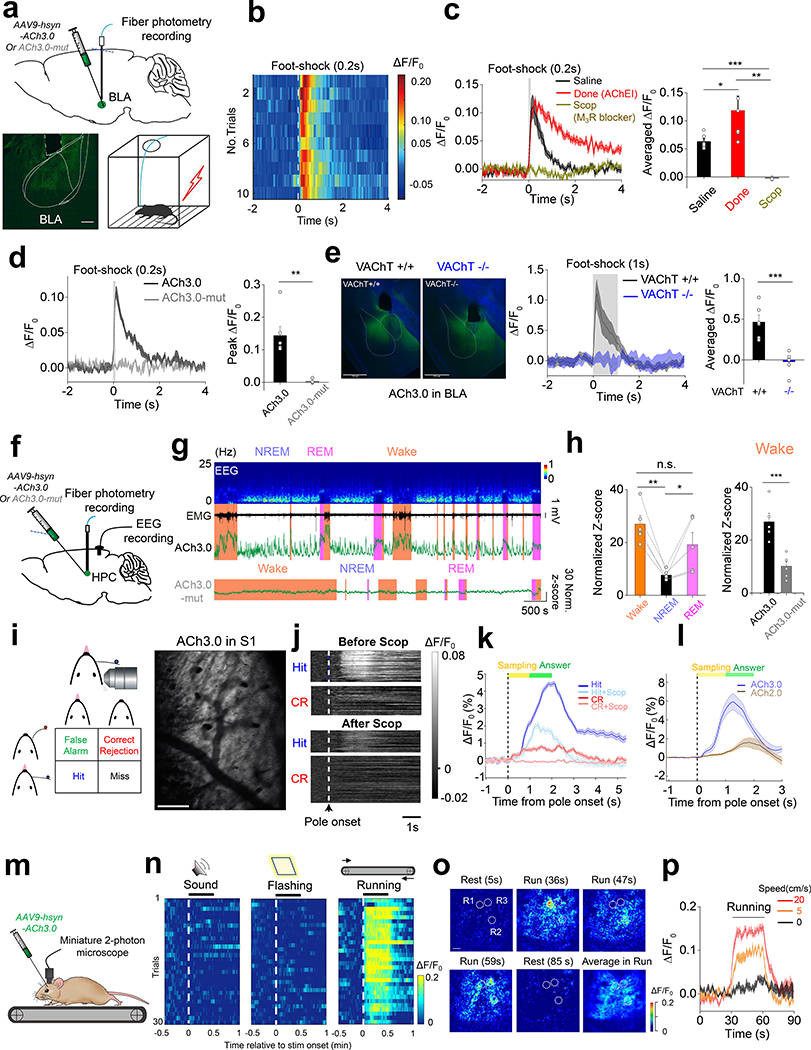
The ability to directly measure acetylcholine (ACh) release is an essential step toward understanding its physiological function. Here we optimized the GRABACh (GPCR-activation-based ACh) sensor to achieve substantially improved sensitivity in ACh detection, as well as reduced downstream coupling to intracellular pathways. The improved version of the ACh sensor retains the subsecond response kinetics, physiologically relevant affinity and precise molecular specificity for ACh of its predecessor. Using this sensor, we revealed compartmental ACh signals in the olfactory center of transgenic flies in response to external stimuli including odor and body shock. Using fiber photometry recording and two-photon imaging, our ACh sensor also enabled sensitive detection of single-trial ACh dynamics in multiple brain regions in mice performing a variety of behaviors.


Figures

Extended Data Fig. 1
Extended Data Fig. 1. The engineering process leading to the GRABACh3.0 sensor.
a: Schematic illustration depicting the predicted structure of the generic GRABACh sensor, with the linker region between the receptor (M3R) and cpEGFP magnified at the right and shown in magenta. The crystal structures are from protein database (PDB) archive (PDB ID: 4DAJ for M3R; PDB ID: 3EK4 for cpGFP). b: Site-directed mutagenesis of residues in the N and C termini of the linker region. The numbers indicate amino acid positions in the linker region (the first on N-terminus as N1, and the first on C-terminus as C1). The candidate with the best response is shown in a black circle and is called ACh2.5, with the C4 residue mutated to K; this candidate is used for further engineering steps. c: Left: crystal structure of the cpEGFP moiety in the ACh3.0 sensor; targeted residues for mutagenesis screening are indicated in green and the corresponding amino acid labeled on the structure. Right, the fluorescence response of the indicated mutant candidate sensors is shown on top, with the sequences of the bestperforming candidates on the bottom; the relative size of each letter reflects the probability of that amino acid in the sequence. The residues are named by the amino acid followed by the position in cpGFP (the first amino acid in cpGFP as N1). The crystal structures are from protein database (PDB) archive (PDB ID: 3EK4 for cpGFP). d: The fluorescence response of each candidate ACh sensor with combined mutations from the bestperforming sites in the linker and cpEGFP. Each point is calculated from the average of >100 cells. e: left, illustration of the ligand binding pocket in M3R, which was mutated from W to A. Right, fluorescence image of HEK293T cells expressing ACh3.0-mut. f: The fluorescence response of ACh3.0 and ACh3.0-mut to indicated concentration of ACh applied (n=3 wells for each point, with each well averaging >100 cells). Scale bar represents 10 μm. All data are shown as mean value +/− SEM, with the error bars or shaded regions indicating SEM.
Extended Data Fig. 2
Extended Data Fig. 2. The summary of amino acids in linkers and critical residues within cpGFP in different genetically encoded sensors, including GPCR-based sensors and other protein backbone-based sensors.
Extended Data Fig. 3
Extended Data Fig. 3. Characterization of ACh2.0 and ACh3.0.
a: The fluorescence response of ACh2.0, ACh3.0, and ACh3.0-mut to 100 μM ACh in HEK293T cells. The fluorescence images are shown on top, and corresponding pseudocolor images representing the signal-to-noise ratio (SNR) are shown at the bottom. Similar results as the representative images were observed for more than 7 cells. Scale bars represent 10 μm. b: The peak fluorescence response (ΔF/F0, left) and SNR (right) of ACh2.0 (black) and ACh3.0 (red) are measured with the indicated concentrations of ACh; n=8 and 7 cells for ACh2.0 and ACh3.0, respectively. c: Example fluorescence images of ACh3.0 (left) and ACh3.0-mut (right) expressed in cultured rat cortical neurons. Membrane-targeted mScarlet-CAAX is coexpressed and used to confirm expression at the plasma membrane. Similar results as the representative images were observed for more than 5 neurons. Scale bars represent 10 μm in the original image and 5 μm in the magnified images. d: Representative traces (left) and group summary (right) of the fluorescence response of ACh2.0, ACh3.0, and ACh3.0-mut expressed in cultured neurons; where indicated, 100 μM ACh is applied to the cells (n=4, 5, and 7 neurons for ACh2.0, ACh3.0, and ACh3.0-mut, respectively), p=9.45E-5 between ACh2.0 and ACh3.0; p=6.42E-5 between ACh3.0 and ACh3.0-mut. e: Left, representative traces of the normalized fluorescence change in ACh3.0 (red) and ACh3.0-mut (gray) in response to application of the indicated concentrations of ACh. Note that the ACh-induced fluorescence response in ACh3.0 is blocked by the M3R antagonist tiotropium (Tio, 3 μM). Right, representative trace of the normalized fluorescence change in ACh3.0 in response to indicated compounds. ACh: 100 μM; nicotine (Nic): 50 μM; 5-HT: 1 μM; norepinephrine (NE): 10 μM; dopamine (DA): 20 μM; glutamate (Glu): 10 μM; and Tio: 2 μM. Similar results as the representative images were observed for more than 5 neurons. f: The excitation and emission spectra of ACh3.0 sensor in the absence (light green) and presence of ACh (100 μM, dark green). g: Left, pseudocolor images showing the fluorescence response of ACh3.0 in confocal line scanning mode, with indicated concentrations of ACh applied by bath application. Middle, exemplar fluorescence response trace of ACh3.0 to different concentrations of ACh applied. Right, group data of the ACh3.0 dose-dependent fluorescence response in line scanning mode (from n=4 coverslips), which is used to estimate the local ACh concentration reaching the cells during kinetics experiments. The steady-state fluorescence response of ACh3.0 to puffed ACh are shown and calibrated based on the curve, with the detail numbers of 10 μM pipette ACh list as an example (pipette short as pip.; Estimated short as Esti.) All data are shown as mean value +/− SEM, with the error bars or shaded regions indicating SEM. Two-sides Student’s t test performed in (d); ***p<0.001.
Extended Data Fig. 4
Extended Data Fig. 4. The GRABACh3.0 sensor produces negligible downstream signaling.
a-c: HEK293T cells expressing either a GFP-tagged M3R construct or ACh3.0 are loaded with the red Ca2+ dye Cal590 (a), and the change in Cal590 fluorescence is measured in response to various concentrations of ACh (b). The Ca2+ influx is calculated as the integration of Cal590 fluorescent signal (ΔF/F0) to ACh application. The group summary data for Ca2+ influx measured in response to 0.1 μM ACh are shown in panel c; n=21 and 15 cells for GFP-M3R and ACh3.0, respectively, p=1.06E-7. d: Left, cartoon illustrating the experimental design of the luciferase complementation assay, in which cells expressed M3R-SmBit or ACh2.0/3.0-SmBit together with LgBit-mGq. Middle, the luminescence signal measured in non-transfected HEK293T cells (NT), cells expressing ACh2.0/ACh3.0-SmBit, or cells expressing M3R-SmBit in response to application of the indicated concentrations of ACh, normalized to the signal measured in control buffertreated cells (n=6 wells for NT; n=6 wells for M3R; n=3 wells for ACh2.0; n=6 wells for ACh3.0, with >100 cells in each well). Right, group summary of the luminescence signal measured in response to 100 μM ACh (n=6 wells for NT; n=6 wells for M3R; n=3 wells for ACh2.0; n=6 wells for ACh3.0, with >100 cells in each well; p=7.11E-7 between NT and M3R; p=9.95E-7 between M3R and ACh2.0; p=0.003 between ACh2.0 and ACh3.0). e: Similar to (d), except the luminescence signal is measured in HEK293T cells expressing M3R-SmBit or cells expressing both M3R-SmBit and ACh3.0. The group summary at the right shows the luminescence signal in response to 100 μM ACh; n=5–8 wells per group, with each group averaging >100 cells, p=7.95E-5 between NT and M3R; p=0.33 between M3R and M3R+ACh3.0. f: Schematic cartoon depicting two-photon imaging of transgenic flies in response to odorant stimulation. Ca2+ influx is measured by expressing jRCaMP1a either alone or together with ACh3.0 in the Kenyon cells (KC) of the mushroom body. g: Representative fluorescence traces (left) and group summary (right) of jRCaMP1a fluorescence measured in response to odorant application in flies expressing jRCaMP1a either alone or together with ACh3.0; n=10 flies per group, p=0.49. All data are shown as mean value +/− SEM, with the error bars or shaded regions indicating SEM. Scale bar represents 10 μm. Two-sides Student’s t test performed in (c), (d), (e) and (g); ***p<0.001 and n.s., not significant.
Extended Data Fig. 5
Extended Data Fig. 5. Probing endogenous ACh release in mouse brain slices.
a-f: Representative fluorescence traces (a, d) and group summary (b, c, e, f) of the fluorescence change (ΔF/F0 and SNR) in neurons expressing either ACh2.0 or ACh3.0 in response to electrical stimulation in MHb-IPN brain slices. The slices are bathed in either ACSF or 2 μM baclofen (Bac). N=5 slices from 3 mice for ACh2.0, and n=10 slices from 7 mice for ACh3.0. g-h: The representative fluorescence traces (g) and group data (h) of ACh3.0-expressing neurons in response to 100-Hz electrical stimulation with different stimulation times in MHb-IPN brain slices. The response in either ACSF or 100 μM 4-AP is measured and summarized; n=5 slices from 5 mice. i: The kinetics of fluorescence response of ACh3.0 to a single pulse (2ms) of electrical stimulation in the presence of 100 μM 4-AP. The response in three independent experiments are normalized and plotted together in the middle. The group data of on and off response time constants are summarized on the right (n=3 slices from 3 mice). All data are shown as mean value +/− SEM, with the error bars or shaded regions indicating SEM.
Extended Data Fig. 6
Extended Data Fig. 6. Monitoring in vivo Ach release induced by electrical stimulation in Drosophila.
a: Schematic illustration depicting the experiment in which a transgenic fly expressing ACh3.0 in the KC cells in the mushroom body is placed under a two-photon microscope, and a glass electrode is placed near the mushroom body and used to deliver electrical stimuli. The fly brain is bathed in AHLS containing 100 μM nicotinic acetylcholine receptor blocker mecamylamine (Meca). b: Pseudocolor images (top) and representative traces (bottom) of the fluorescence change in ACh3.0 in response to 2 s of electrical stimulation at the indicated frequencies. Where indicated, the M3R antagonist tiotropium (Tio, 10 μM) is applied to the bath solution. Similar results as the representative images were observed for 8 flies. c: Group summary of the data shown in panel (b); n=8 flies, p=0.0004. d: ACh3.0 fluorescence is measured before and after a 200-ms electrical stimulation, and the rise and decay phases are fitted with a single-exponential function; the time constants are indicated and summarized on the right; n=3 flies. All data are shown as mean value +/− SEM, with the error bars or shaded regions indicating SEM. Two-sides Student’s t test performed in (c); ***p<0.001.
Extended Data Fig. 7
Extended Data Fig. 7. Monitoring endogenous cholinergic signals in BLA of mice in vivo.
a: VAChT immunohistochemistry is performed in coronal mouse sections obtained from a control (VAChT+/+) mouse (left) and a VAChT−/− mouse (right). The insets show magnified views of cholinergic terminals in the basolateral amygdala (BLA). Similar results as the representative images were observed for 6 mice. Scale bars represent 500 μm. b: Diagram summarizing the location of the optic fiber terminals in the BLA of VAChT+/+ (red) and VAChT−/− mice (blue); n=6 mice per group. This image is modified from the brain map in Allen mouse brain atlas (Allen Mouse Brain Atlas (2004), Allen Institute for Brain Science). c: Pseudocolor image showing the change in ACh3.0 fluorescence measured in the BLA of VAChT+/+ mice (left) and VAChT−/− mice (right) in response to a 1-s footshock; ten consecutive trials are shown. d, e: The comparison of ACh2.0 and ACh3.0 fluorescence response in BLA of mice to foot-shock stimuli. The fluorescence signal showing the expression of ACh2.0 and the fiber photometry recording sites are shown in (d). Fluorescence traces and group data of the 1s foot-shock induced fluorescence response in ACh2.0 (black) and ACh3.0 (red) are shown in (e) (n=6 mice each for ACh3.0 and ACh2.0, p=0.04). Scale bar: 750 μm. All data are shown as mean value +/− SEM, with the error bars or shaded regions indicating SEM. Two-sides Student’s t test performed in (e); *, p<0.05.
Extended Data Fig. 8
Extended Data Fig. 8. Recording of Ach signal during sleepwake cycle.
a: The schematic illustration and representative recording data of ACh3.0-mut sensor during the sleep-wake cycle in mice. b: The group data of the fluorescence response of ACh3.0 and ACh3.0-mut sensors in different sleep-wake status (n=5 mice for ACh3.0 and n=6 mice for ACh3.0-mut, p=0.0009 in wake; p=0.049 in NREM; p=0.008 in REM). c: The representative recording data of ACh3.0-mut sensor during the sleep-wake cycle in mice. Similar results as the representative images were observed for 6 mice. d: Multiple recording traces of the ACh3.0 sensor during the sleep-wake cycle (from 3 mice, additional to the representative one in Fig. 3g). All data are shown as mean value +/− SEM, with the error bars or shaded regions indicating SEM. Two-sides Student’s t test performed in (b); *, p<0.05; **, p<0.01; ***, p<0.001.
Extended Data Fig. 9
Extended Data Fig. 9. Imaging of ACh signal in the cortex.
a: Cartoon illustration of the miniature two-photon microscope. b: Group data of ACh3.0 fluorescence in mice recorded while running on a treadmill at indicated speeds (n=5 mice). c: Representative traces and group summary of ACh3.0 fluorescence measured in mice while performing the running task; where indicated, the mice receive an i.p. injection of saline (black), the nAChR blocker mecamylamine (Meca, 2 mg/kg body weight, blue), or theM3R antagonist scopolamine (Scop, 20 mg/kg body weight, dark yellow); each trace is averaged from 10 trials; n=5 mice per group, p=0.54 between Saline and Meca; p=0.0002 between Meca and Scop. d: Pseudocolor images showing the ACh3.0 fluorescence response in the S1 in the Hit trial of the whisker-guided object location discrimination task. The left, middle and right image showing the response during baseline, peak in the answer period and after response. Similar results as the representative images were observed for 3 mice. Scale bar: 100 μm. All data are shown as mean value +/− SEM, with the error bars or shaded regions indicating SEM. Two-sides Student’s t test performed in (c); *p<0.05, **p<0.01, ***p<0.001, and n.s., not significant.
Figure 1:
Figure 1:
Optimization and in vitro characterization of next-generation GRABACh sensors. a: Left: cartoon illustration showing the predicted structure of GRABACh sensors. Right: site-directed random mutagenesis is performed in linkers between the receptor and cpEGFP (magenta), cpEGFP (green), or both (orange), and the performance of each variant (relative to ACh2.0, black) is calculated and plotted. The final optimized sensor, ACh3.0 is indicated in red, and the ligand-insensitive ACh3.0-mut sensor (with W200A mutation) is indicated in gray. Each data point represents the average response measured in >100 cells per candidate. The “relative response” is calculated by considering ΔF/F0 of ACh2.0 as 1 and normalizing ΔF/F0 of each candidate to that. The “relative brightness” is calculated similarly. The crystal structures are from the protein database (PDB) archive (PDB ID: 4DAJ for M3R; PDB ID: 3EK4 for cpGFP). b: The performance of the ACh2.0, ACh3.0, and ACh3.0-mut sensors expressed in HEK293T cells in response to 100 μM ACh upon confocal imaging. Top: pseudocolor images of the peak response (ΔF/F0) in the presence of 100 μM ACh. Bottom: representative traces and group data; n=5, 7, and 4 coverslips for ACh2.0, ACh3.0, and ACh3.0-mut, respectively, with an average of >20 cells per coverslip, p=6.2E-6 for ACh2.0 and ACh3.0; p=9.9E-6 for ACh3.0 and ACh3.0-mut. c: The performance of the ACh2.0, ACh3.0 and ACh3.0-mut sensors expressed in cultured rat cortical neurons in response to 100 μM ACh. The raw GFP fluorescence and pseudocolor images of the peak response to ACh (ΔF/F0) and signal-to-noise ratio (SNR) are shown. Similar results as the representative images were observed for more than 10 neurons. d: Left: representative images of ACh3.0 expressed together with synaptophysin (Syp) or CAAX fused to mScarlet. Dendritic spines are indicated by white arrowheads. Right: group data summarizing the fluorescence response of ACh2.0 (black bars) and ACh3.0 (red bars) to 100 μM ACh measured in the indicated neuronal compartments (cell body: n=11 cells for ACh2.0 and n=18 cells for ACh3.0, p=5.1E-14; axon: n=8 cells for ACh2.0 and n=14 cells for ACh3.0, p=2.3E-13; dendrite: n=18 cells for ACh2.0 and n=26 cells for ACh3.0, p=4.6E-15; spine: n=10 cells for ACh2.0 and n=16 cells for ACh3.0, p=1.5E-13). e: The raising kinetics of ACh3.0 fluorescence signal in HEK293T cells to locally puffed ACh at the indicated concentrations in the puffing pipette. The actual concentrations reaching the cell are calibrated in Extended Data Fig. 3g based on the peak fluorescence response of ACh3.0. Representative traces and group data are shown (n=6 cells for 1 μM ACh; n=6 cells for 10 μM ACh; n=8 cells for 100 μM ACh; n=6 cells for 1000 μM ACh). f: The association rate constant of the ACh3.0 sensor to ACh. Local ACh concentrations are estimated based on the dose-dependent fluorescence response of ACh3.0 (n=6 cells for 1 μM ACh; n=6 cells for 10 μM ACh; n=8 cells for 100 μM ACh; n=6 cells for 1000 μM ACh; ACh concentrations here indicate those in the puffing pipette). g: The decay kinetics of the ACh3.0 fluorescence signal when locally puffed with antagonist Tio (10 μM) to cells bathed in ACh (100 μM). Representative traces and group data are shown (n=6 cells from 6 coverslips). h: Dose-response relations for the fluorescence response of ACh2.0 (black), ACh3.0 (red), and ACh3.0-mut (gray) to ACh, with corresponding EC50 values (n=11,12 and 16 neurons for ACh2.0, ACh3.0 and ACh3.0-mut, respectively). i: The fluorescence response of ACh3.0 to the indicated compounds (n=12 neurons each). ACh: 100 μM; nicotine (Nic): 50 μM; 5-HT: 1 μM; norepinephrine (NE): 10 μM; dopamine (DA): 20 μM; glutamate (Glu): 10 μM; and tiotropium (Tio): 2 μM, p=3.5E-14; 2.0E-14; 2.3E-14; 7.2E-14; 6.9E-14; 7.5E-14 between ACh and Nic, 5-HT, NE, DA, Glu, ACh+Tio, respectively. j: The normalized Ca2+ response to ACh in HEK293T cells expressing GFP-M3R or ACh3.0. Each data point is averaged from n=10 cells. k: The β-arrestin dependent luminescence signal in HEK293T cells expressing GFP-M3R or ACh3.0 in response to ACh at the indicated concentration (n=6 wells in each group, with >100 cells per well). All data are shown as mean value +/− SEM, with the error bars or shaded regions indicating SEM. Scale bars represent 10 μm, except 20 μm in c. Two-sides Student’s t test performed in (b), (d) and (i); ***p<0.001 and n.s., not significant.
Figure 2:
Figure 2:. Probing ACh dynamics in acute mouse brain slices and in vivo in Drosophila.
a: Schematic illustration depicting the two-photon imaging of acute MHb-IPN brain slices prepared from mice expressing ACh2.0 or ACh3.0 in the IPN. A bipolar electrode placed in the IPN is used to evoke endogenous ACh release. b: Pseudocolor images of the fluorescence response (ΔF/F0) of ACh2.0 and ACh3.0 to electrical stimuli (100 Hz for 5 s) in ACSF or 2 μM baclofen (Bac). The red dashed circles indicate the regions of interest (30 μm in diameter) used for quantification. Data are representative of 5–10 slices from 3–7 mice. c: Group summary of the fluorescence response of ACh2.0 and ACh3.0 to electrical stimuli at the indicated frequencies (n=11 slices from 8 mice). The inset shows representative traces of ACh2.0 and ACh3.0 in response to 100-Hz electrical stimulation. d: Representative traces and group summary of the fluorescence response of ACh3.0 to electrical stimulation in either ACSF or the indicated drugs; n=5 slices from 5 mice per group. Baclofen (Bac): 2 μM; saclofen (Sac): 100 μM; and tiotropium (Tio): 10 μM. e: Representative traces and group summary of the fluorescence response of ACh3.0 to electrical stimulation in ACSF, 4-AP (100 μM), or 4-AP with Cd2+ (100 μM); n=5 slices from 5 mice per group. f: Fluorescence traces of ACh3.0 in response to 100-ms electrical stimulation. The rise and decay phases of the fluorescence signals are fitted to a single-exponential function, and the time constants are summarized on the right; n=5 slices from 5 mice per group. g: Pseudocolor images of the peak fluorescence response in the mushroom body horizontal lobe in transgenic flies expressing ACh2.0 or ACh3.0 during body shock (left), odorant application (middle), and exogenous ACh perfusion (right). Similar results as the representative images were observed for more than 5 flies. h: Top: fluorescence traces measured in the mushroom body in transgenic flies expressing ACh2.0 (black) or ACh3.0 (red); where indicated, body shock, odorant stimulation, or ACh is applied. Bottom: group summary of the fluorescence responses measured in the γ2 and γ3 lobes in the mushroom body; n=6 flies per group, p=0.47 between γ2 and γ3 in ACh2.0 to shock; p=0.004 between γ2 and γ3 in ACh3.0 to shock; p=0.39 between γ2 and γ3 in ACh2.0 to odor; p=0.04 between γ2 and γ3 in ACh3.0 to odor. p=0.23 between γ2 and γ3 in ACh2.0 to ACh perfusion; p=0.61 between γ2 and γ3 in ACh3.0 to ACh perfusion. i: Left: schematic illustration depicting the experimental setup; CsChrimson-mCherry and ACh3.0 sensors are expressed in Kenyon cells (KCs) in the mushroom body, and 635-nm laser light is used to activate cholinergic KCs, the fly brain is bathed in AHLS containing 100 μM nicotinic acetylcholine receptor blocker mecamylamine (Meca). Right: fluorescence images and pseudocolor images of ACh3.0 sensors in response to 635-nm laser stimulation in the absence or presence of Tio (10 μM). Similar results as the representative images were observed for 8 flies. j: Representative traces and group summary of the fluorescence response of ACh3.0 to the indicated number of 635-nm laser pulses applied at 10 Hz; n=8 flies per group, p=0.006. All data are shown as mean value +/− SEM, with the error bars or shaded regions indicating SEM. Scale bars represent 50 μm (b) and 25 μm (g and i). Two-sides Student’s t test performed in (h) and (j); *, p<0.05, **, p<0.01, and n.s., not significant.
Figure 3:
Figure 3:. Monitoring in vivo ACh dynamics in mice.
a: Top: schematic diagram depicting the injection of an AAV encoding the ACh3.0 or ACh3.0-mut sensor into the basolateral amygdala (BLA); the fluorescence response is recorded using fiber-photometry. Bottom: fluorescence of the ACh3.0 sensor expressed in the BLA (left) and a cartoon illustration of the foot shock experiments (right). b: Pseudocolor fluorescence responses of ACh3.0 in the BLA to ten 0.2-s foot-shock stimuli at 0.4 mA. Similar results as the representative result were observed for 6 mice. c: Representative traces and group summary of the fluorescence response of ACh3.0 in the BLA of mice following an i.p. injection of saline (black), the acetylcholinesterase inhibitor donepezil (Done, red, 3 mg/kg body weight), or the M3R antagonist scopolamine (Scop, gray, 6 mg/kg body weight). The average fluorescence response is calculated using the 1-s mean fluorescence after the initiation of foot shock (n=6 mice per group), p=0.046 between Saline and Done; p=0.0047 between Done and Scop; p=4E-5 between Saline and Scop. d: Similar to (c), showing the fluorescence response of ACh3.0 and ACh3.0-mut to a 0.2-s foot-shock; n=6 and 4 mice for ACh3.0 and ACh3.0-mut, respectively, p=0.004. e: Left: fluorescence images of ACh3.0 expressed in the BLA of control mice (VAChT+/+, black) and VAChT forebrain knockout mice (VAChT−/−, blue). Middle and right: representative traces and group summary of the response measured in the BLA of VAChT+/+ and VAChT−/− mice to 1-s foot-shock; n=6 mice per group, p=0.0008. Scale bars represent 750 μm. f: Schematic diagram depicting the injection of an AAV resulting in the expression of ACh3.0 or ACh3.0-mut into the mouse hippocampus (HPC); fluorescence is recorded in the mice during the sleep-wake cycle. The placement of intracranial EEG recording electrodes is also indicated. g: Representative recording of EEG, EMG and ACh3.0 (upper) or ACh3.0-mut (bottom) fluorescence response during the sleep-wake cycle. The mouse’s sleep/wake status (wake, NREM sleep, or REM sleep) is determined using the EEG and EMG data and is indicated. The standard deviation of the signal during NREM sleep when there was no apparent fluctuation in the signal is used for normalization to calculate the normalized Z-score (see Methods for detail). h: Left, group summary of the ACh3.0 fluorescence response (expressed as a normalized Z-score) in mice while awake and during NREM and REM sleep; n=5 mice per group. Right, the comparison of fluorescence response between ACh3.0 and ACh3.0-mut in wake status (n=5 mice for ACh3.0 and n=6 mice for ACh3.0-mut) of mice. P=0.0025 between wake and NREM; p=0.045 between NREM and REM; p=0.19 between wake and REM; p=0.0009 between ACh3.0 and ACh3.0-mut. The comparison of ACh3.0 and ACh3.0-mut in other sleep status is summarized in Extended Data Figure 8. i: Left, cartoon illustration of the head-fixed whisker-guided object localization task. Right, two-photon imaging of ACh sensors expressed in layer 2 of S1 cortex. Scale bar, 100 μm. Similar results as the representative images were observed for 3 mice. j: Pseudocolor images showing the representative fluorescence response of ACh3.0 on Hit and Correct Rejection (CR) trials during the task, before and after i.p. injection of scopolamine (Scop, 5mg/kg). Similar results as the representative images were observed for 3 mice. k: Average fluorescence response of ACh3.0 on Hit and Correct Rejection (CR) trials, before and after scopolamine (Scop) injection (n=3 mice). l: Average fluorescence response comparing the ACh2.0 or ACh3.0 sensors on Hit trials (n=3 mice per group). m: Schematic illustration depicting the experiment in which mice expressing ACh3.0 in the visual cortex are placed on a treadmill and ACh3.0 fluorescence is recorded using the miniature two-photon microscope. n: Pseudocolor fluorescence responses of ACh3.0 to an auditory stimulus (30 s of a 7000-Hz tone, left), a visual stimulus (30-s of flashing light at 2 Hz, middle), or running on the treadmill (right). The responses of 30 consecutive trials are recorded and are plotted relative to the onset of each stimulus. o: Pseudocolor images showing the spatial-temporal distribution of ACh3.0 fluorescence during locomotion from a single trial. R1, R2 and R3 are three representative ROIs (40 μm in diameter) indicating spatially selective ACh signals at indicated time point during running. The averaged fluorescent signal during entire running process is also shown. Scale bar, 50 μm. Similar results as the representative images were observed for 5 mice. p: Representative traces of ACh3.0 fluorescence in mice recorded while running on a treadmill at the indicated speeds; each trace is averaged from 10 trials. All data are shown as mean value +/− SEM, with the error bars or shaded regions indicating SEM. Two-sides Student’s t test performed in (c), (d), (e) and (h); *p<0.05, **p<0.01, ***p<0.001, and n.s., not significant.

References

    1. Dale HH The action of certain esters and ethers of choline, and their relation to muscarine. Journal of Pharmacology and Experimental Therapeutics 6, 147–190 (1914).
    1. Hasselmo ME The role of acetylcholine in learning and memory. Current opinion in neurobiology 16, 710–715 (2006). - PMC - PubMed
    1. Winkler J, Suhr S, Gage F, Thal L & Fisher L Essential role of neocortical acetylcholine in spatial memory. Nature 375, 484 (1995). - PubMed
    1. KrnjeviĆ K & Miledi R Acetylcholine in Mammalian Neuromuscular Transmission. Nature 182, 805–806 (1958). - PubMed
    1. Magleby KL & Stevens CF A quantitative description of end-plate currents. The Journal of Physiology 223, 173–197 (1972). - PMC - PubMed

Publication types

MeSH terms

LinkOut - more resources