. 2020 Oct;52(10):1018-1023.
doi: 10.1038/s41588-020-0699-x. Epub 2020 Sep 28.

Haplotype-resolved genome analyses of a heterozygous diploid potato

Affiliations

Haplotype-resolved genome analyses of a heterozygous diploid potato

Qian Zhou et al. Nat Genet. 2020 Oct.

Abstract

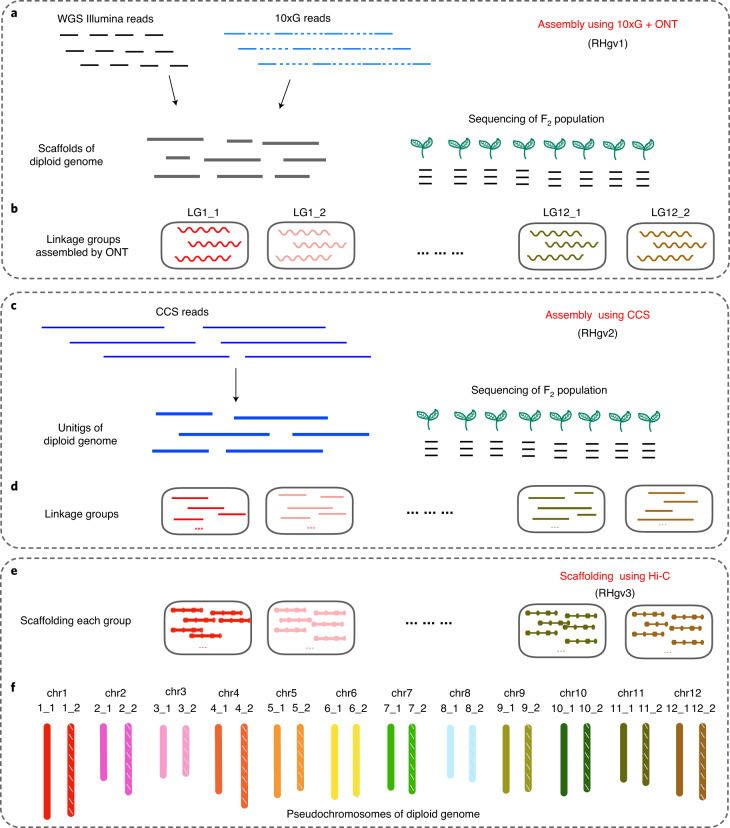
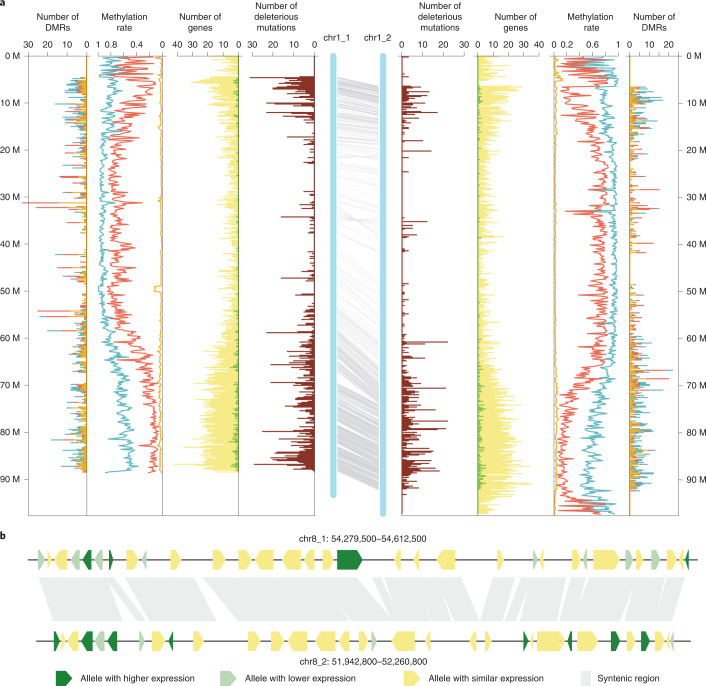
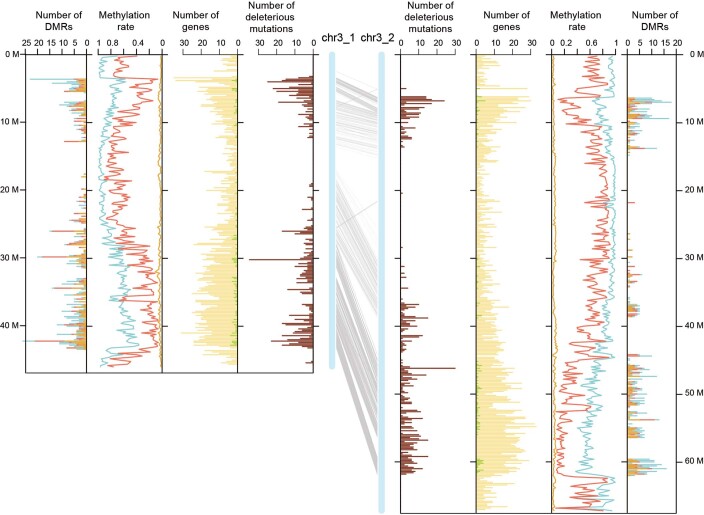
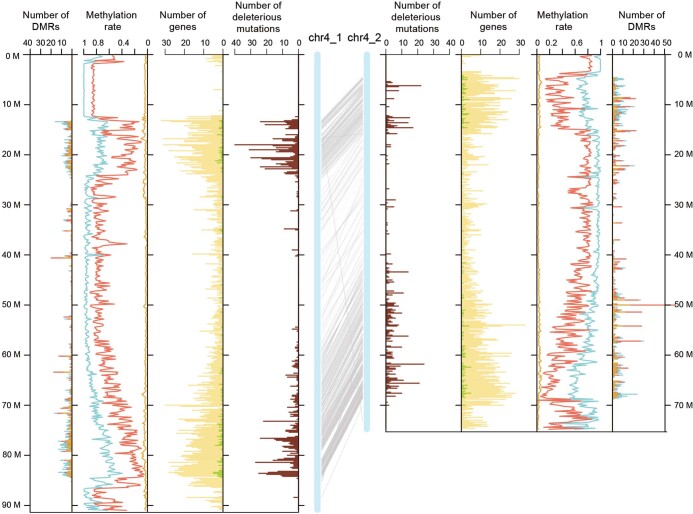
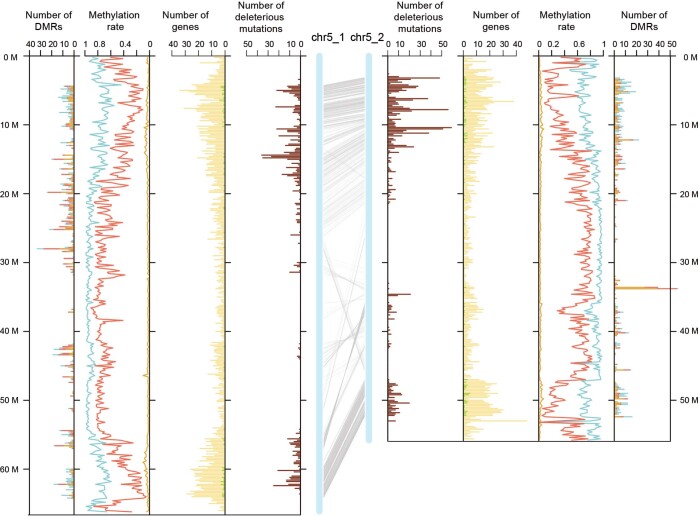
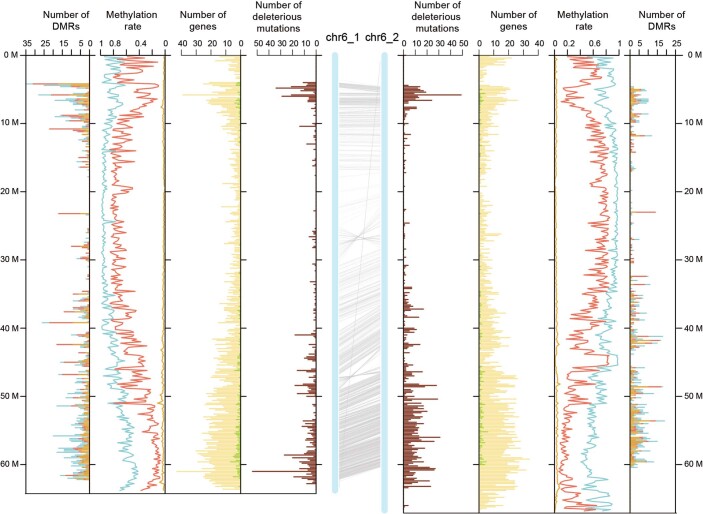
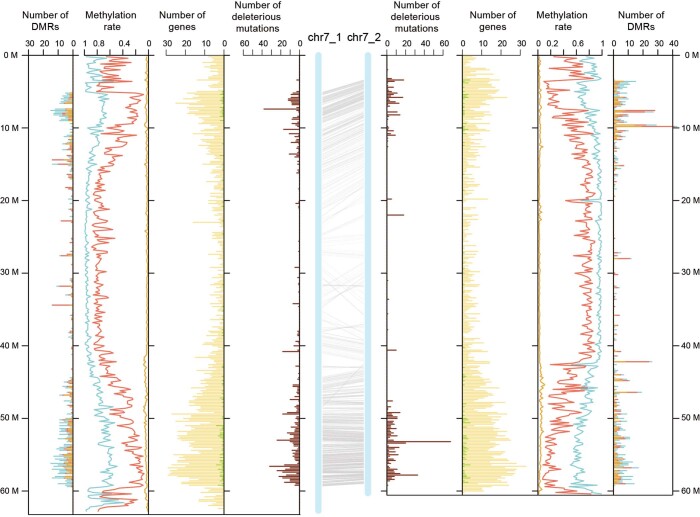
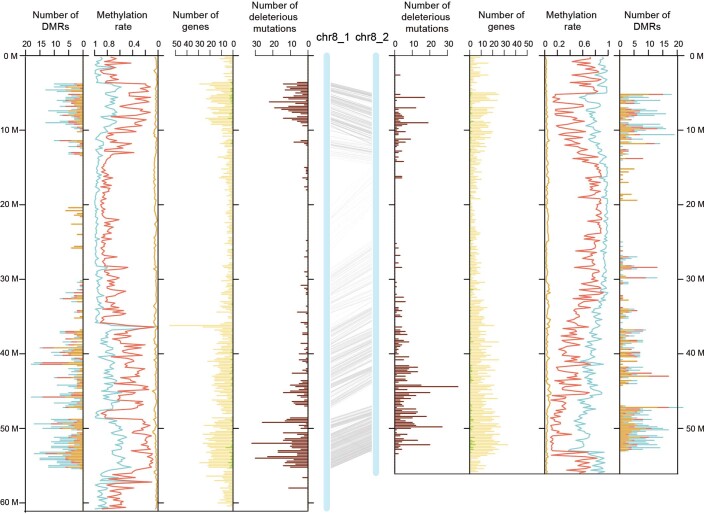
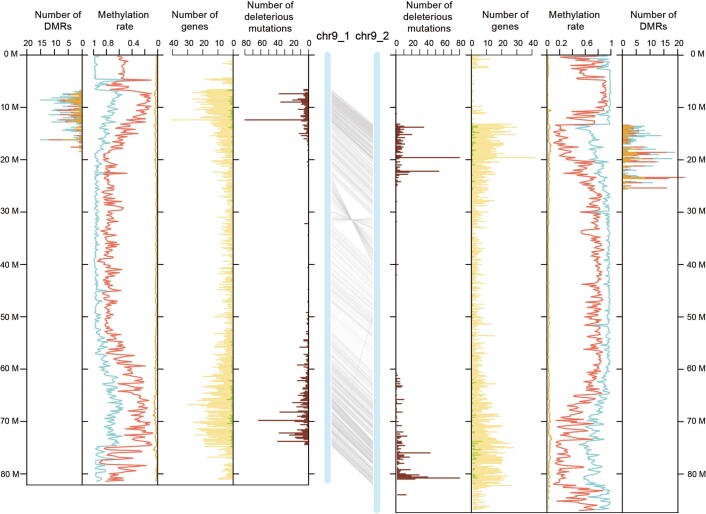
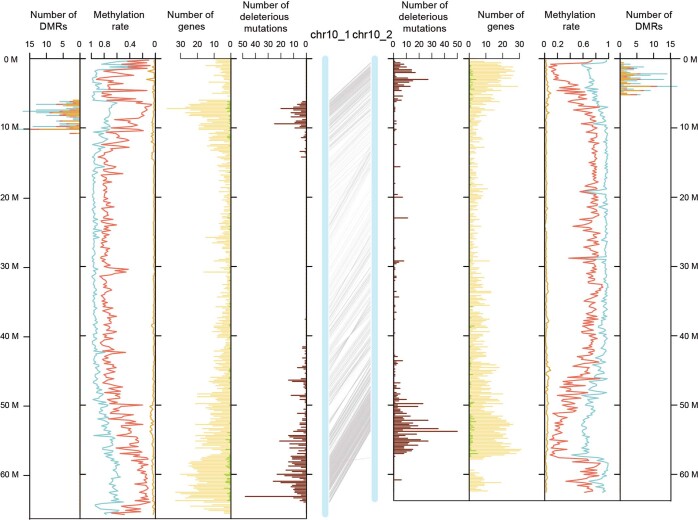
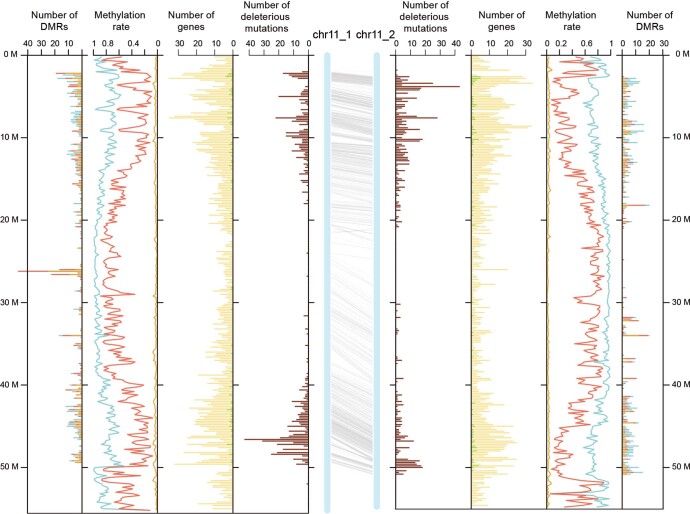
Potato (Solanum tuberosum L.) is the most important tuber crop worldwide. Efforts are underway to transform the crop from a clonally propagated tetraploid into a seed-propagated, inbred-line-based hybrid, but this process requires a better understanding of potato genome. Here, we report the 1.67-Gb haplotype-resolved assembly of a diploid potato, RH89-039-16, using a combination of multiple sequencing strategies, including circular consensus sequencing. Comparison of the two haplotypes revealed ~2.1% intragenomic diversity, including 22,134 predicted deleterious mutations in 10,642 annotated genes. In 20,583 pairs of allelic genes, 16.6% and 30.8% exhibited differential expression and methylation between alleles, respectively. Deleterious mutations and differentially expressed alleles were dispersed throughout both haplotypes, complicating strategies to eradicate deleterious alleles or stack beneficial alleles via meiotic recombination. This study offers a holistic view of the genome organization of a clonally propagated diploid species and provides insights into technological evolution in resolving complex genomes.


Conflict of interest statement

The authors declare no competing interests.

Figures

Fig. 1
Fig. 1. Hybrid de novo assembly and phasing of the diploid potato genome.
a,b, The genome draft RHgv1 was assembled from WGS Illumina reads and 10xG linked reads, and the derived scaffolds were assigned into 24 haplotype-specific groups through genetic mapping based on a sequenced F2 population. The 24 groups represent chromosomes of the diploid potato (2n = 24). ONT reads were aligned to each linkage group and assembled to improve scaffold contiguity. c,d, A second genome sequence, RHgv2, was assembled from CCS reads. Similarly, unitigs were assigned into 24 groups through genetic mapping. e,f, The two assemblies were merged to generate a more comprehensive genome, RHgv3. Hi-C data were used to scaffold the sequences of each group into pseudochromosomes.
Fig. 2
Fig. 2. Haplotype divergence in a diploid potato genome.
a, The central blue bars represent the two haplotypes of chromosome 1. The gray lines indicate paired allelic genes. Distribution of deleterious or dysfunctional mutations (brown), annotated genes (yellow), preferentially expressed alleles (green), methylation level of three contexts and differentially methylated regions are arranged symmetrically for each haplotype. Methylation level and the number of DMRs of methylated sites in CG (light blue), CHG (red) and CHH (orange) contexts are indicated by cumulative column chart. The number of DMRs on one haplotype only involves the DMRs with hypermethylation. All numbers were determined in 200-kb windows. b, Zoomed-in view of a syntenic block showing the mosaic pattern of preferentially expressed alleles (dark green) and alleles with lower expression (light green) on the two haplotypes. Source data
Fig. 3
Fig. 3. Tight linkage of two deleterious genes in the repulsion phase.
a, Phenotype of normal seedling (WS1) and white seedling (ws1), normal plant architecture (PA1) and more branched architecture (pa1). b, Genetic mapping of PA1 and ws1 on chromosome 1_1. The top graph shows the likelihood of odd (LOD) value of PA1 mapping using R/qtl software, and the bottom graph represents the number of individuals with a homozygous recessive allele. Dots in the graphs present the genetic markers. The ar1 locus has been reported previously. c, Fine mapping of ws1 and pa1 using indel markers (green bars). Gray segments represent the repeat elements; green and yellow blocks indicate the positions of WS1/ws1 and PA1/pa1, respectively. d, Quantitative PCR (qPCR) result of RHC01H1G0699.2 in normal (PA1/PA1) and more-branched (pa1/pa1) plants. Error bars represent the standard deviation from four biological replicates, and asterisks indicate significant differences between normal and more-branched plants (t-test, **P value < 0.01). e, CDS alignment of RHC01H1G0699.2, RHC01H2G0765.2 and their homolog in DM (DMG400008712), showing the 57-bp indel between alleles. Source data
Extended Data Fig. 1
Extended Data Fig. 1. Haplotype alignment of RH chromosome 3.
The central blue bars represent the two haplotypes of chromosome 3 with the gray lines indicating the paired allelic genes. The distribution of deleterious or dysfunctional mutations (brown), annotated genes (yellow), preferentially expressed alleles (green), methylation level of three contexts and differentially methylated regions are arranged symmetrically for each haplotype. The methylation level and the number of DMRs of methylated sites in CG (light blue), CHG (red) and CHH (orange) contexts are indicated by cumulative column chart. Number of DMRs on one haplotype only involves the DMRs with hyper-methylation. All of the numbers were determined in 200 kb windows.
Extended Data Fig. 2
Extended Data Fig. 2. Haplotype alignment of RH chromosome 4.
The central blue bars represent the two haplotypes of chromosome 4 with the gray lines indicating the paired allelic genes. The distribution of deleterious or dysfunctional mutations (brown), annotated genes (yellow), preferentially expressed alleles (green), methylation level of three contexts and differentially methylated regions are arranged symmetrically for each haplotype. The methylation level and the number of DMRs of methylated sites in CG (light blue), CHG (red) and CHH (orange) contexts are indicated by cumulative column chart. Number of DMRs on one haplotype only involves the DMRs with hyper-methylation. All of the numbers were determined in 200 kb windows.
Extended Data Fig. 3
Extended Data Fig. 3. Haplotype alignment of RH chromosome 5.
The central blue bars represent the two haplotypes of chromosome 5 with the gray lines indicating the paired allelic genes. The distribution of deleterious or dysfunctional mutations (brown), annotated genes (yellow), preferentially expressed alleles (green), methylation level of three contexts and differentially methylated regions are arranged symmetrically for each haplotype. The methylation level and the number of DMRs of methylated sites in CG (light blue), CHG (red) and CHH (orange) contexts are indicated by cumulative column chart. Number of DMRs on one haplotype only involves the DMRs with hyper-methylation. All of the numbers were determined in 200 kb windows.
Extended Data Fig. 4
Extended Data Fig. 4. Haplotype alignment of RH chromosome 6.
The central blue bars represent the two haplotypes of chromosome 6 with the gray lines indicating the paired allelic genes. The distribution of deleterious or dysfunctional mutations (brown), annotated genes (yellow), preferentially expressed alleles (green), methylation level of three contexts and differentially methylated regions are arranged symmetrically for each haplotype. The methylation level and the number of DMRs of methylated sites in CG (light blue), CHG (red) and CHH (orange) contexts are indicated by cumulative column chart. Number of DMRs on one haplotype only involves the DMRs with hyper-methylation. All of the numbers were determined in 200 kb windows.
Extended Data Fig. 5
Extended Data Fig. 5. Haplotype alignment of RH chromosome 7.
The central blue bars represent the two haplotypes of chromosome 7 with the gray lines indicating the paired allelic genes. The distribution of deleterious or dysfunctional mutations (brown), annotated genes (yellow), preferentially expressed alleles (green), methylation level of three contexts and differentially methylated regions are arranged symmetrically for each haplotype. The methylation level and the number of DMRs of methylated sites in CG (light blue), CHG (red) and CHH (orange) contexts are indicated by cumulative column chart. Number of DMRs on one haplotype only involves the DMRs with hyper-methylation. All of the numbers were determined in 200 kb windows.
Extended Data Fig. 6
Extended Data Fig. 6. Haplotype alignment of RH chromosome 8.
The central blue bars represent the two haplotypes of chromosome 8 with the gray lines indicating the paired allelic genes. The distribution of deleterious or dysfunctional mutations (brown), annotated genes (yellow), preferentially expressed alleles (green), methylation level of three contexts and differentially methylated regions are arranged symmetrically for each haplotype. The methylation level and the number of DMRs of methylated sites in CG (light blue), CHG (red) and CHH (orange) contexts are indicated by cumulative column chart. Number of DMRs on one haplotype only involves the DMRs with hyper-methylation. All of the numbers were determined in 200 kb windows.
Extended Data Fig. 7
Extended Data Fig. 7. Haplotype alignment of RH chromosome 9.
The central blue bars represent the two haplotypes of chromosome 9 with the gray lines indicating the paired allelic genes. The distribution of deleterious or dysfunctional mutations (brown), annotated genes (yellow), preferentially expressed alleles (green), methylation level of three contexts and differentially methylated regions are arranged symmetrically for each haplotype. The methylation level and the number of DMRs of methylated sites in CG (light blue), CHG (red) and CHH (orange) contexts are indicated by cumulative column chart. Number of DMRs on one haplotype only involves the DMRs with hyper-methylation. All of the numbers were determined in 200 kb windows.
Extended Data Fig. 8
Extended Data Fig. 8. Haplotype alignment of RH chromosome 10.
The central blue bars represent the two haplotypes of chromosome 10 with the gray lines indicating the paired allelic genes. The distribution of deleterious or dysfunctional mutations (brown), annotated genes (yellow), preferentially expressed alleles (green), methylation level of three contexts and differentially methylated regions are arranged symmetrically for each haplotype. The methylation level and the number of DMRs of methylated sites in CG (light blue), CHG (red) and CHH (orange) contexts are indicated by cumulative column chart. Number of DMRs on one haplotype only involves the DMRs with hyper-methylation. All of the numbers were determined in 200 kb windows.
Extended Data Fig. 9
Extended Data Fig. 9. Haplotype alignment of RH chromosome 11.
The central blue bars represent the two haplotypes of chromosome 11 with the gray lines indicating the paired allelic genes. The distribution of deleterious or dysfunctional mutations (brown), annotated genes (yellow), preferentially expressed alleles (green), methylation level of three contexts and differentially methylated regions are arranged symmetrically for each haplotype. The methylation level and the number of DMRs of methylated sites in CG (light blue), CHG (red) and CHH (orange) contexts are indicated by cumulative column chart. Number of DMRs on one haplotype only involves the DMRs with hyper-methylation. All of the numbers were determined in 200 kb windows.
Extended Data Fig. 10
Extended Data Fig. 10. Haplotype alignment of RH chromosome 12.
The central blue bars represent the two haplotypes of chromosome 12 with the gray lines indicating the paired allelic genes. The distribution of deleterious or dysfunctional mutations (brown), annotated genes (yellow), preferentially expressed alleles (green), methylation level of three contexts and differentially methylated regions are arranged symmetrically for each haplotype. The methylation level and the number of DMRs of methylated sites in CG (light blue), CHG (red) and CHH (orange) contexts are indicated by cumulative column chart. Number of DMRs on one haplotype only involves the DMRs with hyper-methylation. All of the numbers were determined in 200 kb windows.

References

    1. Ramulu KS, Dijkhuis P, Roest S. Phenotypic variation and ploidy level of plants regenerated from protoplasts of tetraploid potato (Solanum tuberosum L. cv. ‘Bintje’) Theor. Appl. Genet. 1983;65:329–338. - PubMed
    1. Lindhout P, et al. Towards F1 hybrid seed potato breeding. Potato Res. 2011;54:301–312.
    1. Jansky SH, et al. Reinventing potato as a diploid inbred line-based crop. Crop Sci. 2016;56:1412–1422.
    1. Li Y, Li G, Li C, Qu D, Huang S. Prospects of diploid hybrid breeding in potato. Chin. Potato J. 2013;27:96–99.
    1. Stokstad E. Breeders seek a breakthrough to help farmers facing an uncertain future. Science. 2019;363:574–577.

Publication types