. 2020 Nov;52(11):1189-1197.
doi: 10.1038/s41588-020-0692-4. Epub 2020 Sep 28.

The mutational signature profile of known and suspected human carcinogens in mice

Affiliations

The mutational signature profile of known and suspected human carcinogens in mice

Laura Riva et al. Nat Genet. 2020 Nov.

Abstract

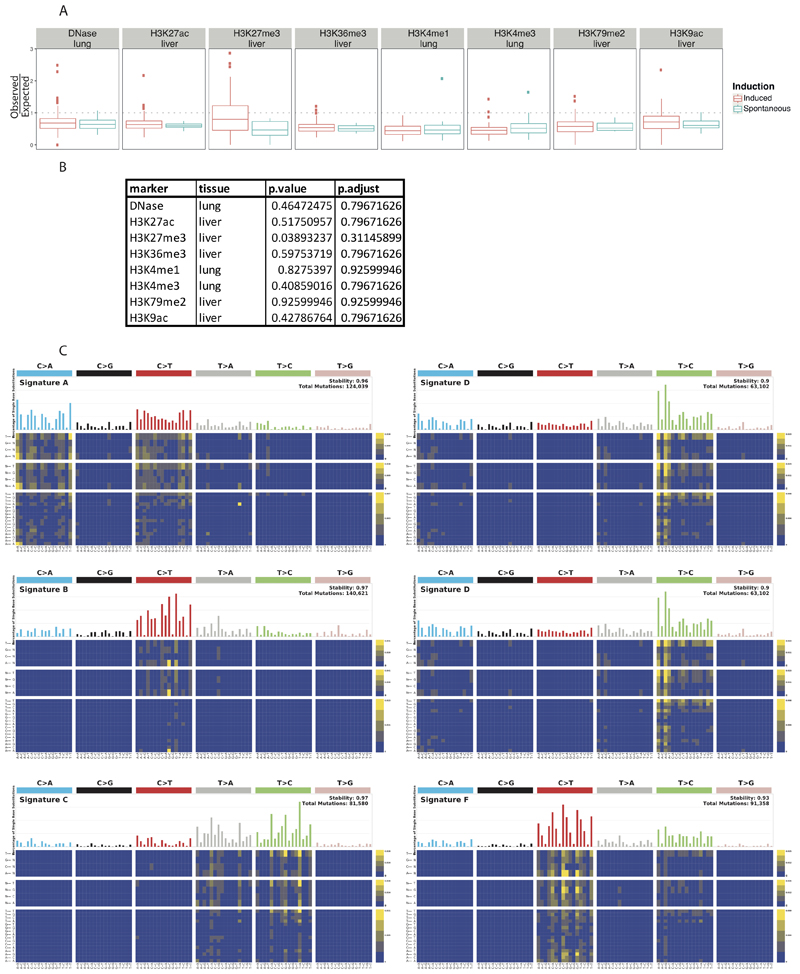
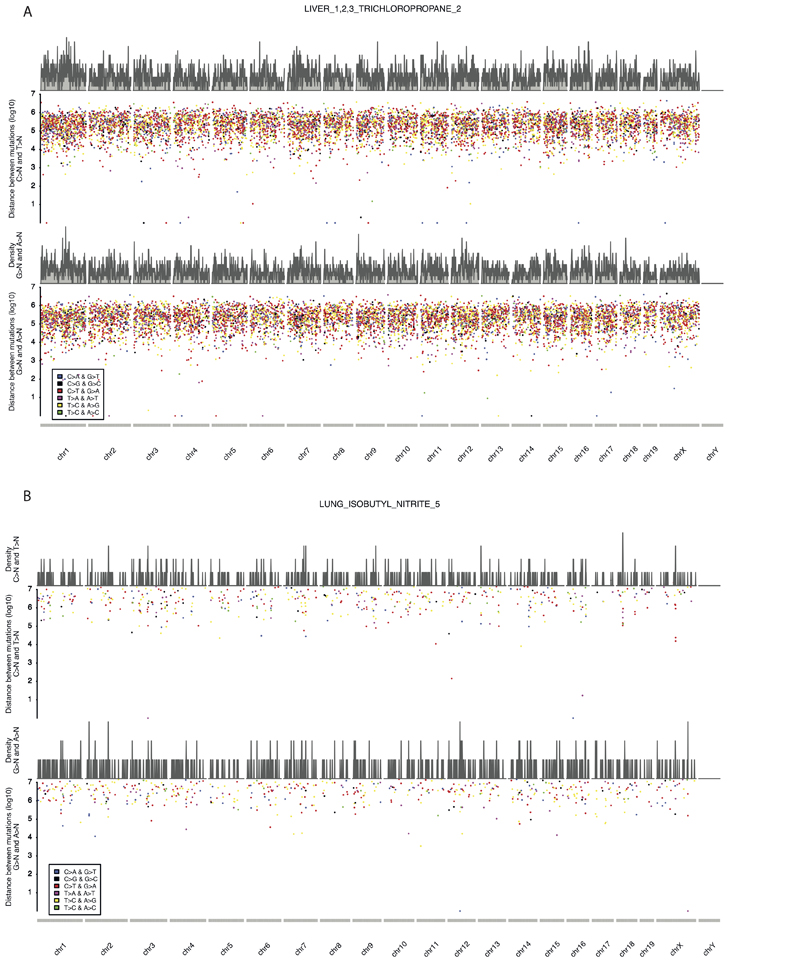
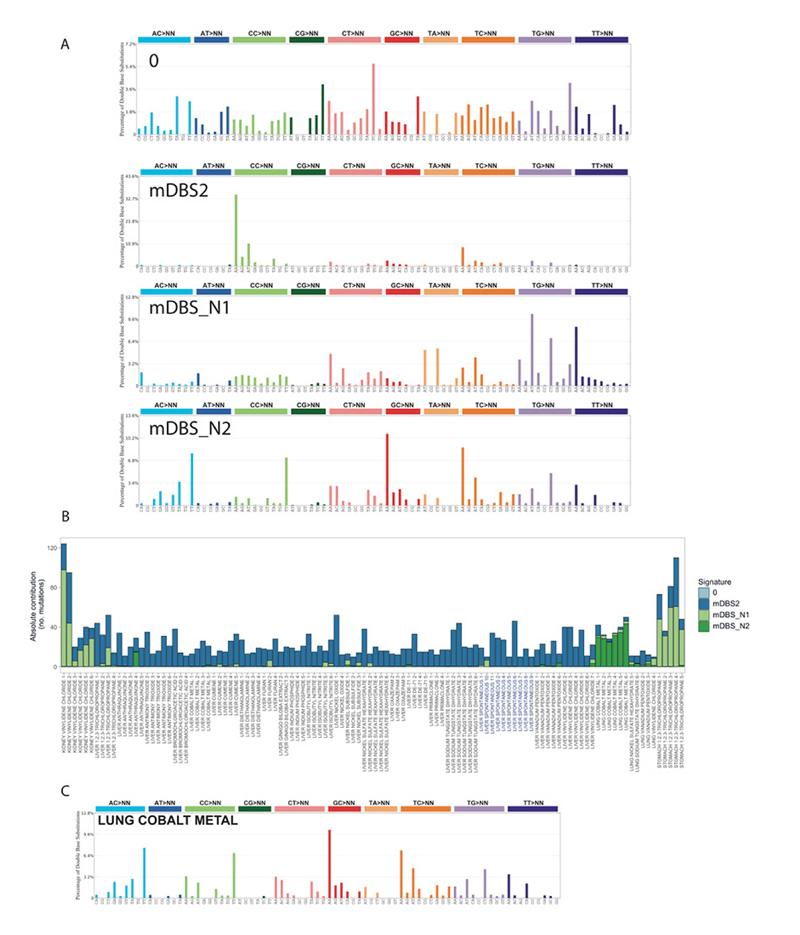
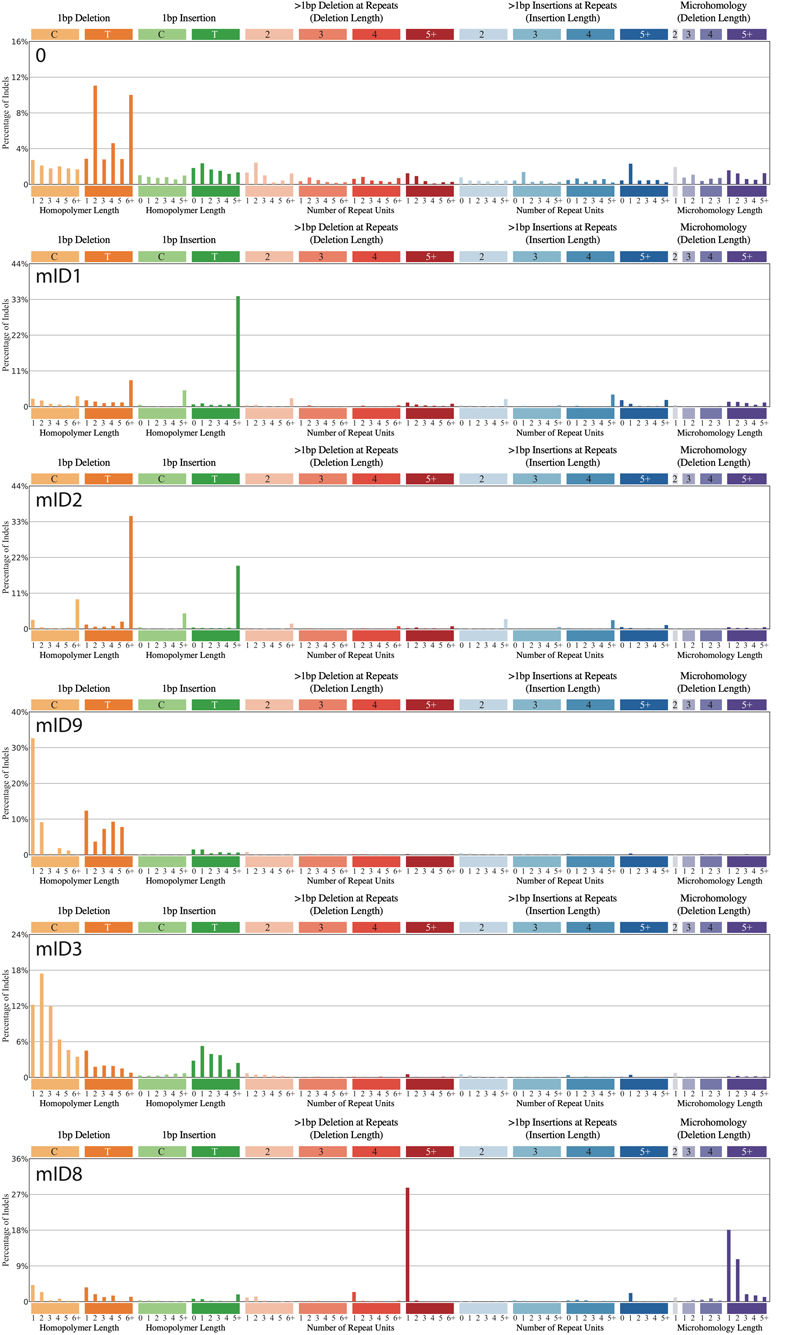
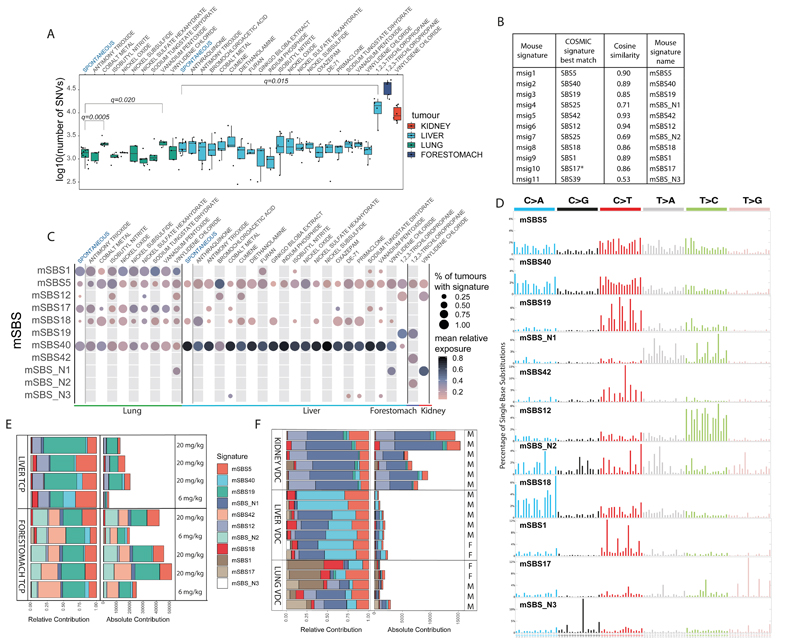
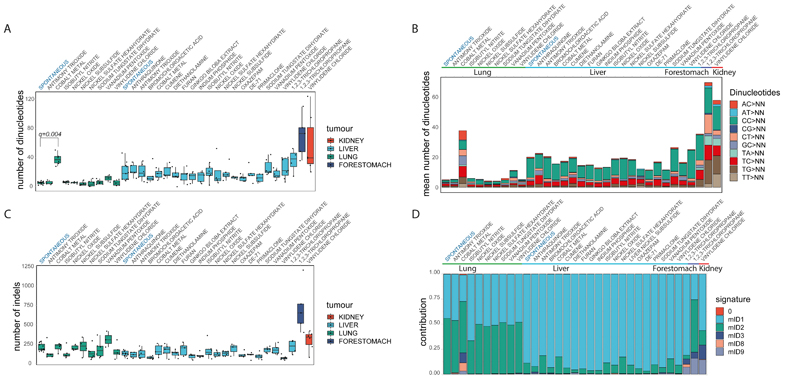
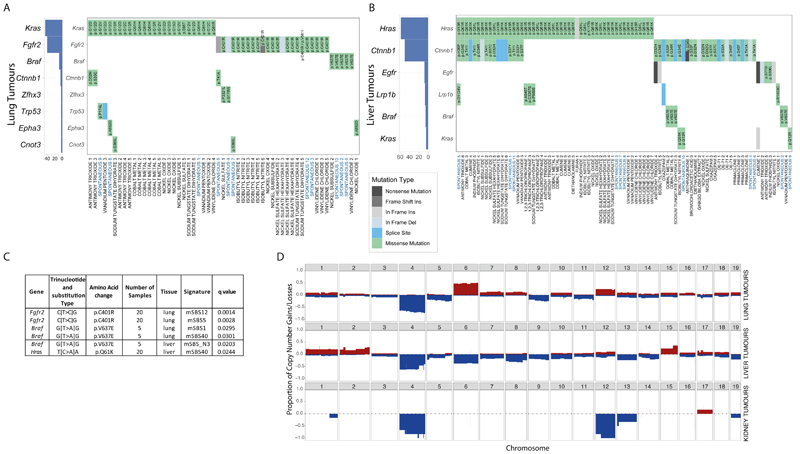
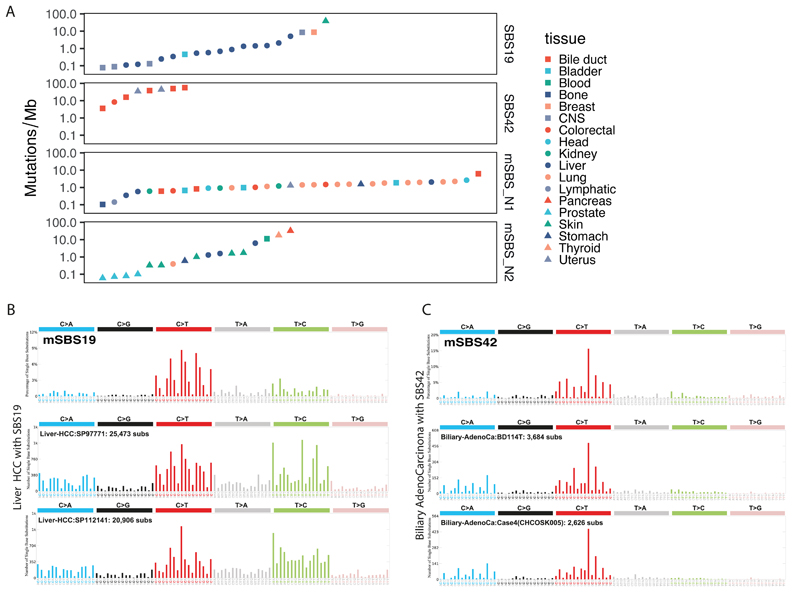
Epidemiological studies have identified many environmental agents that appear to significantly increase cancer risk in human populations. By analyzing tumor genomes from mice chronically exposed to 1 of 20 known or suspected human carcinogens, we reveal that most agents do not generate distinct mutational signatures or increase mutation burden, with most mutations, including driver mutations, resulting from tissue-specific endogenous processes. We identify signatures resulting from exposure to cobalt and vinylidene chloride and link distinct human signatures (SBS19 and SBS42) with 1,2,3-trichloropropane, a haloalkane and pollutant of drinking water, and find these and other signatures in human tumor genomes. We define the cross-species genomic landscape of tumors induced by an important compendium of agents with relevance to human health.


Conflict of interest statement

Competing interest Statement

The authors have no competing interests to declare.

Figures

Extended Data Figure 1
Extended Data Figure 1. The comparative landscape of spontaneous and chemically induced tumours with genomic features.
A, Comparison of the colocalization of substitutions with histone marks and open chromatin in spontaneous and chemically induced tumours. Each point is a single replicate (for the induced these points are aggregated across multiple chemicals). For each point, we plot the observed/expected data from the MutationalPatterns software. The box plots show the Tukey statistics: The box shows the 1st — 3rd quartiles, with a line at the median. The whiskers extend from the 1st and 3rd quartiles to the largest value no more than 1.5*IQR from the relevant quartile (See Source Data for sample numbers in each comparison). B, Table reporting the adjusted p values for the comparisons in A. A two-sided Mann-Whitney U-test was used to calculate the false-discovery rate corrected p values. C, Signatures identified using sigProfiler in the pentanucleotide context.
Extended Data Figure 2
Extended Data Figure 2. Strand coordinated clustering along the genome.
A, a liver tumour from a mouse exposed to TCP and B, a lung tumour from a mouse exposed to Isobutyl Nitrate.
Extended Data Figure 3
Extended Data Figure 3. Hierarchical clustering of the contribution of mSBS signatures across the collection of lung, liver, kidney and forestomach tumours sequenced in this study.
The profile of mutational signatures across the tumour collection. The signature profiles are shown in Figure 1.
Extended Data Figure 4
Extended Data Figure 4. Supplementary Fig. 4: The landscape of Mouse Doublet Base Substitution (mDBS) Signatures induced by chemical exposures and endogenous mutagenic processes.
A, The catalogue of mouse doublet base substitution (mDBS) signatures. mDBS_N1 and mDBS_N2 are new DBS signatures. B, Number of mutations for each mDBS signature across the collection of lung, liver, kidney and forestomach tumours. Component 0 accounts for very few mutations and represents background/unassigned mutations. C, The DBS spectrum obtained by normalizing and averaging the DBS spectra of the six lung tumours exposed to cobalt. This profile is almost identical to mDBS_N2.
Extended Data Figure 5
Extended Data Figure 5. The catalogue of mouse indel substitution (mID) signatures.
Shown are the indel signatures that were computed from the whole genome sequence data generated in this study.
Extended Data Figure 6
Extended Data Figure 6. Hierarchical clustering of copy number variants across the tumour collection.
Copy number events were called as described in the Methods. Notable clustering for tumours from mice exposed to DE-71 and vinylidene chloride are shown. The scale indicates copy number.
Extended Data Figure 7
Extended Data Figure 7. Structural variants in spontaneous and chemical induced tumours.
Structural variants of two lung tumours showing chromothripsis and two liver tumours with many inversion events. B, Structural variants in the other samples (excluding the samples in A) across the collection of lung, liver, kidney and forestomach tumours.
Extended Data Figure 8
Extended Data Figure 8. Comparison of signatures computed with HDP to those computed with SigProfiler with 6 components (default result).
Shown are the signatures identified using HDP and corresponding signatures identified using the SigProfiler algorithm. For this comparison SigProfiler was run with 6 components.
Extended Data Figure 9
Extended Data Figure 9. Comparison of signatures computed with HDP to those computed with SigProfiler with 9 components.
Shown are the signatures identified using HDP and corresponding signatures identified using the SigProfiler algorithm. For this comparison SigProfiler was used with 9 components.
Fig. 1
Fig. 1
The landscape of Mouse Single Base Substitution (mSBS) signatures induced by chemical exposures and endogenous mutagenic processes. A, Mutational burden across the collection of lung, liver, kidney and forestomach tumours sequenced in this study. The central line represents the median, the lower line is the first quantile (Q1) and the upper line is the third quantile (Q3). The upper whisker extends from Q3 to 1.5 times the inter-quartile range (IQR), the lower whisker extends from Q 1to 1.5 times the IQR. Cobalt and vanadium pentoxide in lung and TCP in liver have significantly more substitutions than the corresponding spontaneous tumours (FDR-corrected one-sided Mann-Whitney U-test). B, Comparison of mouse substitution signatures to human signatures. *SBS17=SBS17a and SBS17b. C, Contribution of mSBS signatures across lung, liver, kidney and forestomach tumours, grouped by chemical exposure. The size of the dots corresponds to the percentage of samples in each category having a minimal contribution level of 10% from the signature. The colour represents the mean relative contribution for the samples where the signature contribution is ≥10%. Of note, mSBS_N3 was detected in a spontaneous liver tumour just below this threshold. D, Profile of the catalogue of mSBS Signatures. E, Common and unique mutational signatures in liver and forestomach tumours from mice exposed to TCP. mSBS19 (dark green) is present in liver and forestomach tumours. mSBS42 and mSBS_N2 (light green) are present only in forestomach tumours. Treatment dose is shown. F, Common and unique mutational signatures in lung, liver and kidney tumours from mice exposed to vinylidene chloride (VDC). The mutational burden varied greatly based on tissue. For clarity, mSBS5 (light red) is shown at the top of the stacked bars and mSBS18 (dark red) towards the bottom. M and F refer to male and female, respectively.
Fig. 2
Fig. 2
Transcriptional strand bias and replication timing of mutations in mouse lung, liver, kidney and forestomach tumours. A, Transcriptional strand bias for signatures in different tumour tissues. The size of the dots represents significance (FDR-corrected two-sided binomial test) while the colour represents log2 of the enrichment. For lung and liver, we report all signatures. For kidney and forestomach, we selected only signatures with a significant transcriptional strand bias. All data are available in Supplementary Table 6. B, Difference in the number of substitutions on the transcribed and untranscribed strand in tumours induced with VDC in kidney and TCP in liver. C, Replication timing bias for signatures in tumours from different tissues. The size of the dots represents significance (FDR-corrected two-sided binomial test) while the colour represents log2 of the enrichment. For lung and liver, we report all signatures. We selected the same samples as in A. All data are available in Supplementary Table 7. D, Two liver tumours where mSBS_N3, which is generally present at low levels in other tumours, is prominent. E, Mutation of WGCC motifs in samples with mSBS_N3 altering the underlined nucleotide C>G and C>T.
Fig. 3
Fig. 3
Doublet/dinucleotide Base Substitution and Indel Signatures. A, Number of dinucleotide substitutions across the collection of lung, liver, kidney and forestomach tumours. Liver tumours have, in general, a higher number of dinucleotide substitutions than lung tumours (two-sided Mann-Whitney U-test). Cobalt induced lung tumours have a significant higher number of altered dinucleotides compared to the other lung tumours (FDR-corrected one-sided Mann-Whitney U-test). The central line represents the median, the lower line is the first quantile (Q1) and the upper line is the third quantile (Q3). The upper whisker extends from Q3 to 1.5 times the inter-quartile range (IQR), the lower whisker extends from Q 1to 1.5 times the IQR. B, Median number and types of doublet base substitutions per tumour tissue and chemical exposure. C, Number of indels in lung, liver, kidney and forestomach tumours. Lung tumours have, in general, a higher number of indels than liver tumours (two-sided Mann-Whitney U-test). Boxes and line are as described in A. D, Relative contribution of COSMIC indel Signatures. The types of indels are mainly driven by tissue type, with lung tumours having an higher mID2 activity (two-sided Mann-Whitney U-test). Signature 0 (red) represents background. More details are provided in Extended Data Fig. 5.
Fig. 4
Fig. 4
Driver genes, the association between specific hotspot mutations and SBS signatures, and copy number variant profiles. A, Driver genes detected in at least 3% of lung tumours. Kras, Fgfr2and Brafmutations are mutually exclusive. B, Driver genes in at least 3% of liver tumours. Hras, Egfrand Brafmutations are mutually exclusive. C, Significant associations between specific hotspot mutations in driver genes and mSBS signatures (FDR-corrected one-sided Mann-Whitney U-test). The identified mSBSs were classified as endogenous signatures because they were present in spontaneous tumours within the collection. Further details are provided in Supplementary Table 9. D, Frequency of copy number gains (shown in red) _losses (shown in blue) in lung, liver and kidney tumours.
Fig. 5
Fig. 5. Identification of human tumours with signatures related to mSBS19, mSBS42, mSBS_N1 and mSBS_N2.
A, Mutational burden and tissue types of the human cancers where we detected the signatures under evaluation with a minimum contribution level of 5%. B, Shown is mSBS19 and two spectra of human hepatocellular carcinomas where SBS19 was identified. C, Shown is mSBS42 and two spectra of human liver cholangiocarcinomas where SBS42 was detected (full dataset in Supplementary Table 11).

Comment in

  • The ways in which carcinogens work.
    Dart A. Dart A. Nat Rev Cancer. 2020 Dec;20(12):695. doi: 10.1038/s41568-020-00314-0. Nat Rev Cancer. 2020. PMID: 33110244 No abstract available.
  • Are carcinogens direct mutagens?
    Lopez-Bigas N, Gonzalez-Perez A. Lopez-Bigas N, et al. Nat Genet. 2020 Nov;52(11):1137-1138. doi: 10.1038/s41588-020-00730-w. Nat Genet. 2020. PMID: 33128047 No abstract available.

References

    1. Alexandrov LB, et al. The repertoire of mutational signatures in human cancer. Nature. 2020;578:94–101. - PMC - PubMed
    1. Alexandrov LB, et al. Signatures of mutational processes in human cancer. Nature. 2013;500:415–21. - PMC - PubMed
    1. Kemp CJ. Animal Models of Chemical Carcinogenesis: Driving Breakthroughs in Cancer Research for 100 Years. Cold Spring Harb Protoc. 2015;2015:865–74. - PMC - PubMed
    1. Bucher JR. The National Toxicology Program rodent bioassay: designs, interpretations, and scientific contributions. Ann N Y Acad Sci. 2002;982:198–207. - PubMed
    1. Innes JR, et al. Bioassay of pesticides and industrial chemicals for tumorigenicity in mice: a preliminary note. J Natl Cancer Inst. 1969;42:1101–14. - PubMed

Publication types