. 2020 Oct;52(10):1024-1035.
doi: 10.1038/s41588-020-0696-0. Epub 2020 Sep 28.

An integrated multi-omics approach identifies epigenetic alterations associated with Alzheimer's disease

Affiliations

An integrated multi-omics approach identifies epigenetic alterations associated with Alzheimer's disease

Raffaella Nativio et al. Nat Genet. 2020 Oct.

Erratum in

Abstract

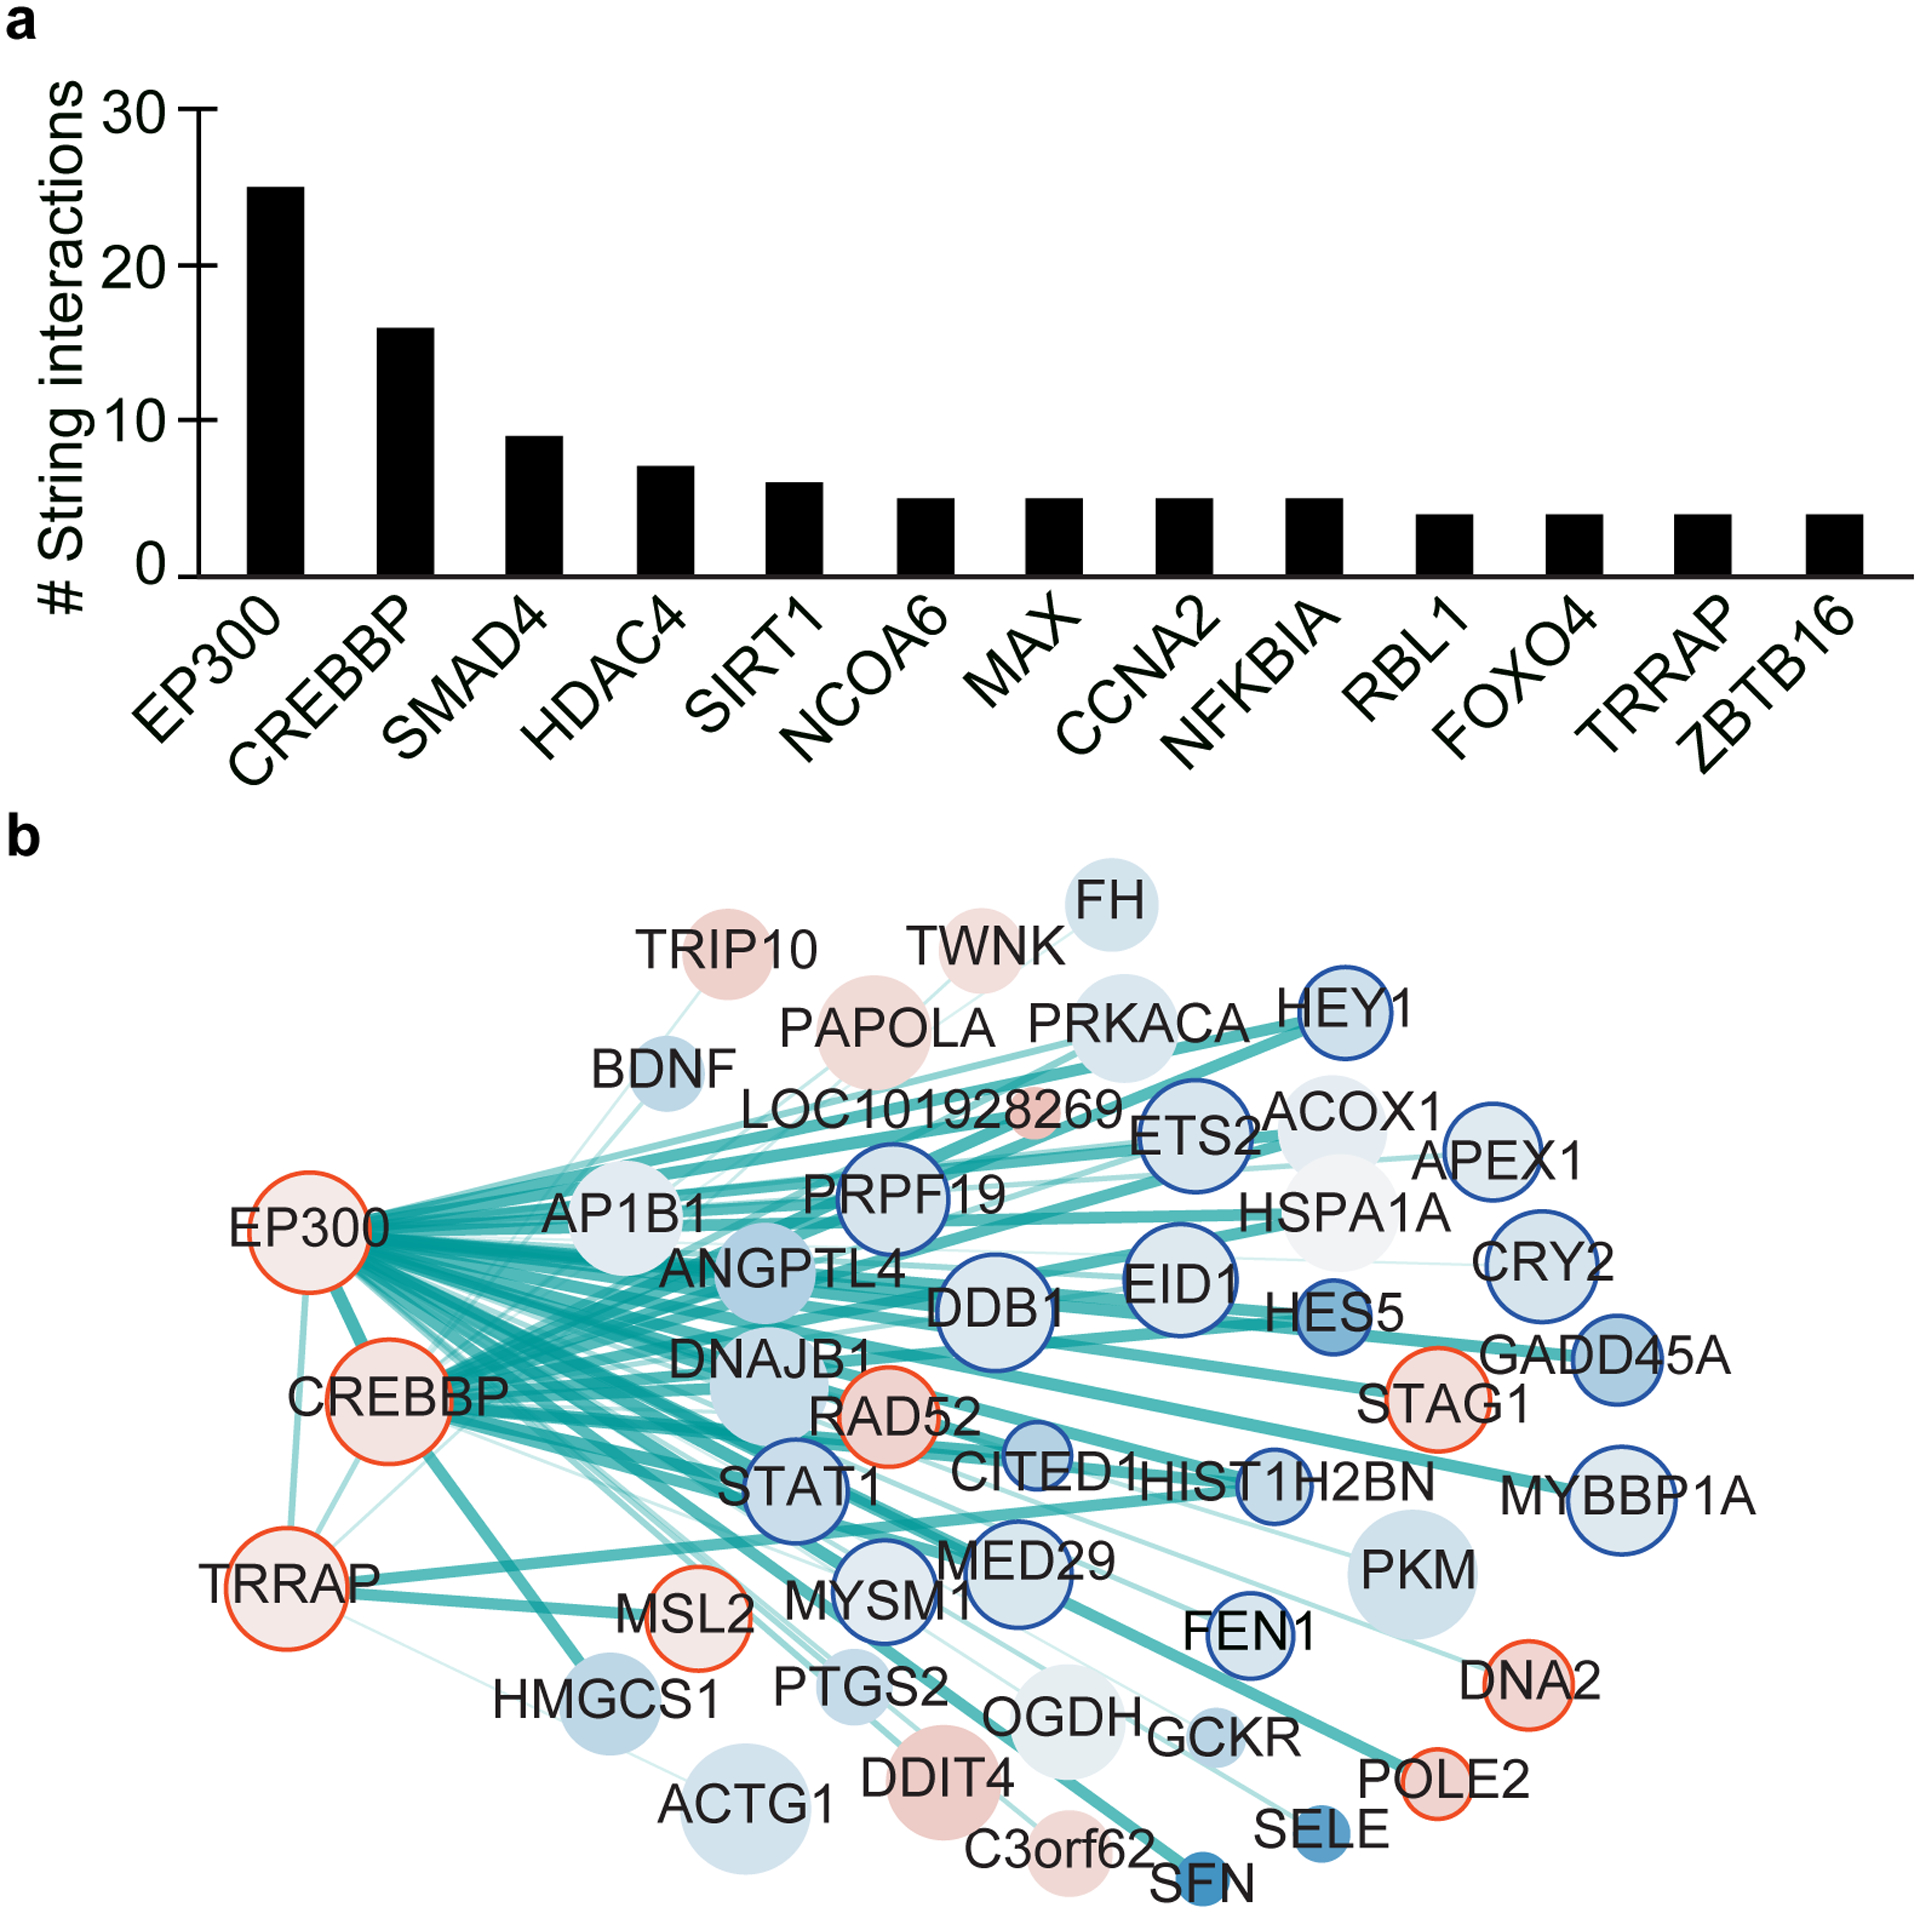
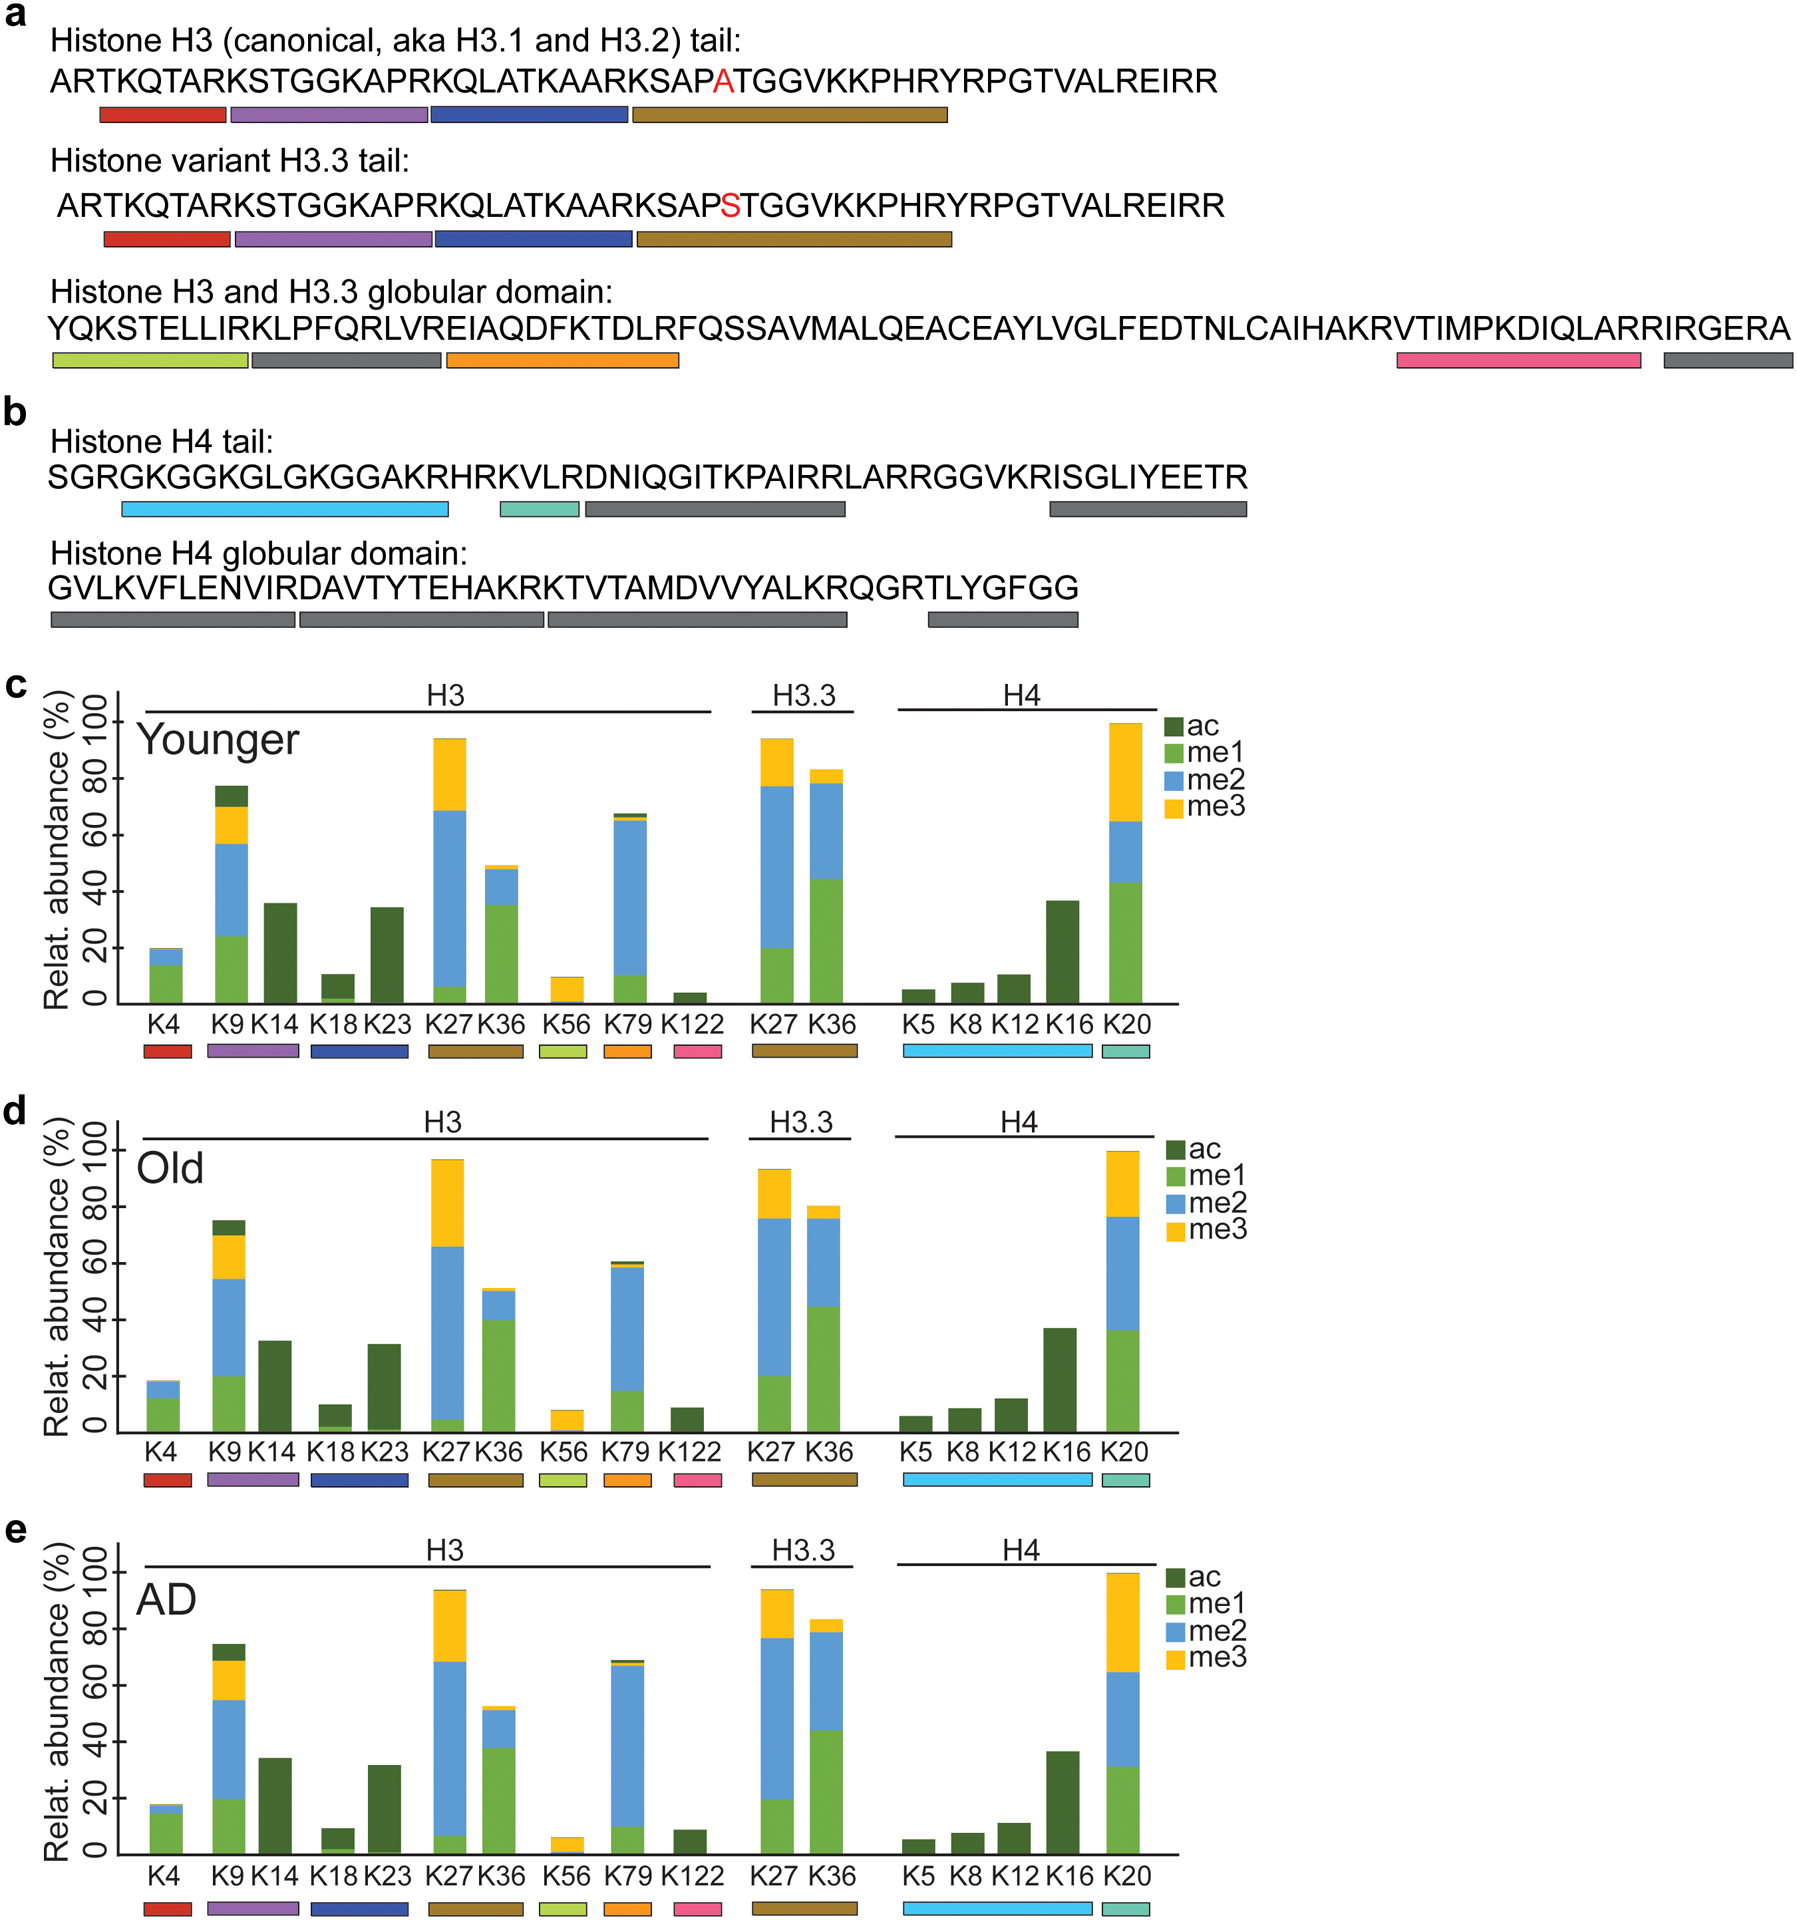
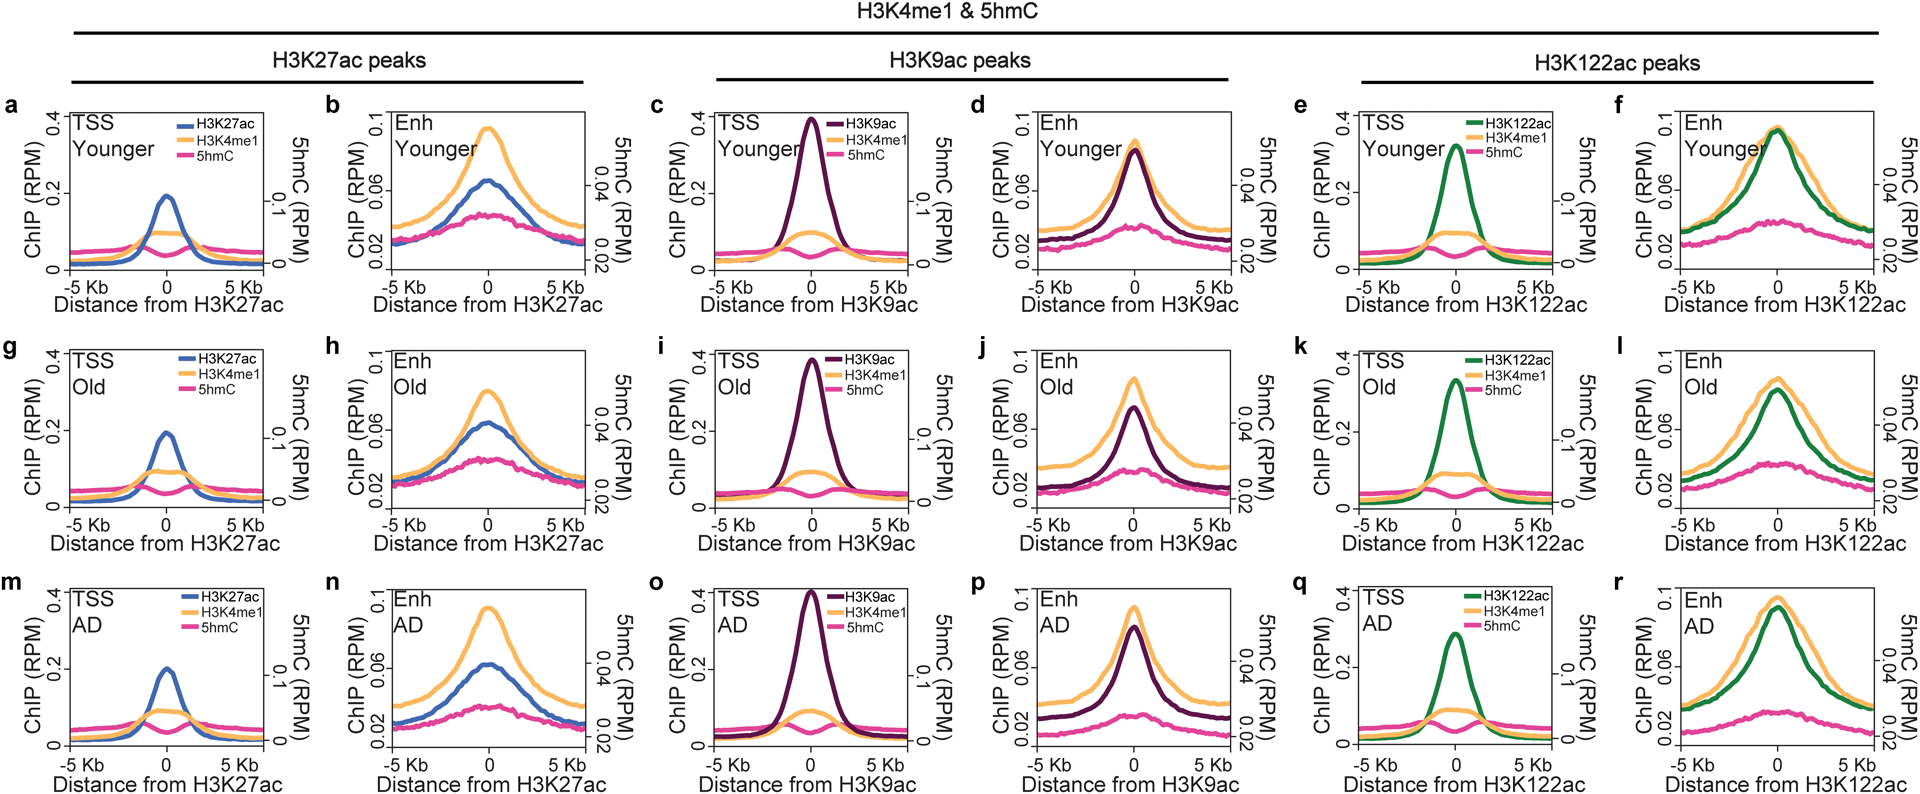
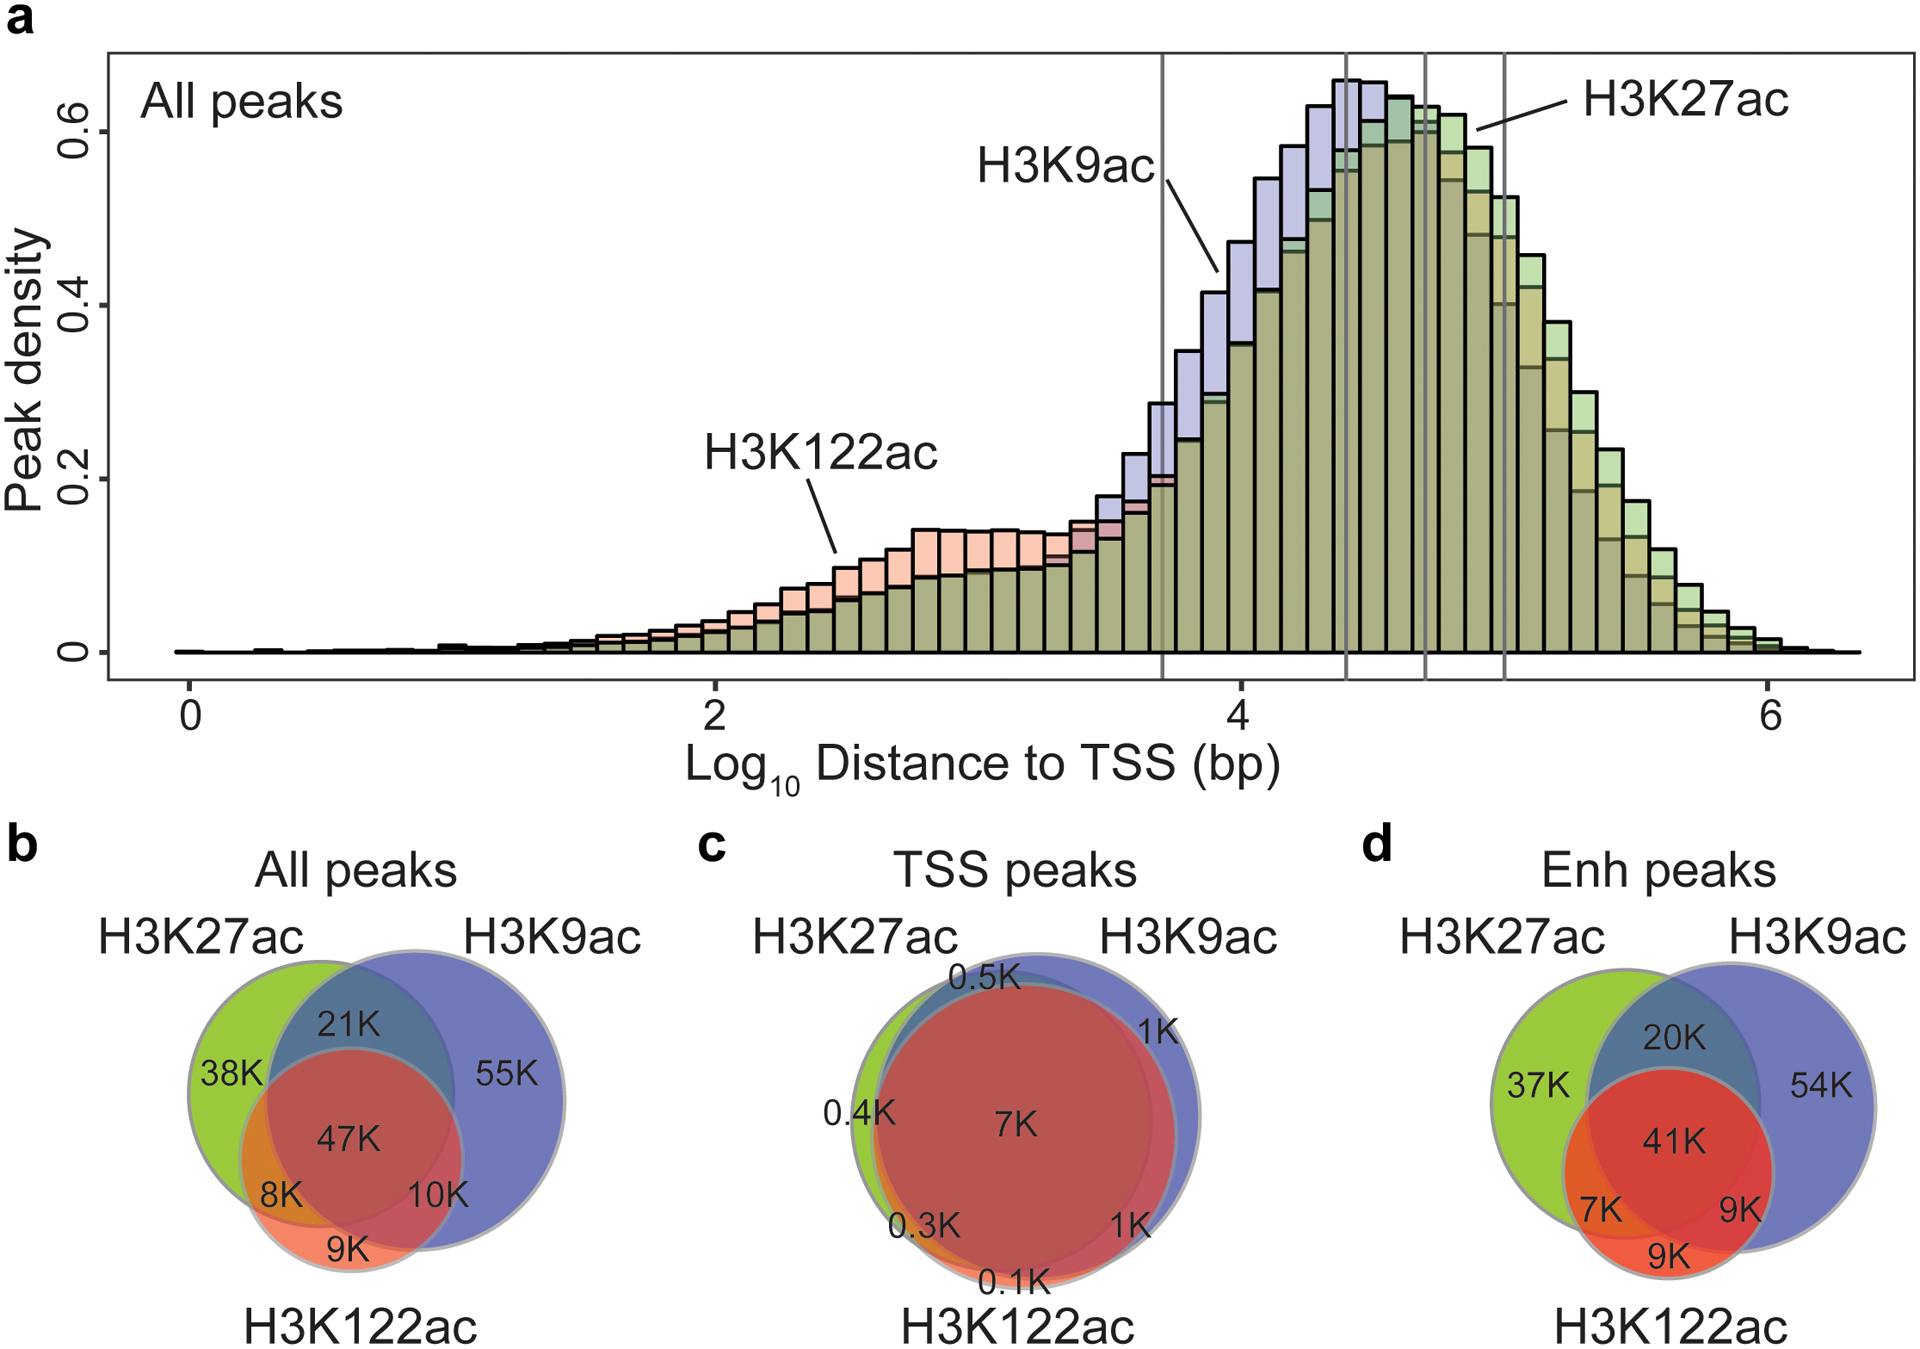
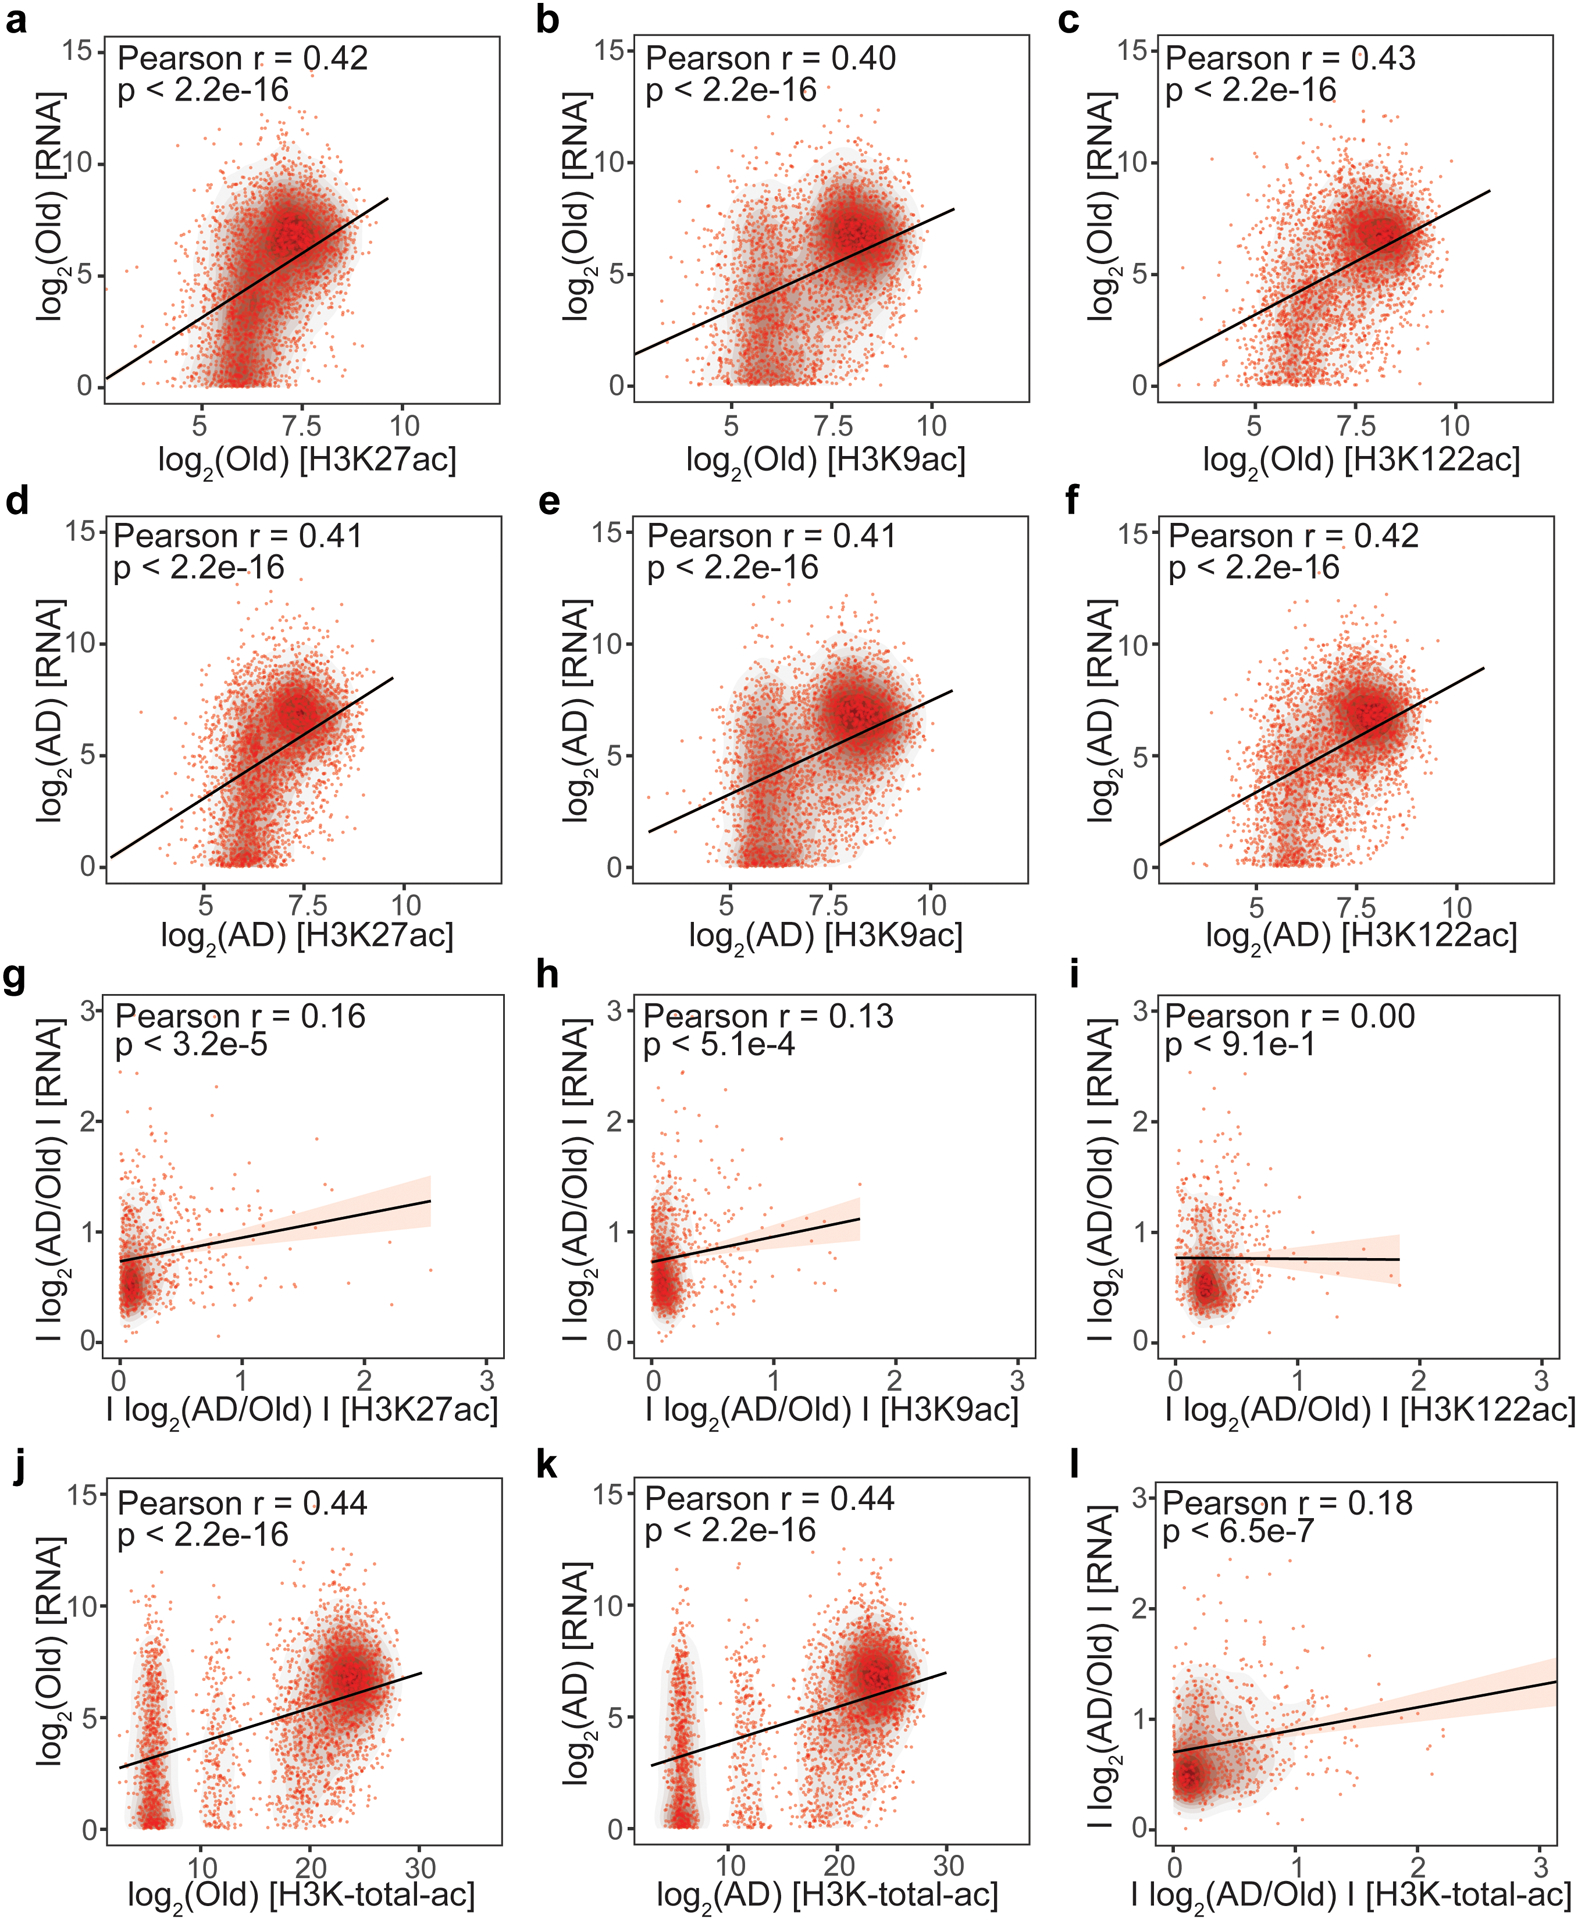
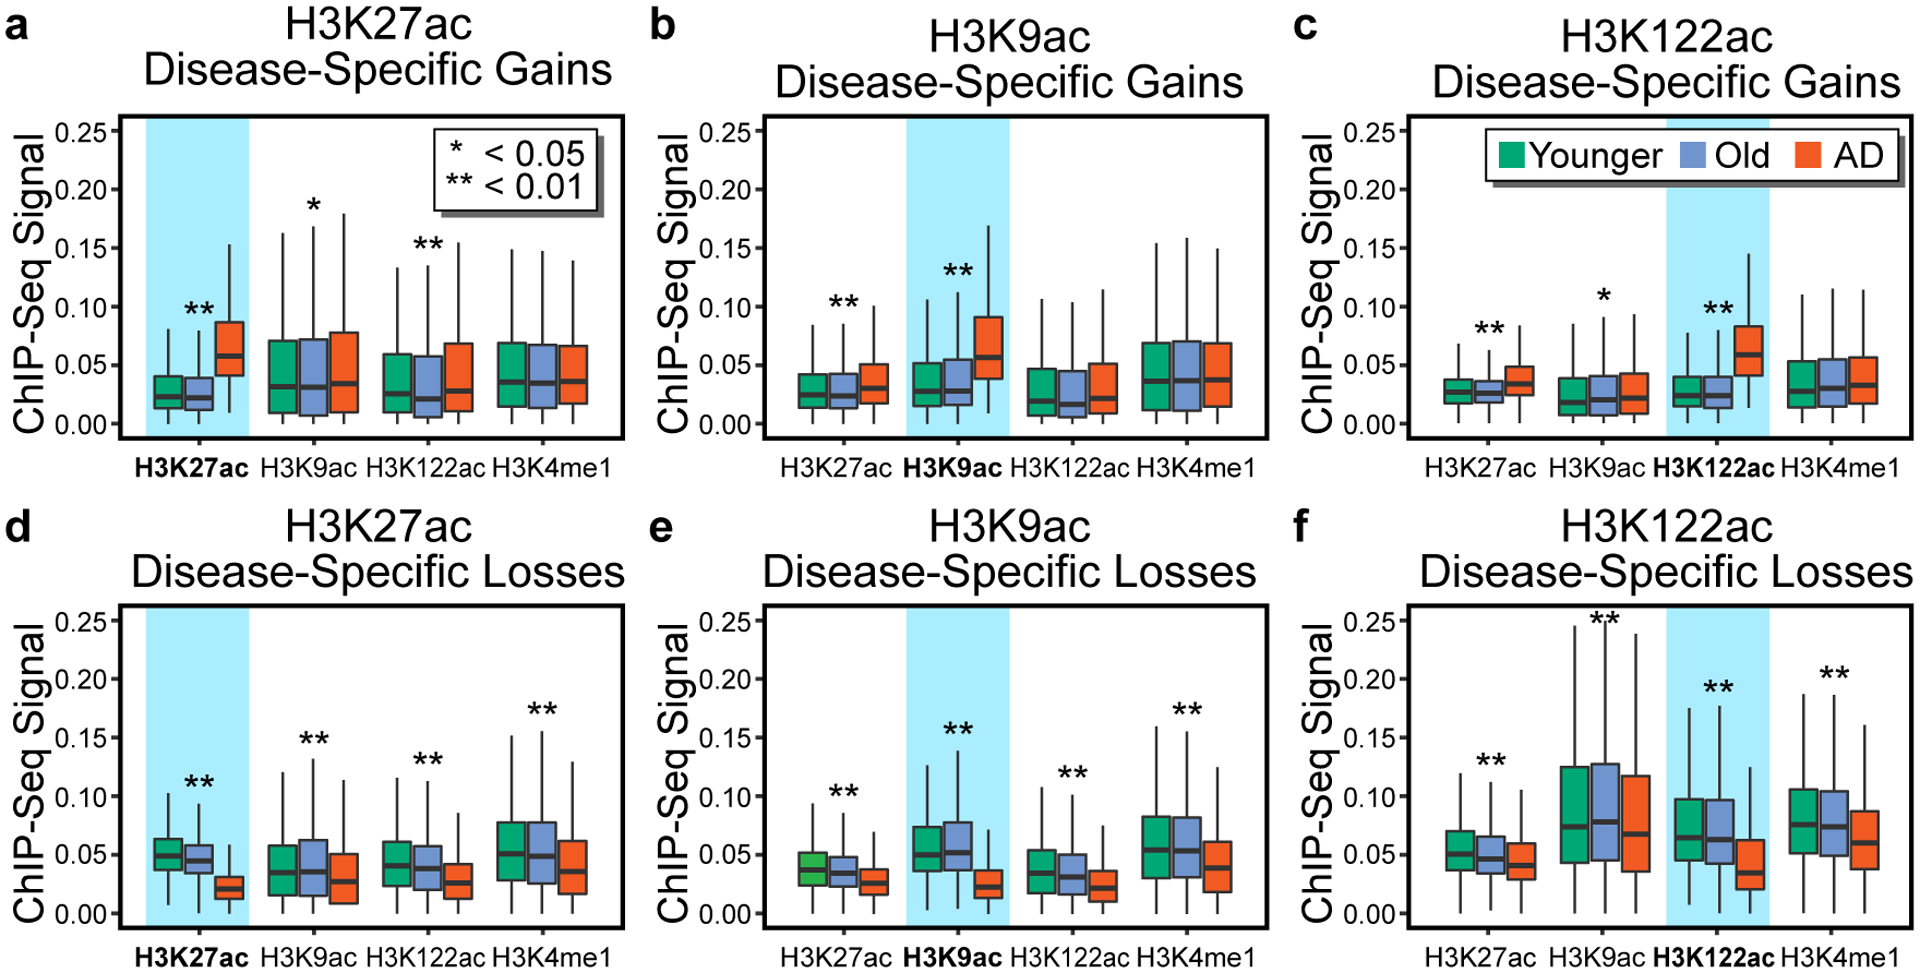
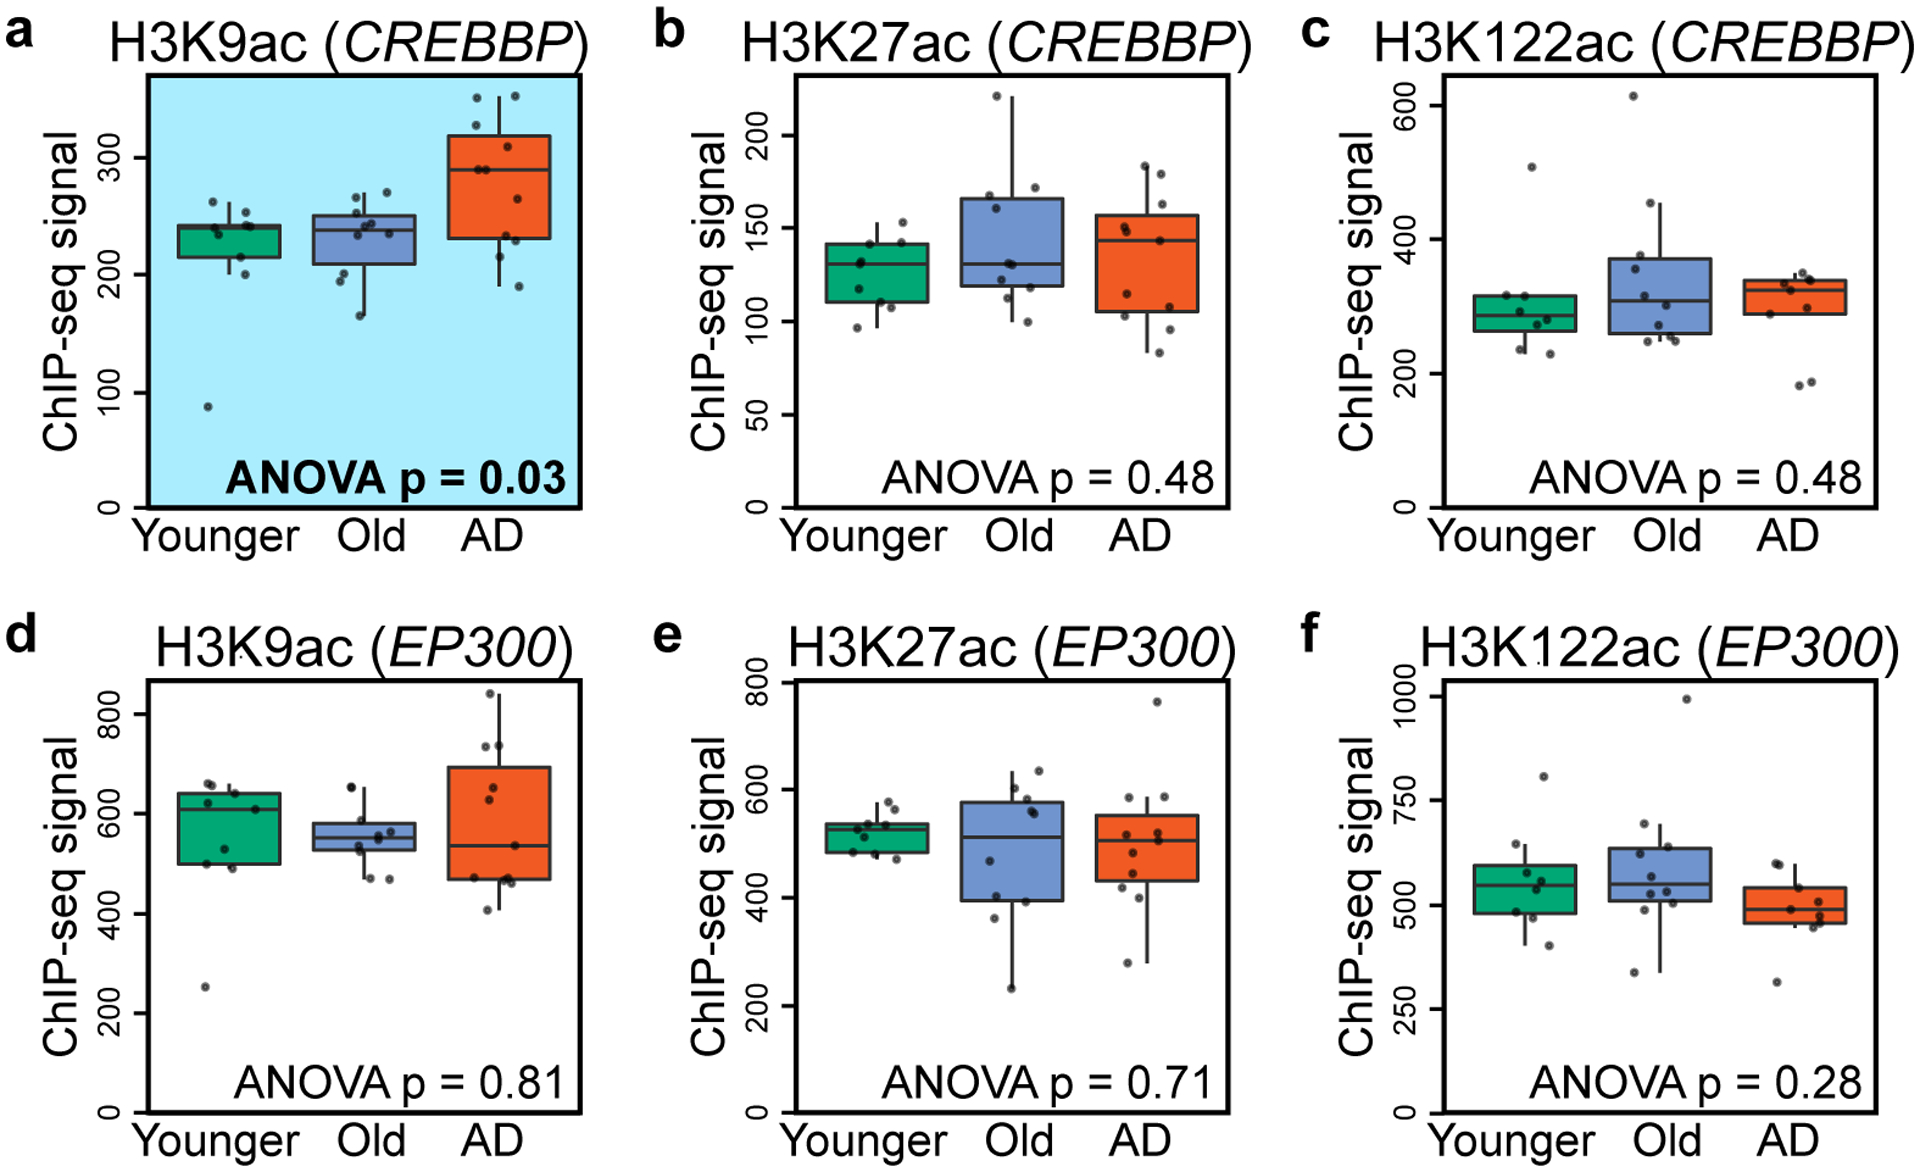
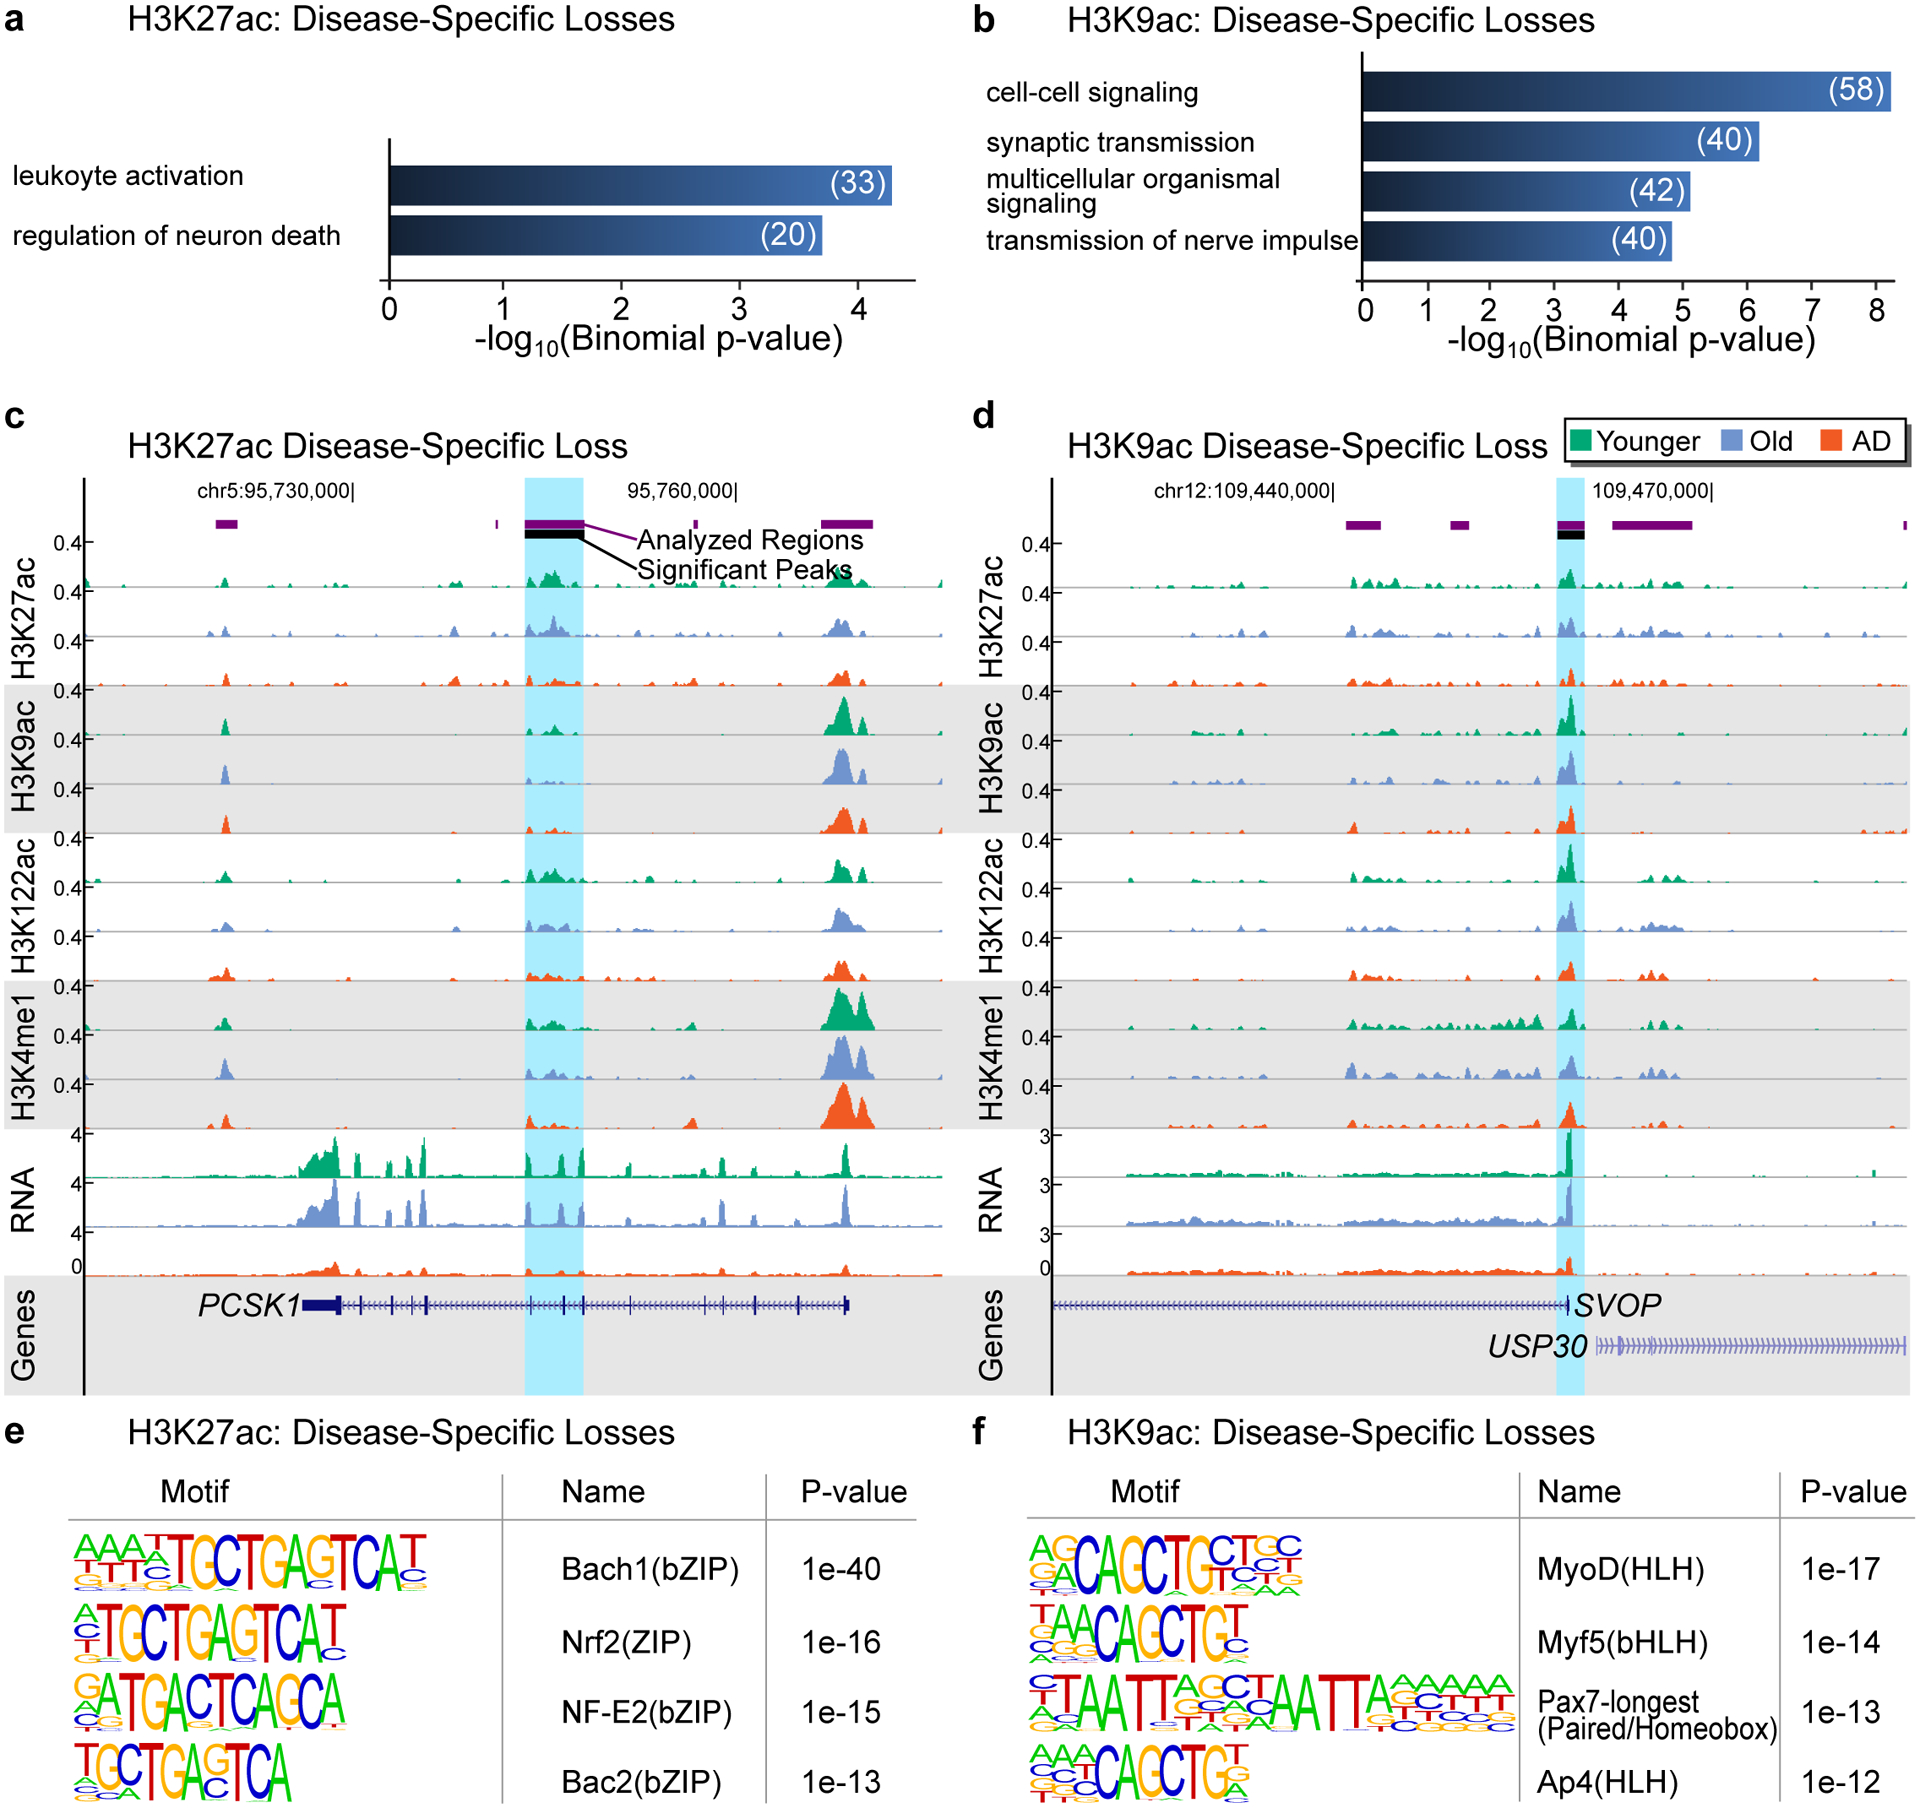
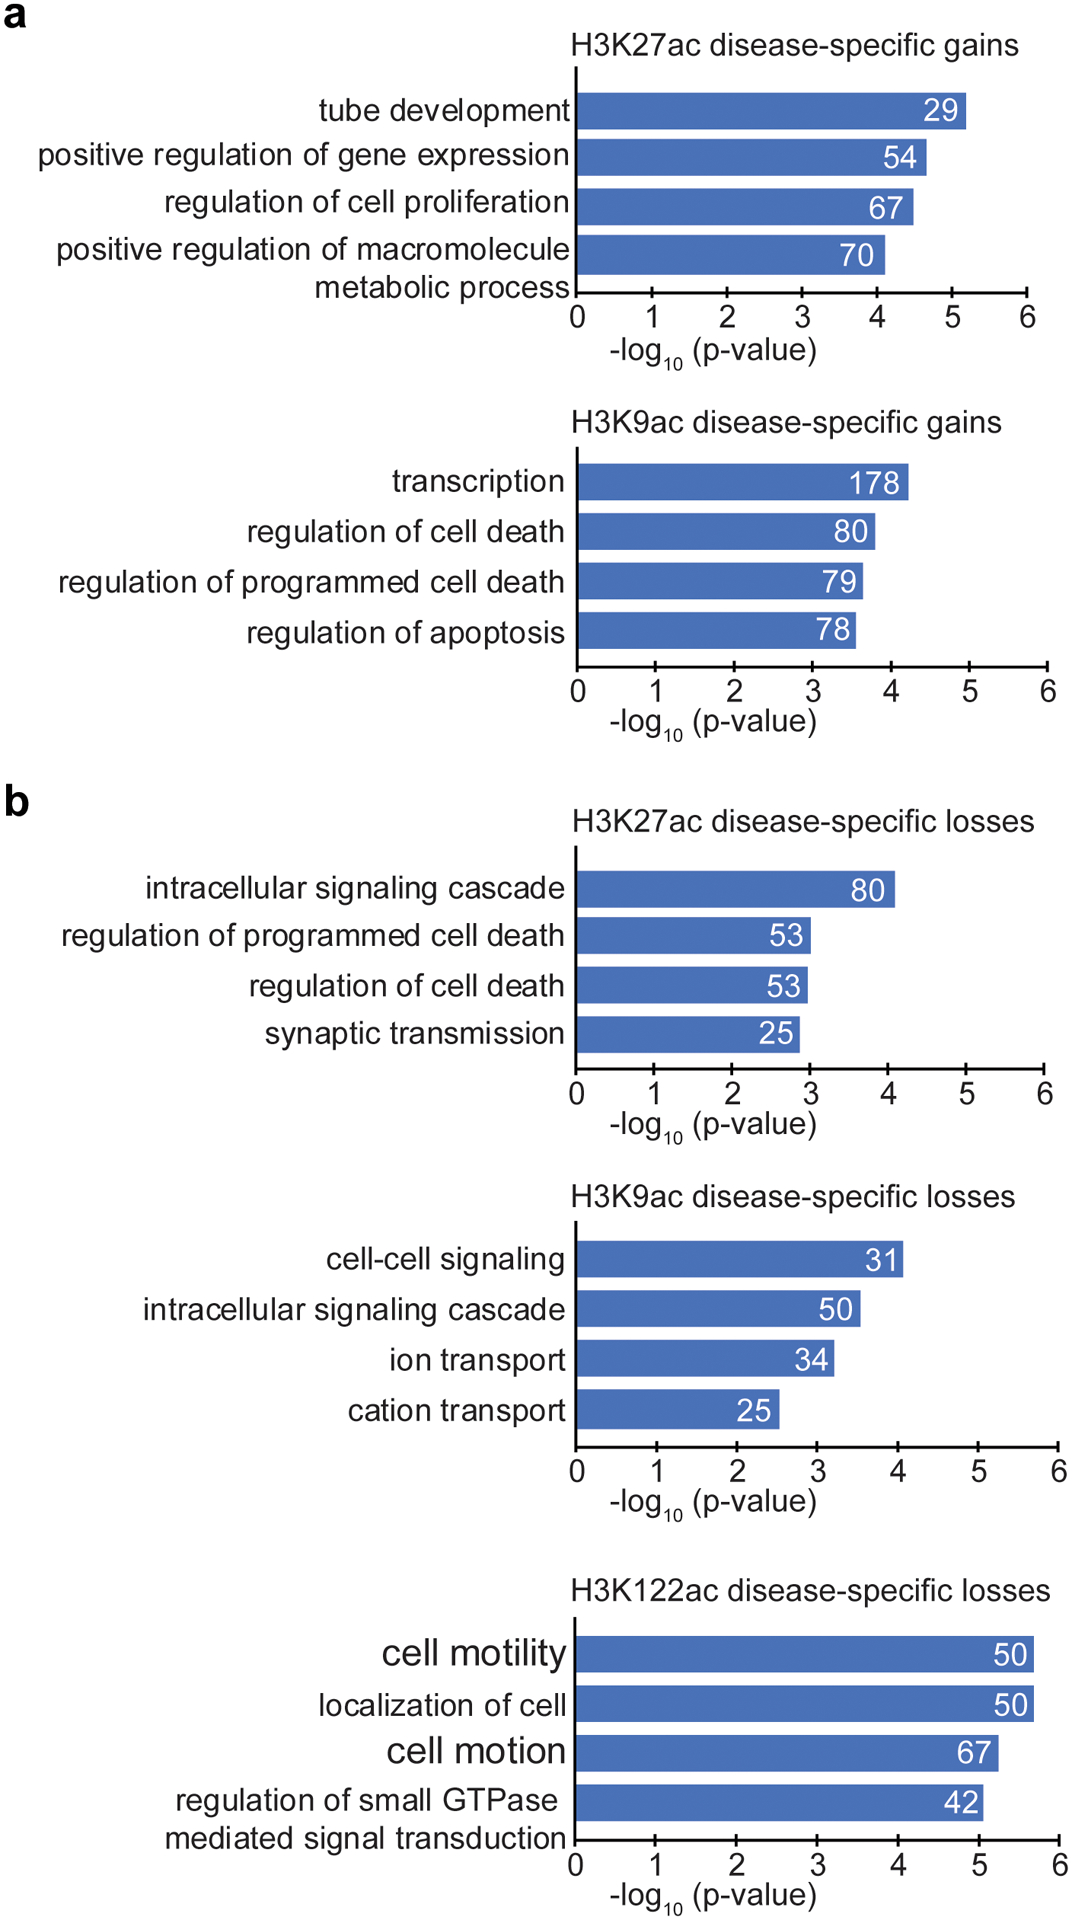
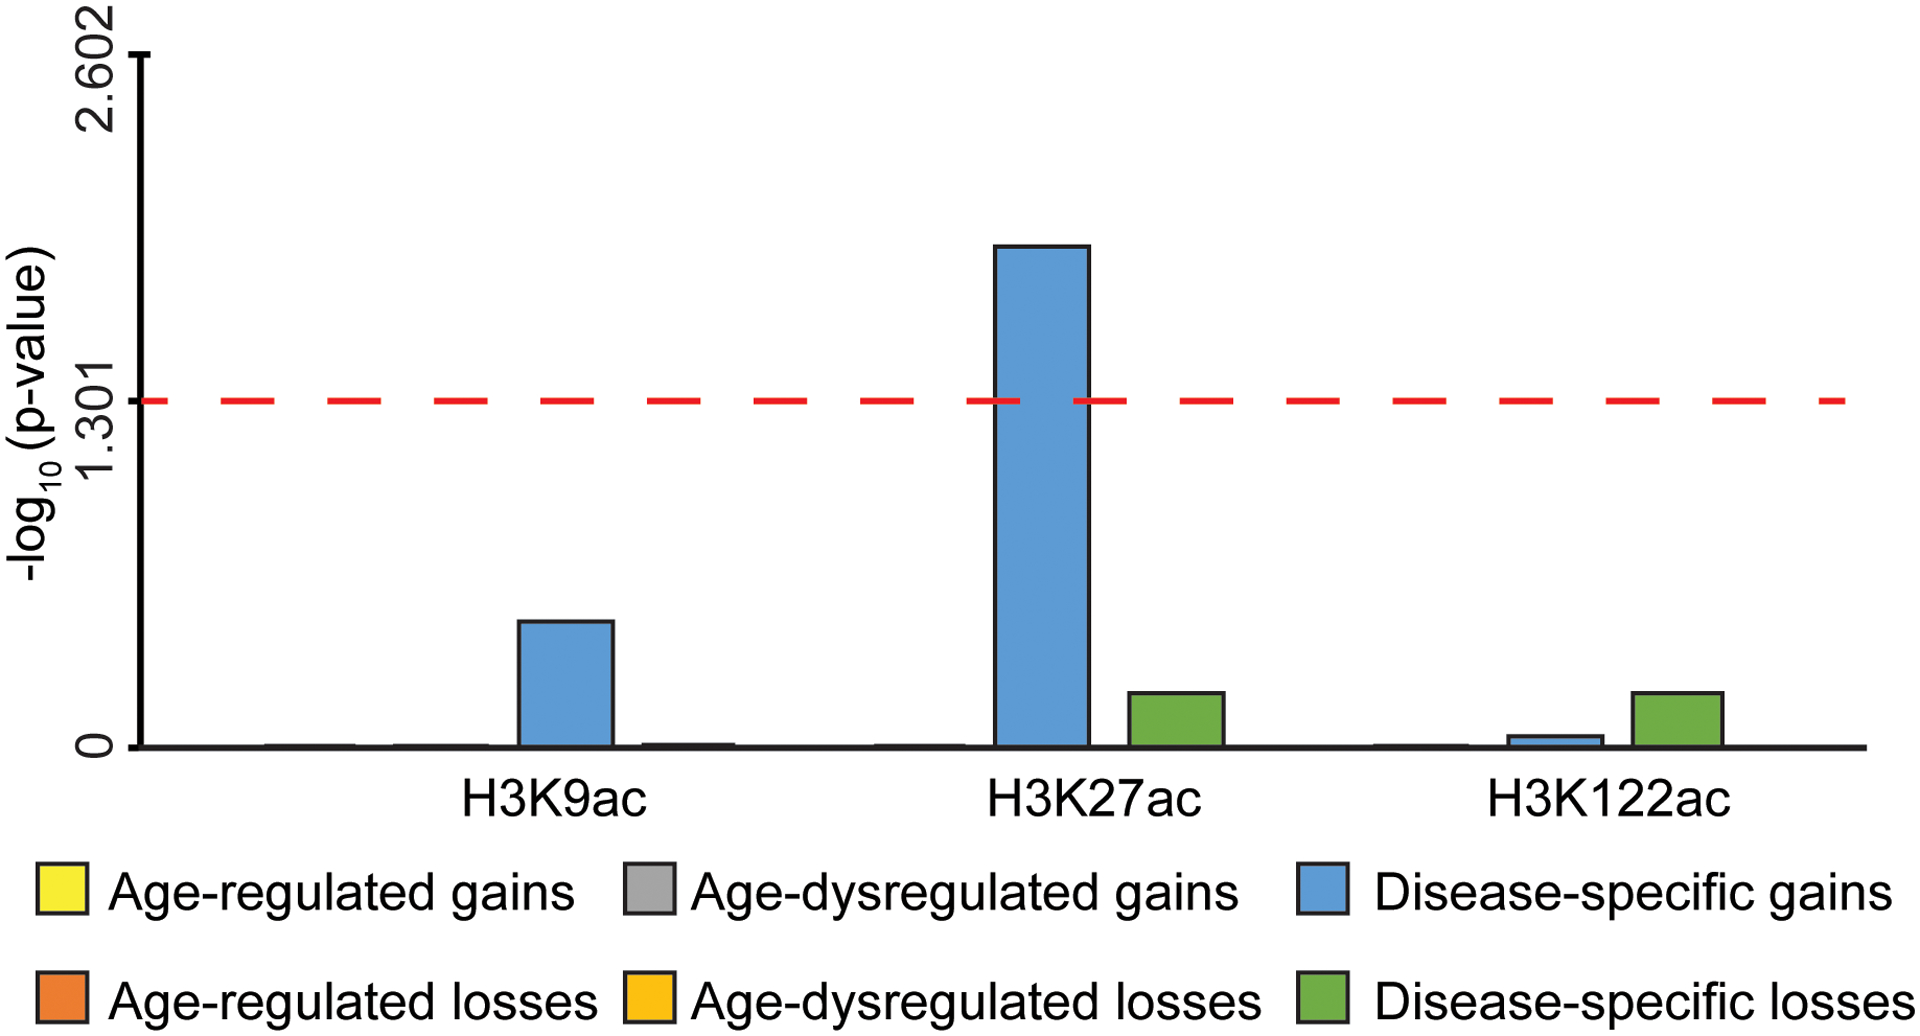
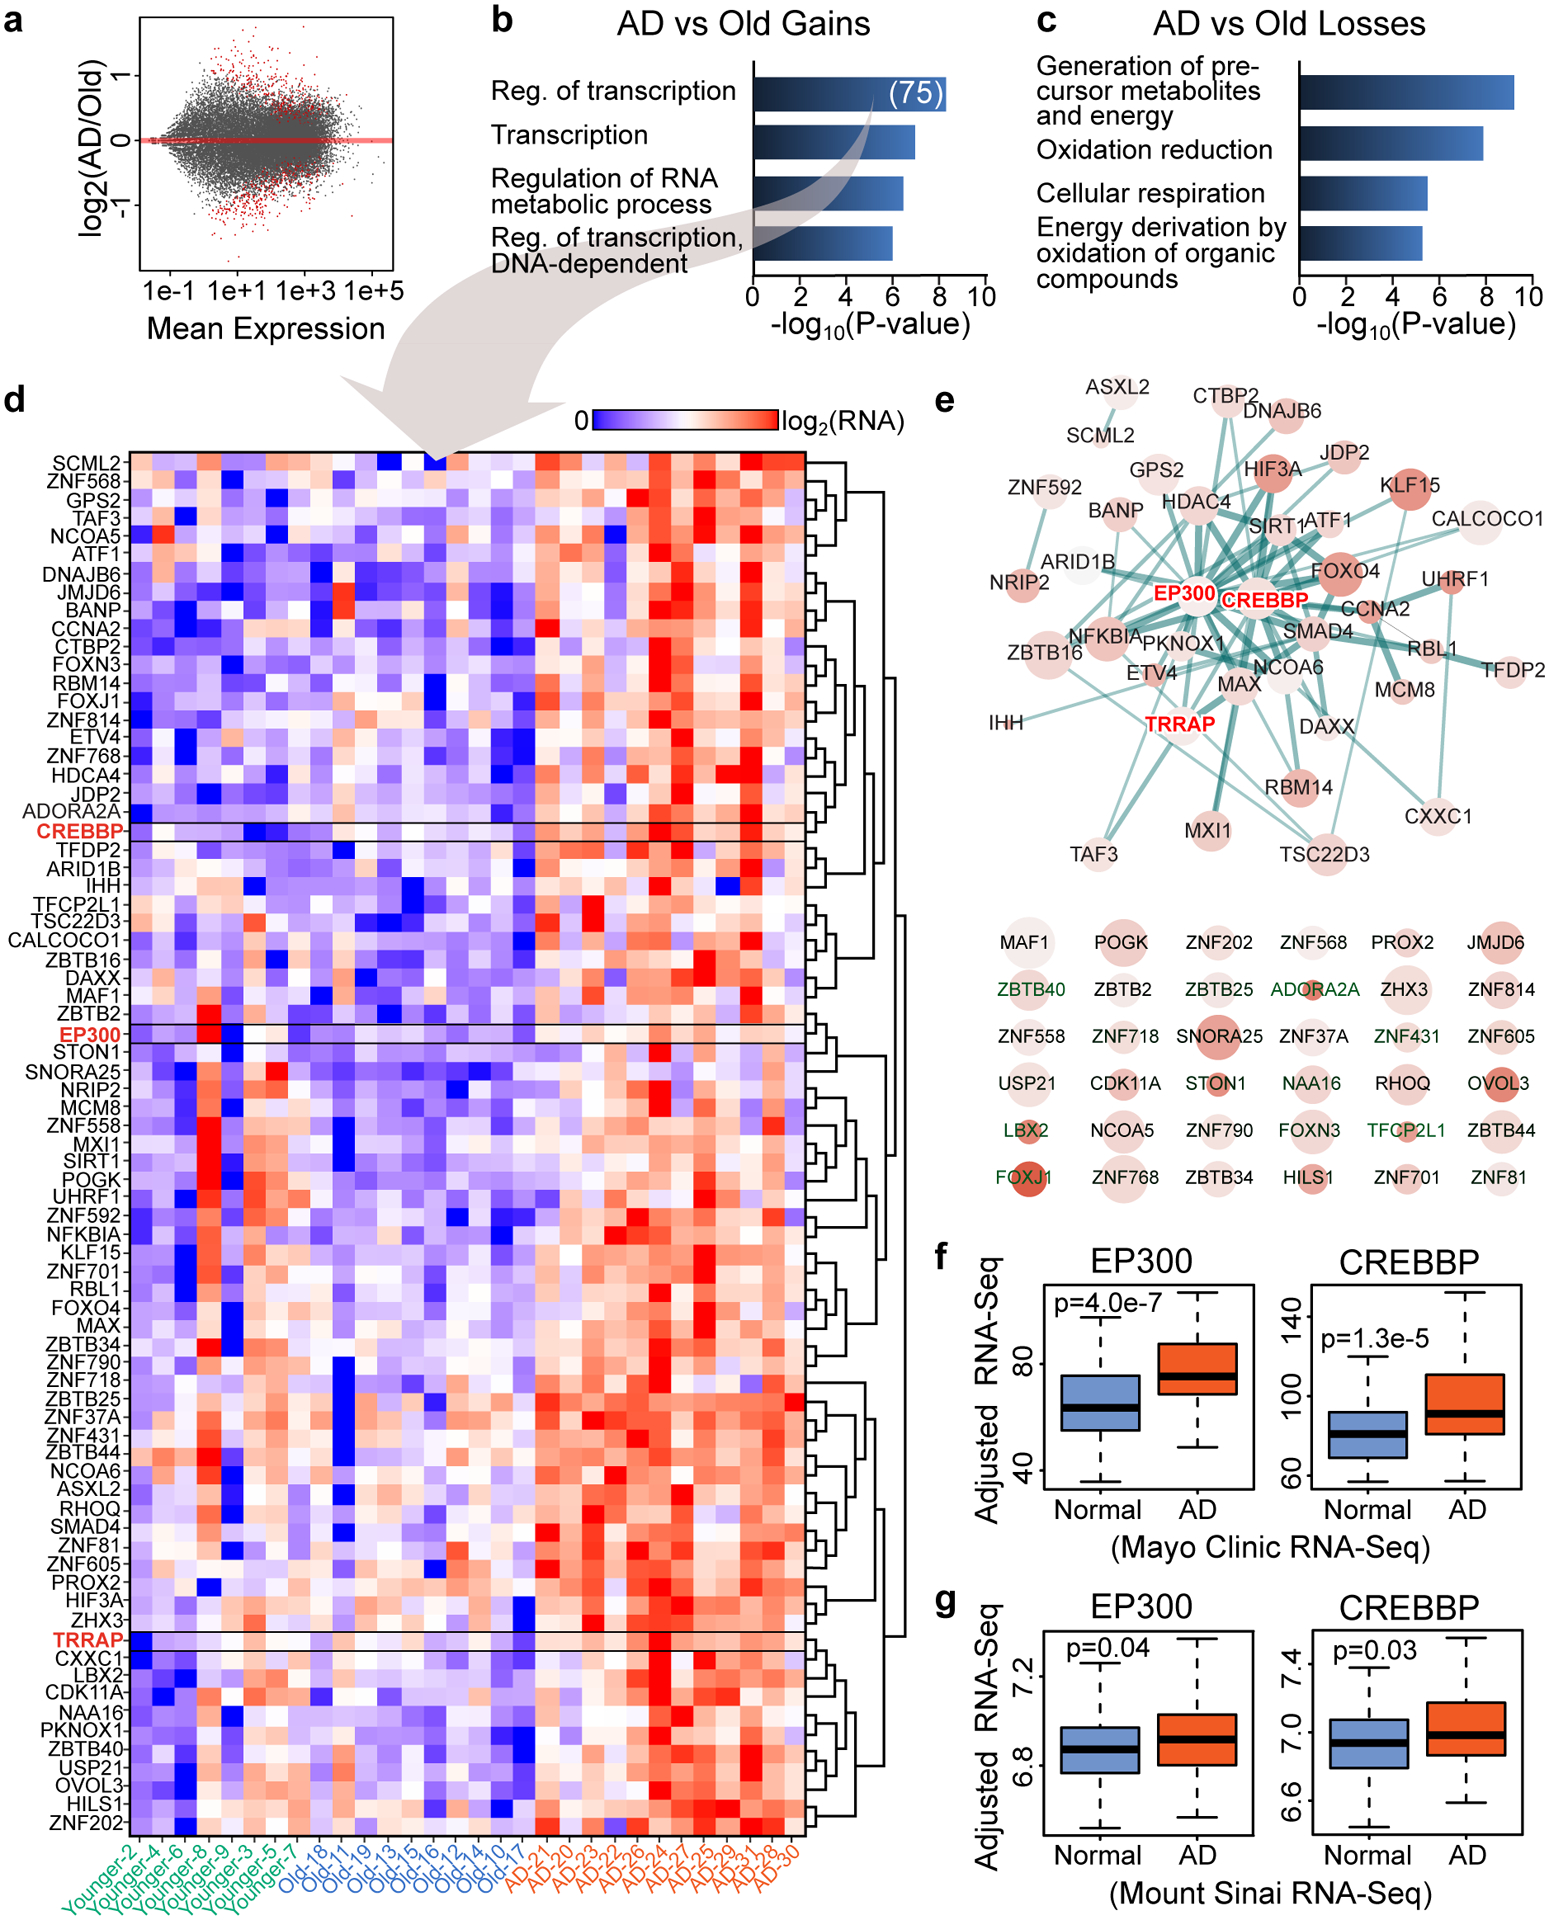
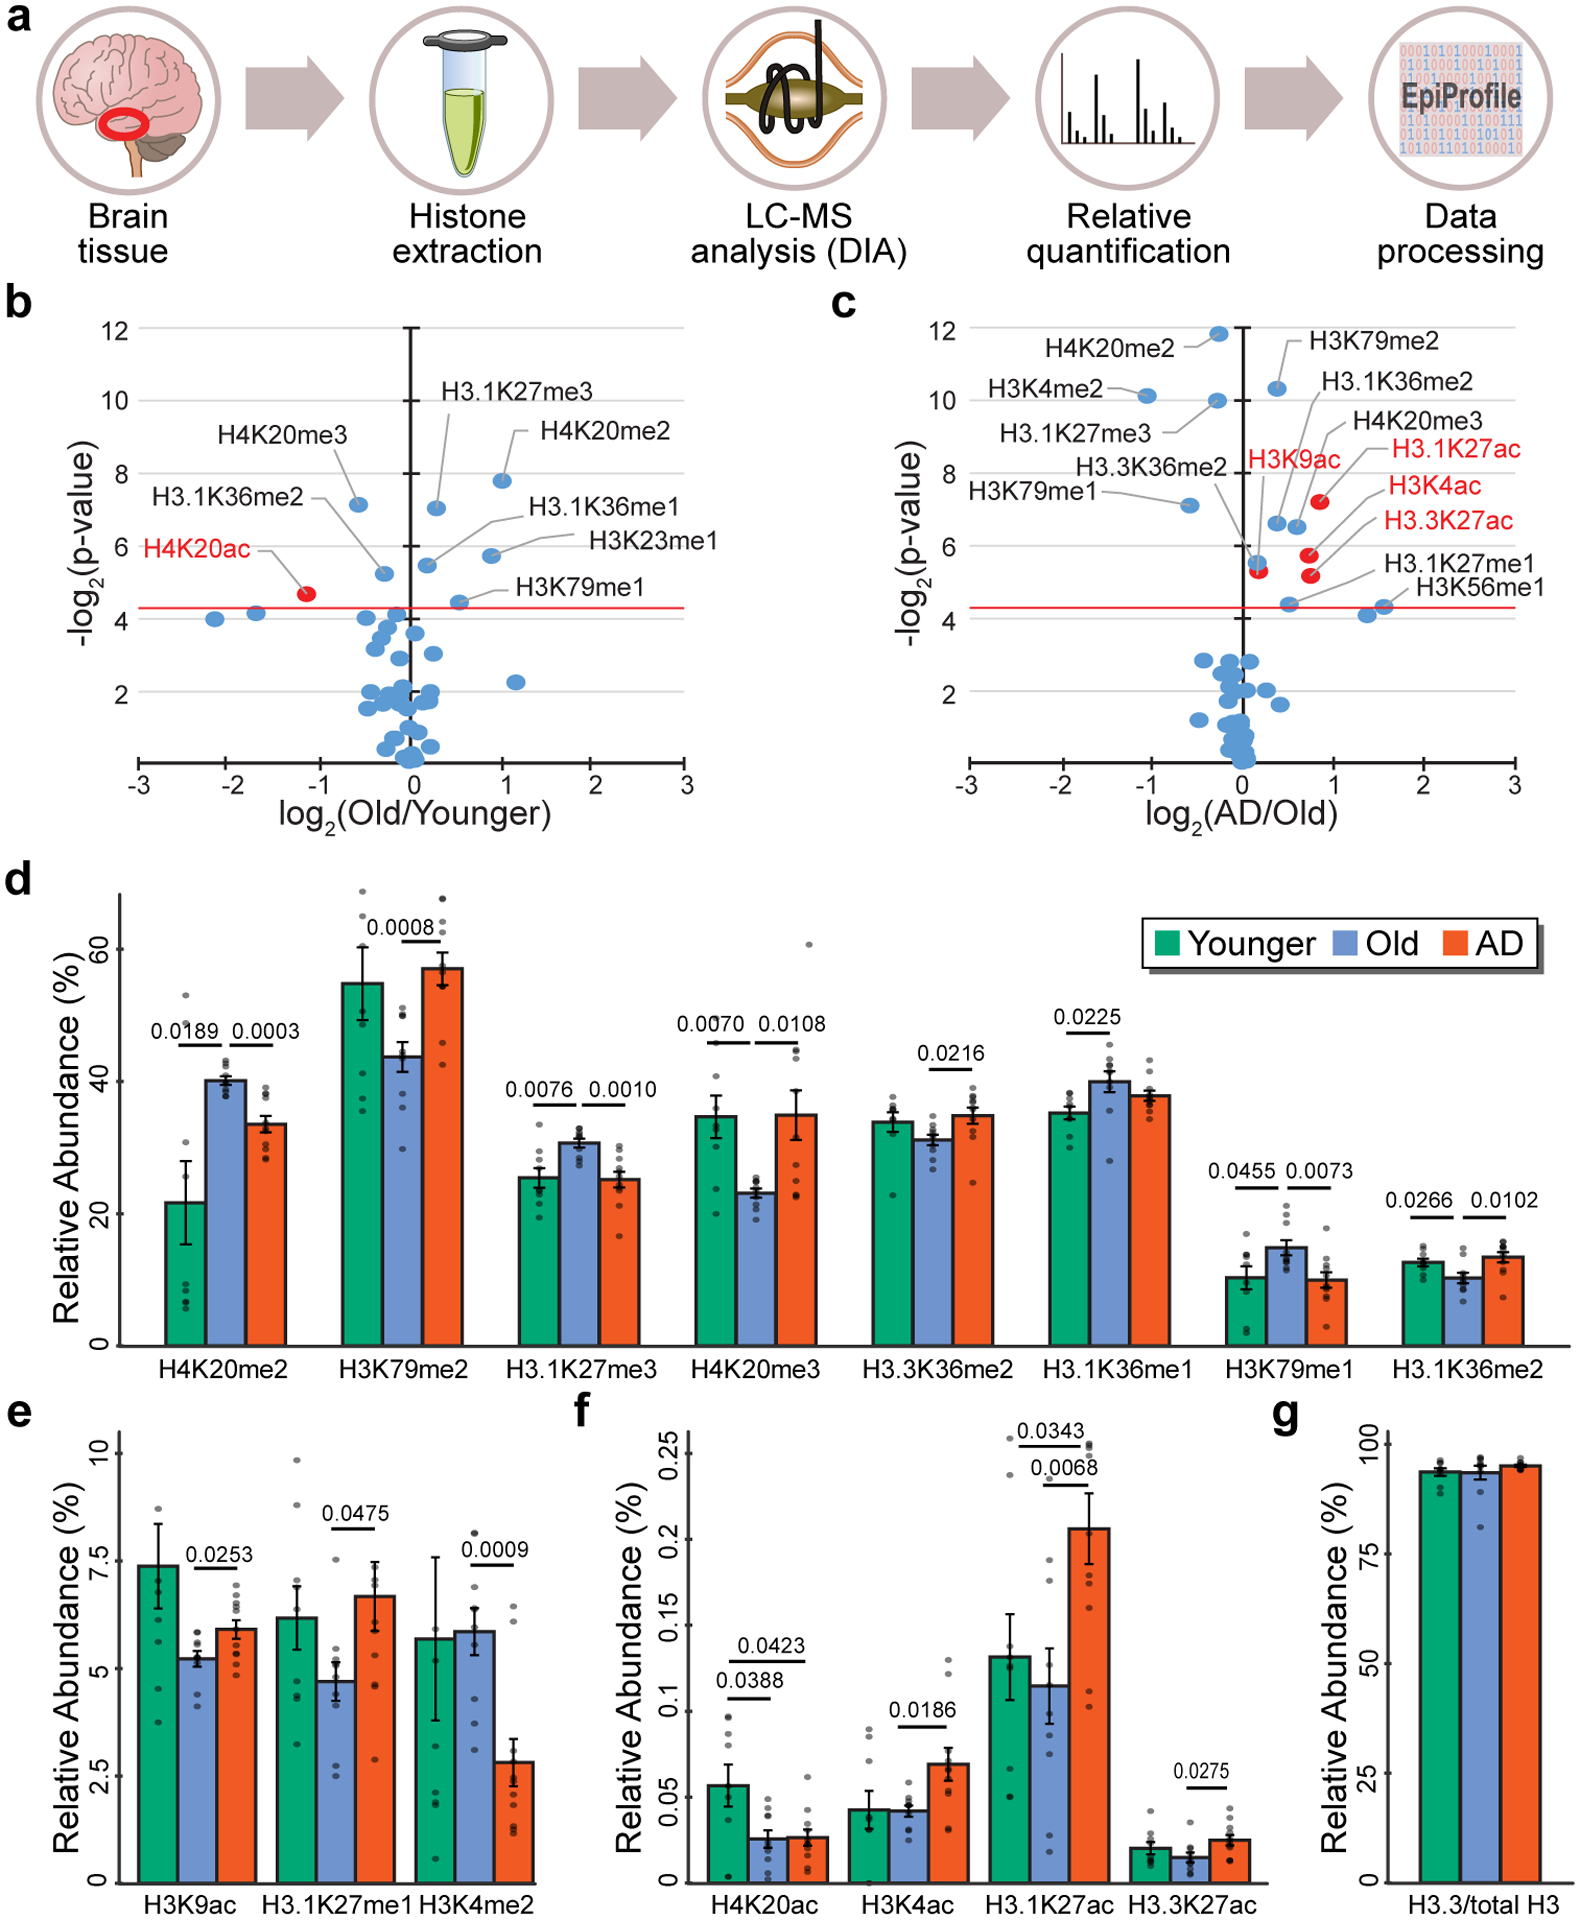
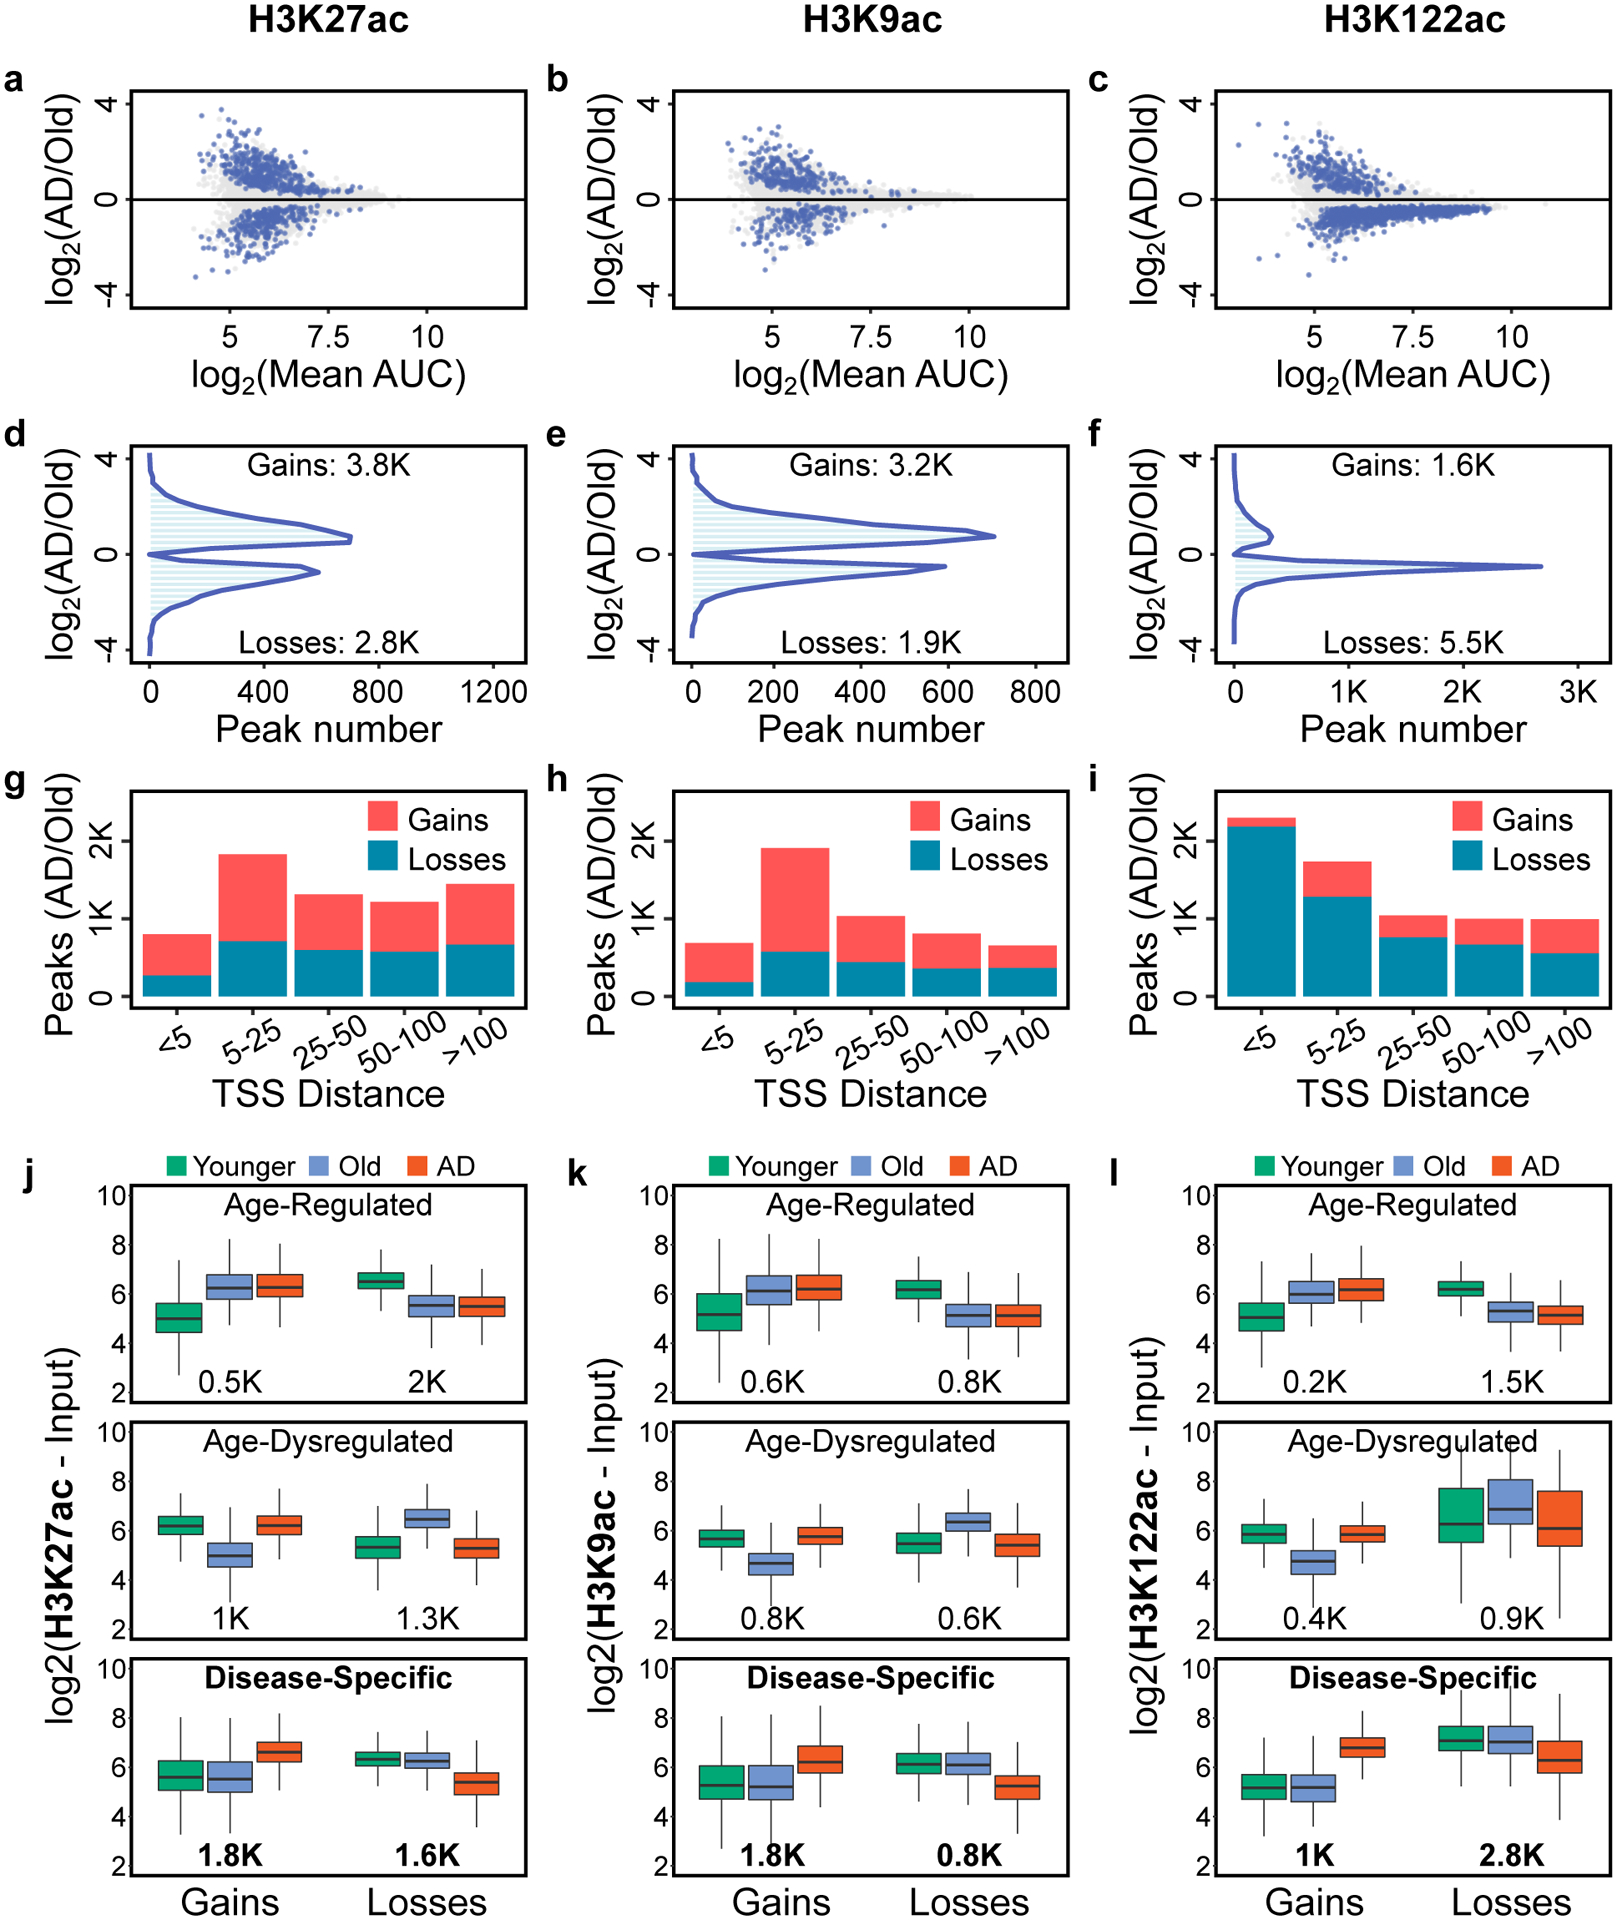
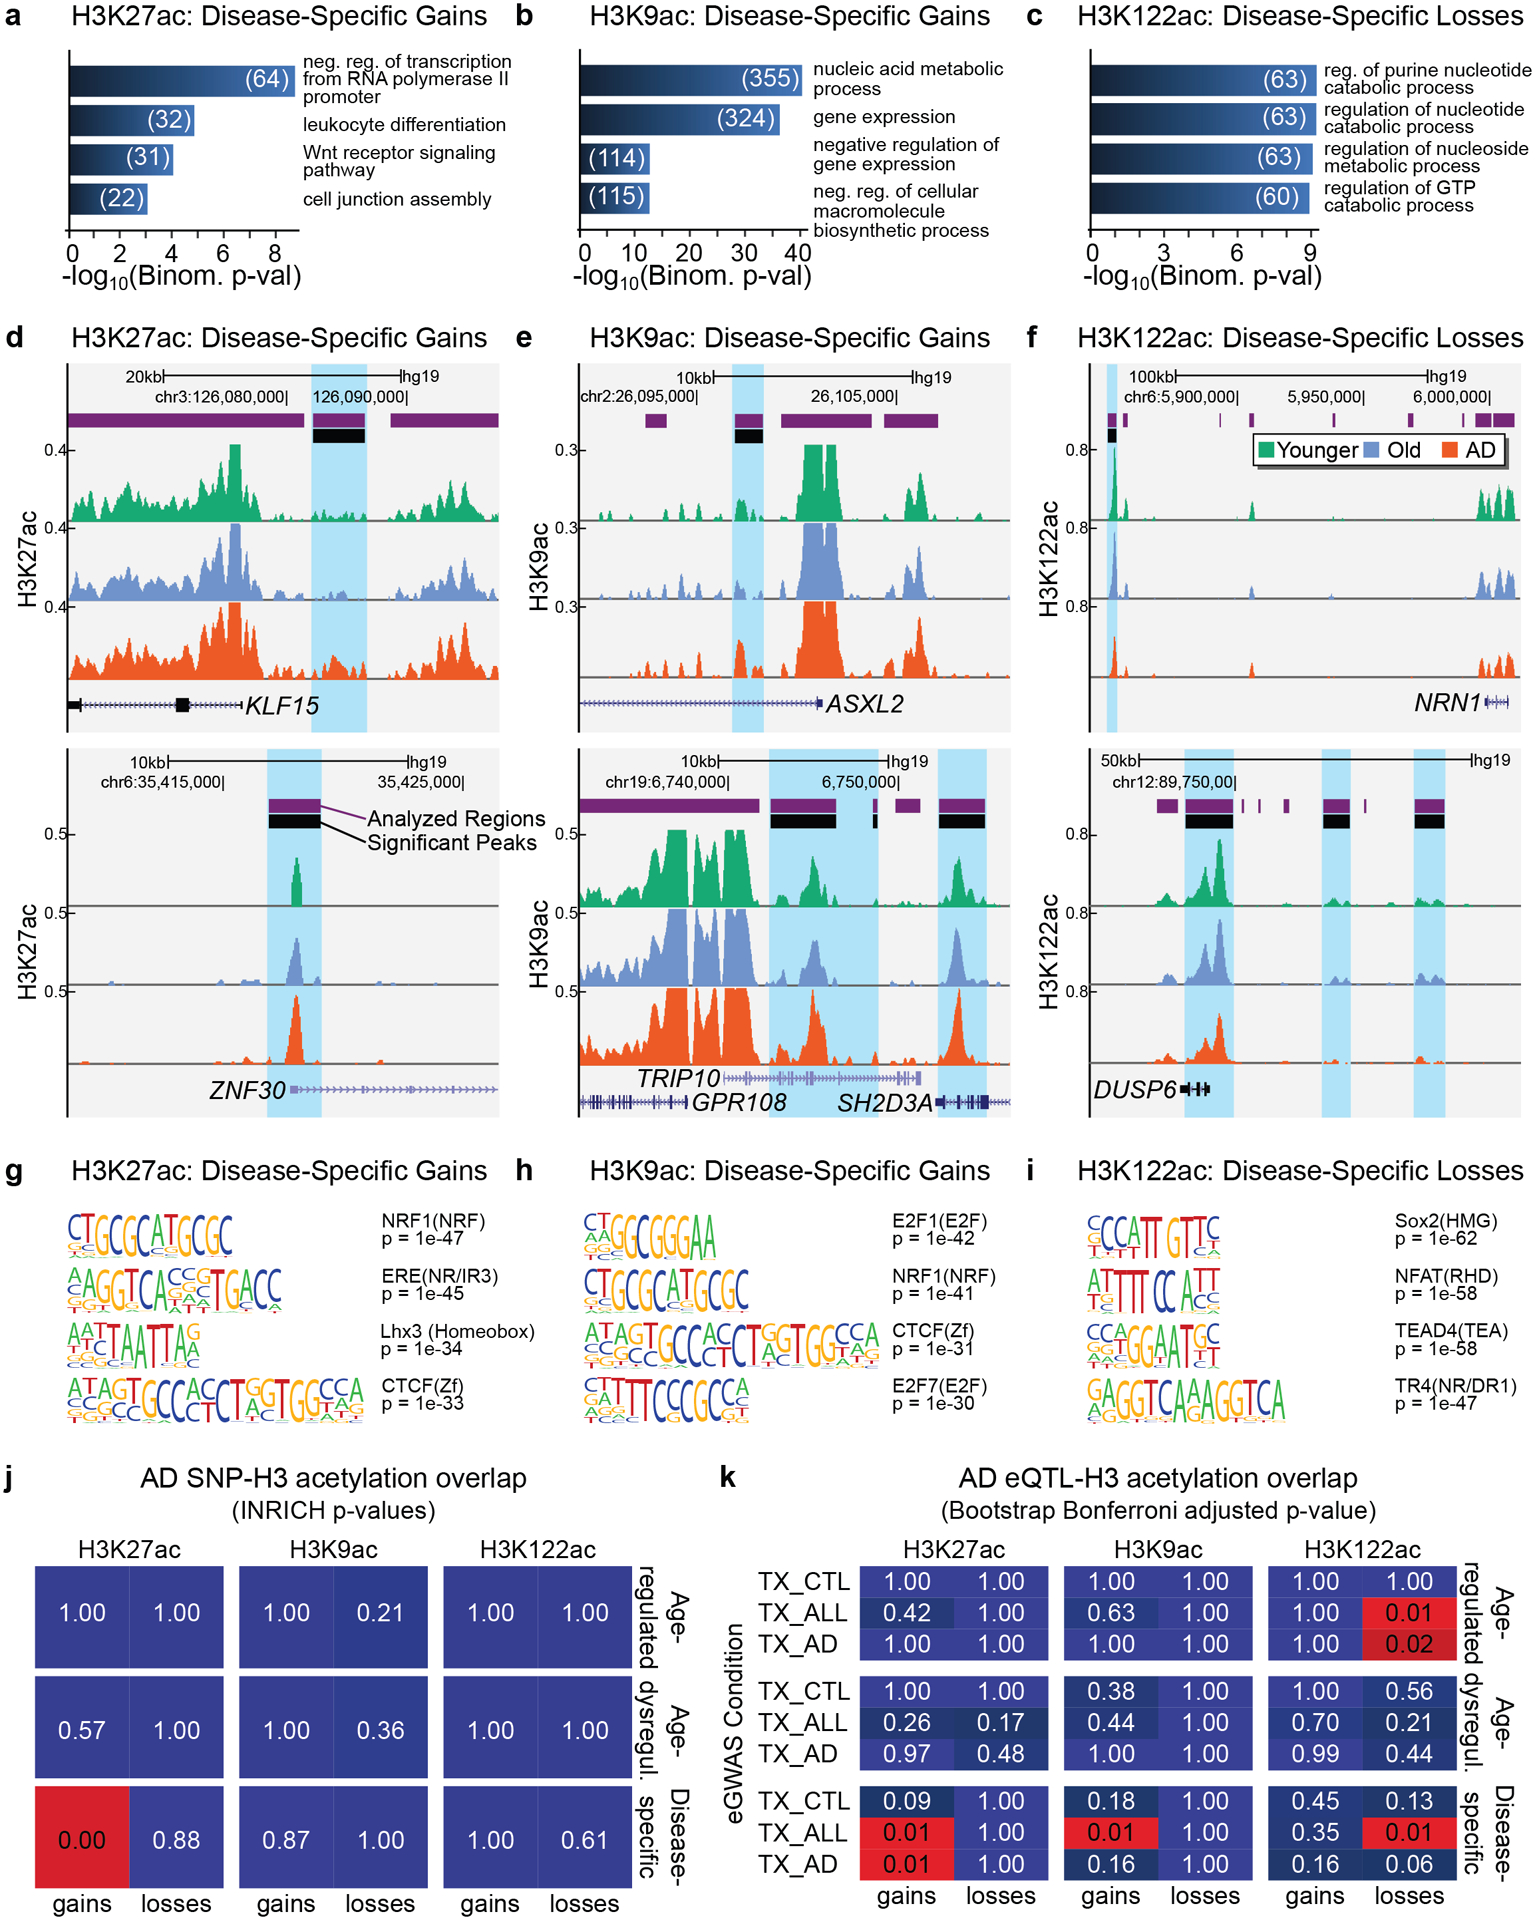
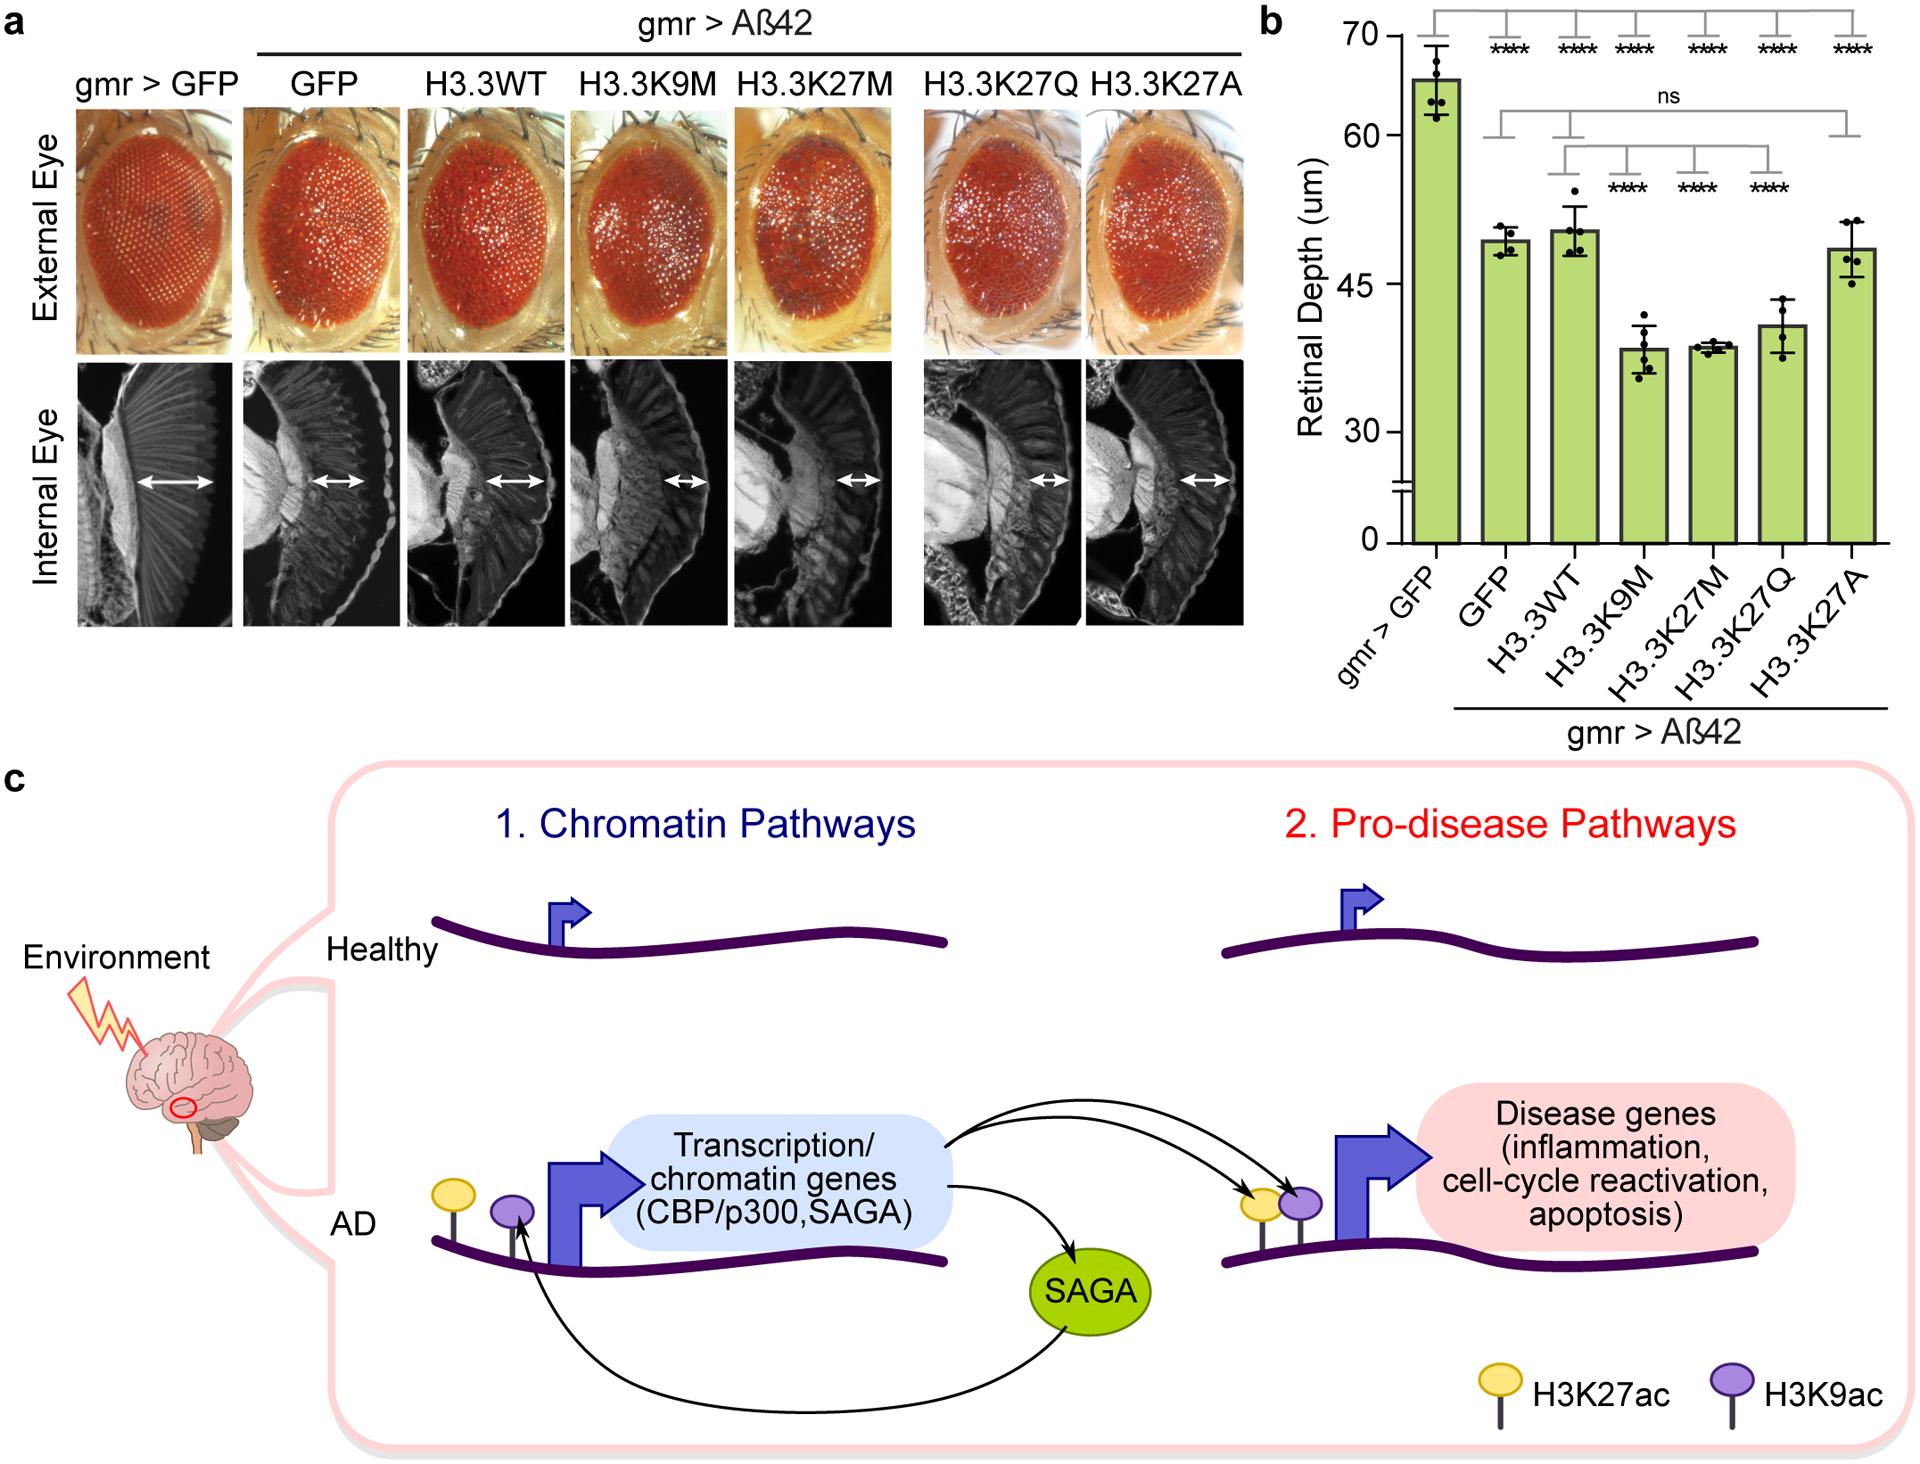
Protein aggregation is the hallmark of neurodegeneration, but the molecular mechanisms underlying late-onset Alzheimer's disease (AD) are unclear. Here we integrated transcriptomic, proteomic and epigenomic analyses of postmortem human brains to identify molecular pathways involved in AD. RNA sequencing analysis revealed upregulation of transcription- and chromatin-related genes, including the histone acetyltransferases for H3K27ac and H3K9ac. An unbiased proteomic screening singled out H3K27ac and H3K9ac as the main enrichments specific to AD. In turn, epigenomic profiling revealed gains in the histone H3 modifications H3K27ac and H3K9ac linked to transcription, chromatin and disease pathways in AD. Increasing genome-wide H3K27ac and H3K9ac in a fly model of AD exacerbated amyloid-β42-driven neurodegeneration. Together, these findings suggest that AD involves a reconfiguration of the epigenome, wherein H3K27ac and H3K9ac affect disease pathways by dysregulating transcription- and chromatin-gene feedback loops. The identification of this process highlights potential epigenetic strategies for early-stage disease treatment.


Conflict of interest statement

Competing interests

C.H. holds a patent on technology used (US8741567) and is a shareholder in Shanghai Epican Genetech LTD.

Figures

Extended Data Fig. 1
Extended Data Fig. 1. STRING network analysis for genes changing in AD
(a) Barplot showing the number of STRING (v11) interactions for genes with the top number of interactions in Fig. 1e. (b) STRING interaction network for genes changing in AD vs Old (q < 0.05) that interact with EP300, CREBBP and TRAPP. Interactions that were identified in Fig. 1e are not shown in this network. The gene network was visualized with Cytoscape (v3.6). Size of nodes represents RNA expression values, the color represents gene expression changes (log2 fold-change) in the AD vs Old comparison (red for upregulated in AD; blue for downregulated in AD) and the thickness of the line is the confidence of the interaction calculated by STRING. Nodes circled in red or blue represent known transcription and chromatin genes.
Extended Data Fig. 2
Extended Data Fig. 2. Histone posttranslational modifications in Younger, Old and AD
(a) Amino acid sequence of canonical histone H3 (H3.1 and H3.2) tail and globular domain, and its H3.3 variant. The residue that differs between canonical H3 and H3.3 is highlighted in red. (b) Amino acid sequence of histone H4 tail and globular domain. Bars below the amino acid sequence in panels a-b represent peptides generated in the trypsinization process that were identified on the mass spectrometer (LC-MS/MS). Grey bars represent peptides not reliably detected and therefore excluded from the analysis. (c-e) Stacked bar plots showing relative abundance of histone modifications (methylation and acetylation) on histones H3, H3.3 and H4 in (c) Younger, (d) Old and (e) AD. The lysine residues (K) analyzed are listed below the stacked bar plots.
Extended Data Fig. 3
Extended Data Fig. 3. Histone acetyl marks are enriched at both TSS and enhancers
Metaplots showing peak enrichment of H3K27ac, H3K9ac and H3K122ac and corresponding 5hmC and H3K4me1 enrichments for peaks at transcriptional start sites (TSSs) (≤ 1 Kb from TSS) and enhancer (Enh) sites (> 1Kb from TSS) in (a-f) Younger, (g-l) Old and (m-r) AD brains. Histone acetyl-peaks are enriched at both TSSs and enhancers, while 5hmC and H3K4me1 mark enhancer sites.
Extended Data Fig. 4
Extended Data Fig. 4. H3K27ac, H3K9ac and H3K122ac peak distribution in Younger, Old and AD
(a) Histogram of peak density for H3K27ac (light green), H3K9ac (light blue) and H3K122ac (light red), based on their distance from the transcriptional start site (TSS) for peaks detected in Younger, Old and AD. Grey vertical lines demark (from left to right): 5, 25, 50 and 100 Kb distance from TSS. (b-d) Venn Diagram showing the overlap between H3K27ac, H3K9ac and H3K122ac peaks for (b) All peaks, (c) TSS peaks (≤ 1Kb from TSS) and (d) enhancer (Enh) peaks (> 1Kb from TSS) detected in Younger, Old and AD.
Extended Data Fig. 5
Extended Data Fig. 5. Correlation between ChIP-seq and RNA-seq data
(a-c) Scatterplot of (a) H3K27ac, (b) H3K9ac and (c) H3K122ac peak enrichment vs gene expression for genes expressed in Old. (d-f) Scatterplot of (d) H3K27ac, (e) H3K9ac and (f) H3K122ac peak enrichment vs gene expression for genes expressed in AD. For graphical representation in a-b, 3000 randomly chosen points are shown in each panel. (g-i) Scatterplot of (g) H3K27ac, (h) H3K9ac and (i) H3K122ac absolute peak fold-change vs absolute gene expression change for significantly (q < 0.05) differentially expressed genes in AD vs Old. (j,k) Scatterplot of total acetyl-peak enrichment (H3K-total-ac; sum of H3K27ac, H3K9ac and H3K122ac peak enrichment at the same site) vs gene expression for genes expressed in (j) Old and (k) AD. (l) Scatterplot of H3K-total-ac absolute peak fold-change vs absolute gene expression change for significantly (q < 0.05) differentially expressed genes in AD vs Old. The closest peak to the TSS was chosen for these analyses. Linear regression trendlines, Pearson’s correlation coefficients and p-values (test for association using Pearson’s product moment correlation coefficient implemented by R stats package, two-sided) are indicated in each panel (a-l).
Extended Data Fig. 6
Extended Data Fig. 6. Comparison between histone marks enrichments at sites with disease-specific changes
(a-c) Boxplots showing H3K27ac, H3K9ac, H3K122ac and H3K4me1 peak enrichment at sites with (a) H3K27ac, (b) H3K9ac, (c) H3K122ac (highlighted in blue) disease-specific gains. (d-f) Boxplots showing H3K9ac, H3K122ac and H3K4me1 peak enrichment at sites with (d) H3K27ac, (e) H3K9ac and (f) H3K122ac (highlighted in blue) disease-specific losses. Asterisks in (a-f) denote level of significance comparing peak enrichment across Younger (N = 11–12), Old (N = 10) and AD (N = 9–11) (* P < 0.05; ** P < 0.01, 1-way ANOVA) (Supplementary Table 2). Boxplots show minimum, first quartile, median (center line), third quartile and maximum.
Extended Data Fig. 7
Extended Data Fig. 7. H3K9ac disease-specific gain at CREBBP but not EP300
(a-c) Boxplot showing (a) H3K9ac, (b) H3K27ac and (c) H3K122ac peak enrichment at the CREBBP gene in Younger, Old and AD. A H3K9ac disease-specific gain is observed at CREBBP (highlighted in blue in a). (d-f) Boxplot showing (d) H3K9ac, (e) H3K27ac (f) H3K122ac peak enrichment at the EP300 gene in Younger, Old and AD showing no disease-specific changes. The closest peak to the gene was considered for this analysis. P-values comparing peak enrichment across Younger (N = 8–9), Old (N = 10) and AD (N = 9–11) (Supplementary Table 2) (1-way ANOVA) are reported in each panel. Boxplots show minimum, first quartile, median (center line), third quartile and maximum. Dots overlaid on boxplots represent individual data points.
Extended Data Fig. 8
Extended Data Fig. 8. Functional analysis of H3K27ac and H3K9ac disease-specific losses
(a,b) Barplot showing top GO terms (Biological Processes; GREAT, FDR < 5%, % by both the binomial and the hypergeometric tests) for (a) H3K27ac disease-specific losses and (b) H3K9ac disease-specific losses for terms with at least 20 genes. (c,d) UCSC genome browser view showing an example of (c) H3K27ac disease-specific loss at the PCSK1 gene and (d) H3K9ac disease-specific loss at the SVOP gene. H3K27ac, H3K9ac, H3K122ac, H3K4me1 ChIP-seq and RNA-seq tracks are showed for Younger, Old and AD. (e,f) Top DNA motifs (HOMER v4.6) for (e) H3K27ac disease-specific losses and (f) H3K9ac disease-specific losses in AD. Enrichment results are shown for known motifs (q < 0.05, Benjamini-Hochberg).
Extended Data Fig. 9
Extended Data Fig. 9. Functional analysis of disease-specific changes using DAVID
(a,b) Barplot showing top GO terms (Biological Processes, DAVID v6.7, FDR < 10%, Yekutieli) for genes targeted by (a) disease-specific gains (H3K27ac or H3K9ac) and (b) disease-specific losses (either H3K27 or H3K9ac or H3K122ac) for terms with at least 20 genes.
Extended Data Fig. 10
Extended Data Fig. 10. H3K27ac disease-specific gains are enriched with AD GWAS SNPs from Kunkle et al.
Bar plot showing the significance (-log10 p-value) of the association between each of the six classes of H3K27ac, H3K9ac and H3K122ac changes (age-regulated gains or losses, age-dysregulated gains or losses and disease-specific gains or losses) and AD SNP-regions from Kunkle et al. using INRICH. Red dashed horizontal line represents the threshold of significance (P < 0.05).
Figure 1.
Figure 1.. Transcriptomic analysis identifies upregulation of transcription- and chromatin-related genes in AD.
(a) Scatterplot showing gene expression changes vs. Mean expression in the AD vs. Old comparison. Red dots represent significant differentially expressed genes (q < 0.05, DESeq2). (b,c) Barplot showing top GO terms (Biological Process, DAVID, FDR < 10%, Yekutieli) for genes that are significantly (b) upregulated or (c) downregulated in AD vs. Old (q < 0.05, DESeq2). (D) Heatmap showing gene expression in Younger, Old and AD for genes that are in the GO term “Regulation of transcription” in panel b (N = 75). CREBBP, EP300 and TRRAP are highlighted in red. (e) STRING (v11) analysis for the 75 transcription- and chromatin-related genes (in panel d) revealing a protein interaction network of 35 gene products (top) with CREBBP and EP300 at the center of the network. Genes not involved in any interaction are also showed (bottom). The STRING network was visualized using Cytoscape (v3.6) where node size represents gene expression in AD, the color intensity represents gene expression changes in AD vs. Old and the thickness of the lines represents the strength of the STRING interaction. (f,g) Boxplots showing CREBBP and EP300 expression in two published RNA-seq data of control (Normal) and AD brains from (f) the Mayo Clinic (temporal cortex) (N = 203) from Allen et al. and (g) the Mount Sinai brain bank (Brodmann area 22 temporal cortex) (N = 160) from Wang et al.. Boxplots show minimum, first quartile, median (center line), third quartile and maximum. P values (two-sided Wilcoxon rank-sum test) of the comparison between AD and Normal are reported in each panel.
Figure 2.
Figure 2.. Mass spectrometry analysis identifies histone acetylation and methylation changes in aging and AD.
(a) Pipeline of the proteomic experiment showing histone extraction from frozen brain tissue, histone derivatization, run of histone peptides on a nano LC-MS/MS setup, and quantification of relative histone posttranslational modifications (PTM) using EpiProfile 2.0 in Young (N = 9), Old (N = 10) and AD (N = 11). (b,c) Volcano plot showing histone PTMs changes vs. P value in the (b) Old vs. Younger and (c) AD vs. Old comparisons. The red horizontal line represents threshold of statistical significance (two-sided Student’s t-test). Significant histone acetylation changes are highlighted in red. (d-f) Barplot showing relative histone PTMs in Younger, Old and AD for histone PTMs with statistically significant differences in Old vs. Younger or in AD vs. Old. P-values are reported for statistically significant differences (P < 0.05, two-sided Student’s t-test). (g) Barplot of H3.3 vs. total H3 in Younger, Old and AD. Differences are not significant (P < 0.05, two-sided Student’s t-test). Bars in panels d-g represent the mean ± SD.
Figure 3.
Figure 3.. H3K27ac and H3K9ac disease-specific gains and H3K122ac disease-specific losses in AD.
(a-c) Scatterplot showing peak fold-change vs. mean peak enrichment (measured as AUC, area under the curve) for (a) H3K27ac, (b) H3K9ac and (c) H3K122ac peaks in the AD vs. Old comparison. Blue dots represent peaks with significant changes (P < 0.05, two-sided Wilcoxon rank-sum test). For graphical representation, 10K randomly chosen points are shown in each panel. (d-f) Histogram showing peak fold-change vs. number of peaks with significant changes (blue dots in panels a-c) for (d) H3K27ac, (e) H3K9ac and (f) H3K122ac peaks in the AD vs. Old comparison (P < 0.05, two-sided Wilcoxon rank-sum test). (g-i) Stacked barplot showing number of (g) H3K27ac, (h) H3K9ac and (i) H3K122ac peaks with significant changes in AD vs. Old (P < 0.05, two-sided Wilcoxon rank-sum test) and their distance from the TSS (kb). (j-l) Boxplot showing (j) H3K27ac, (k) H3K9ac and (l) H3K122ac peak enrichment in Younger (N = 8–9), Old (N = 10) and AD (N = 9–11) (Supplementary Table 2), for peaks that belong to the six classes of changes identified in AD (Age-regulated gains or losses; Age-dysregulated gains or losses and Disease-specific gains or losses) (P < 0.05, 1-way ANOVA). The number of peaks in each class is reported below the boxplots. Disease-specific changes are the predominant class of changes for all three histone marks. Boxplots show minimum, first quartile, median (center line), third quartile and maximum.
Figure 4.
Figure 4.. H3K27ac and H3K9ac disease-specific gains are associated with epigenetic- and disease-related pathways in AD.
(a-c) Barplot showing top GO terms (Biological Processes; GREAT, FDR < 5% by both the binomial and the hypergeometric tests) for (a) H3K27ac disease-specific gains, (b) H3K9ac disease-specific gains and (c) H3K122ac disease-specific losses (n genes per term ≥ 20). The number of genes in each term is also reported. (d-f) UCSC ChIP-seq tracks showing examples of (d) H3K27ac disease-specific gains, (e) H3K9ac disease-specific gains and (f) H3K122ac disease-specific losses in AD. (g-i) Top DNA motifs (HOMER v4.6) for (g) H3K27ac disease-specific gains, (h) H3K9ac disease-specific gains, (i) H3K122ac disease-specific losses. Enrichment results are shown for known motifs (q < 0.05, Benjamini) (j) Heatmap showing the significance by INRICH (adjusted P values) of the association between AD-SNP regions and the six classes of H3K27ac, H3K9ac and H3K122ac changes. (k) Heatmap showing Bonferroni adjusted P values for sampling-based analysis for the overlap of each of the six classes of H3K27ac, H3K9ac and H3K122ac changes with temporal cortex (TX) eQTLs from Zou et al.. eQTLs were split into those from AD cases (TX_AD), non-AD but with other neuropathologies (TX_CTL), and combined conditions (TX_ALL).
Figure 5.
Figure 5.. Increased H3K27 and H3K9 acetylation enhances Aβ42 toxicity in Drosophila.
(a) Drosophila eye showing that histone mutants H3.3K9M (lysine (K) to methionine (M) mutation at residue 9), H3.3K27M (K to M mutation at residue 27) and H3.3K27Q (K to glutamine (Q) mutation at residue 27) independently enhance Aβ42 toxicity both in external (top) and internal eye tissue (bottom). Histone mutant H3.3K27A (K to alanine (A) mutation at residue 27) has no effect on Aβ42 toxicity. Expression of H3.3K27M and HK9M globally increase H3K27ac, while H3.3K27Q mimics acetylation, and H3.3K27A mimics absence of acetylation (Supplementary Table 14 for fly genotypes). (b) Barplot (with individual data points) represents mean ± SD of internal retinal depth in N = 4–6 individual animals per genotype (**** P < 0.0001, 1-way ANOVA (F (6, 28) = 83.24) with Tukey’s multiple comparisons test. Aß42+GFP vs: Aß42+H3.3WT (P = 0.9962); Aß42+H3.3K27A (P = 0.9987). Aß42+H3.3WT vs: Aß42+H3.3K9M (P = 2.3771 × 10⁻⁷); Aß42+H3.3K27M (P = 7.8390 × 10⁻⁷); Aß42+H3.3K27Q (P = 6.9131 × 10⁻⁵)). (c) Model of aberrant activation of chromatin and pro-disease pathways in AD. Increased H3K27ac and H3K9ac (by CBP/p300 and SAGA) drive activation of chromatin (left) and pro-disease pathways (right) in AD. Increased expression of transcription and chromatin genes (left), including CBP/p300 and TRAPP in the SAGA complex (left), may be upstream and reinforce activation of pro-disease pathways. H3K9ac at CREBBP (potentially by SAGA) leads to a positive feedback loop of sustained CBP expression and downstream histone acetylation in the AD epigenome. Environmental stressors may be upstream the activation of chromatin pathways.

References

    1. Van Cauwenberghe C, Van Broeckhoven C & Sleegers K The genetic landscape of Alzheimer disease: clinical implications and perspectives. Genet Med 18, 421–30 (2016). - PMC - PubMed
    1. Cummings J Lessons Learned from Alzheimer Disease: Clinical Trials with Negative Outcomes. Clin Transl Sci 11, 147–152 (2018). - PMC - PubMed
    1. Mehta D, Jackson R, Paul G, Shi J & Sabbagh M Why do trials for Alzheimer’s disease drugs keep failing? A discontinued drug perspective for 2010–2015. Expert Opin Investig Drugs 26, 735–739 (2017). - PMC - PubMed
    1. Sen P, Shah PP, Nativio R & Berger SL Epigenetic Mechanisms of Longevity and Aging. Cell 166, 822–839 (2016). - PMC - PubMed
    1. Benayoun BA, Pollina EA & Brunet A Epigenetic regulation of ageing: linking environmental inputs to genomic stability. Nat Rev Mol Cell Biol 16, 593–610 (2015). - PMC - PubMed

Publication types

MeSH terms