. 2020 Nov;21(11):1384-1396.
doi: 10.1038/s41590-020-0781-7. Epub 2020 Sep 28.

Strength of tonic T cell receptor signaling instructs T follicular helper cell-fate decisions

Affiliations

Strength of tonic T cell receptor signaling instructs T follicular helper cell-fate decisions

Juliet M Bartleson et al. Nat Immunol. 2020 Nov.

Abstract

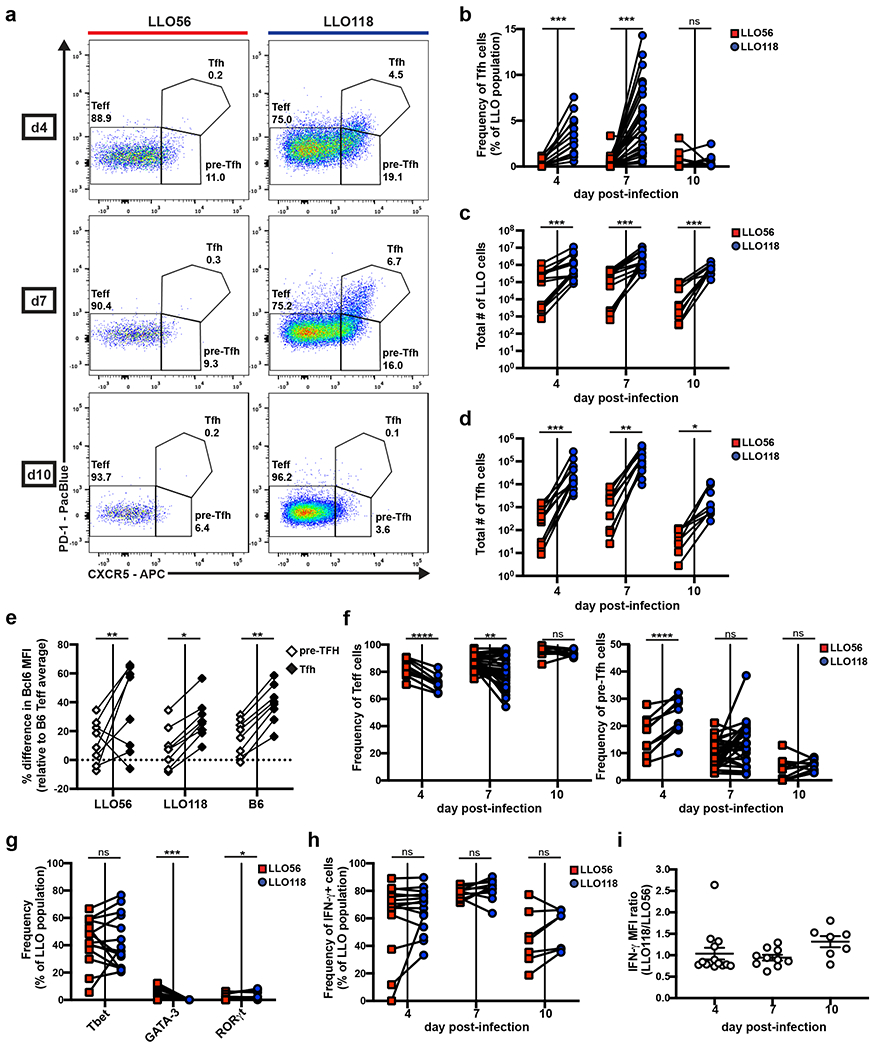
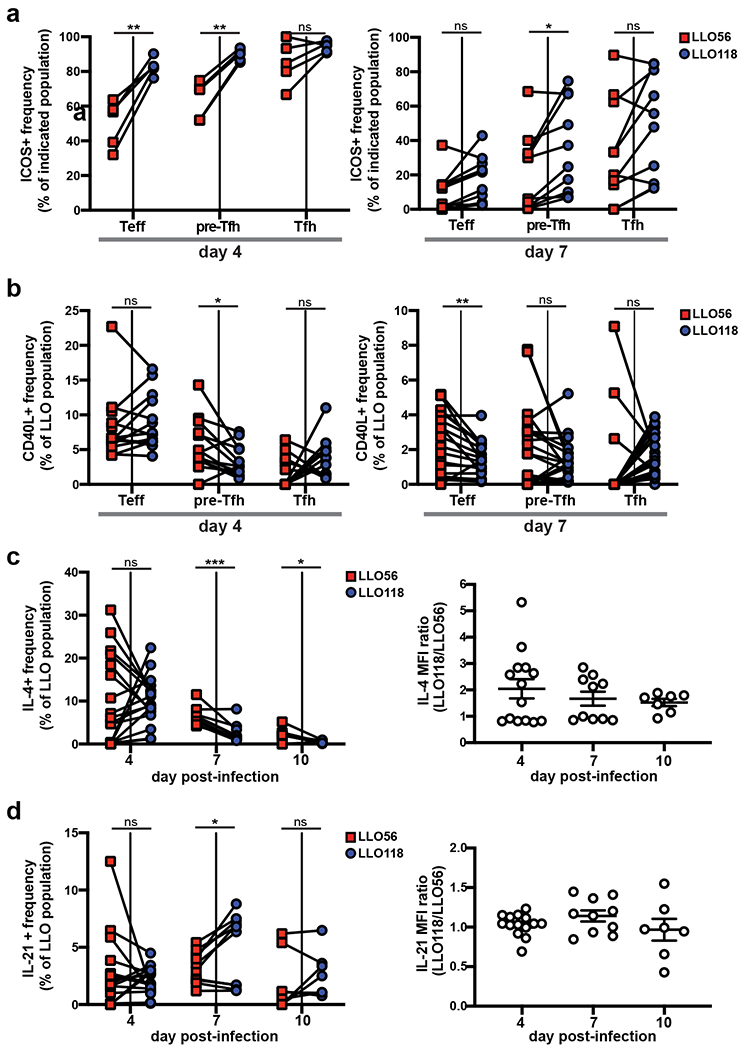
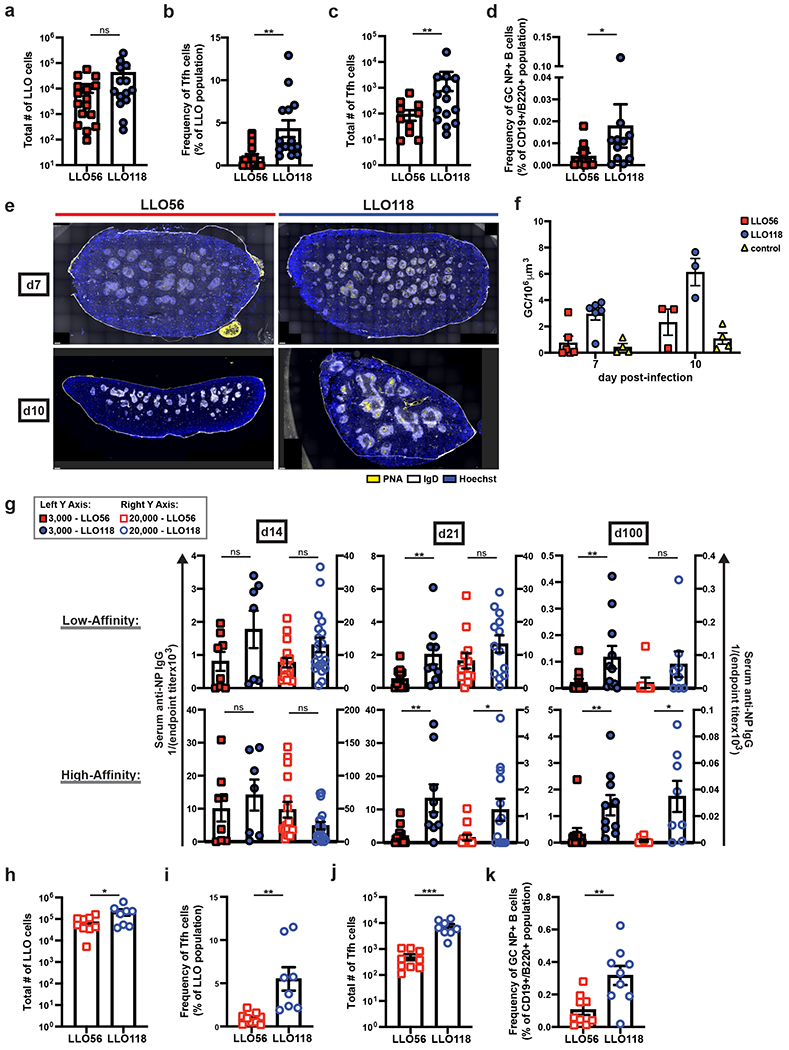
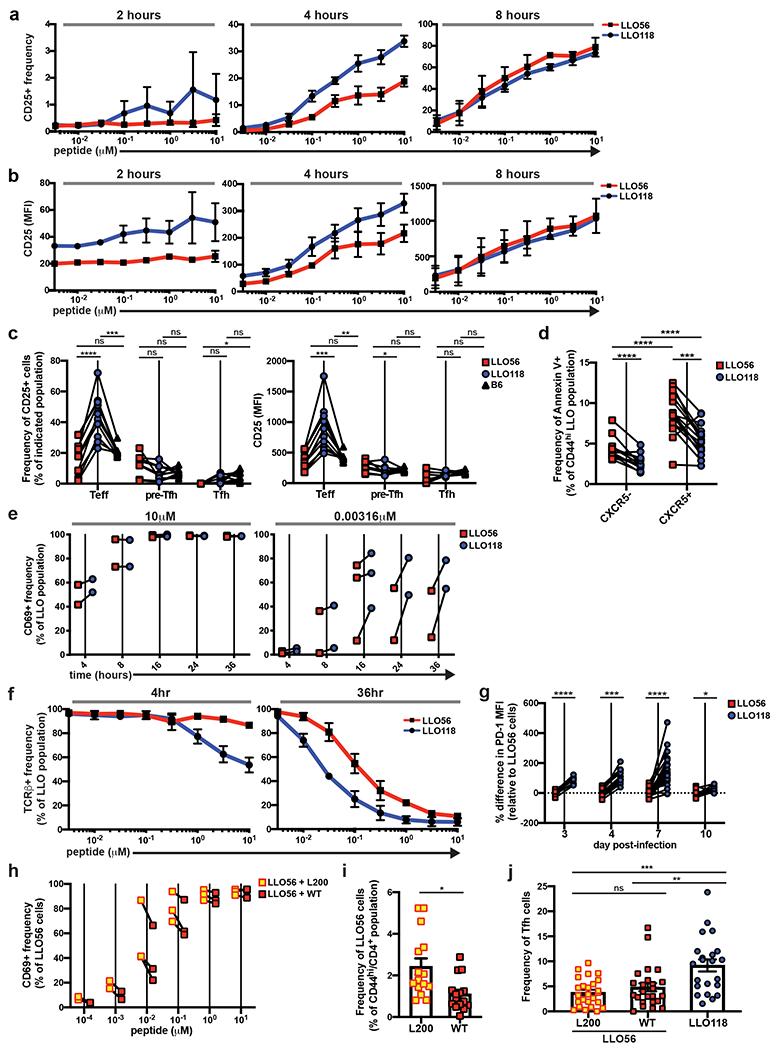
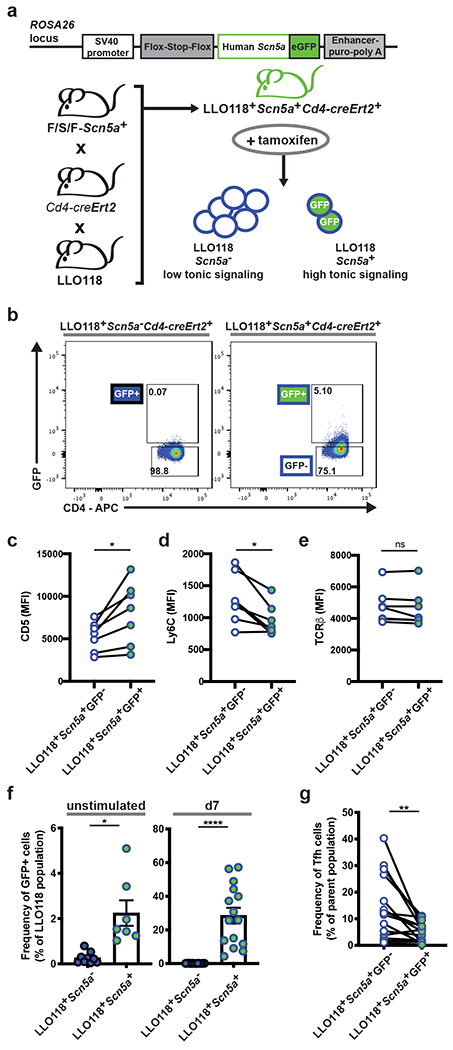
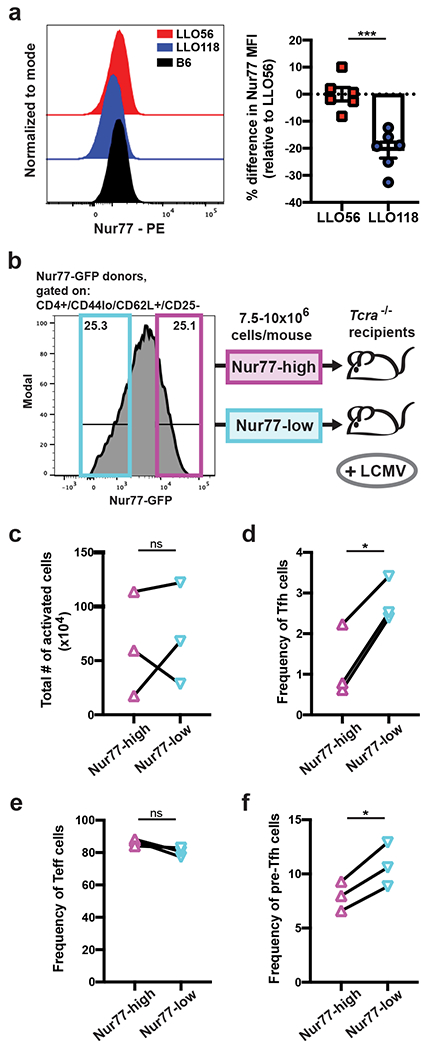
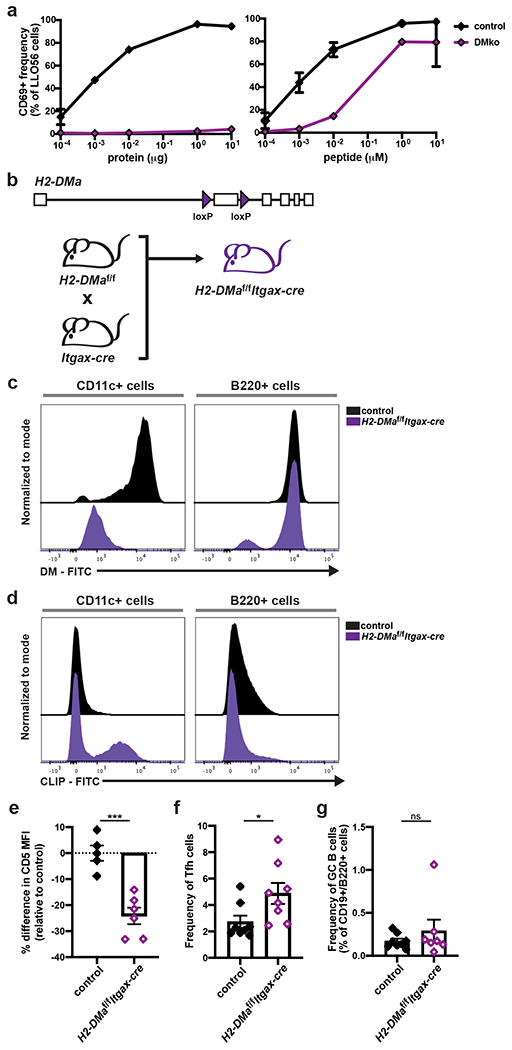
T follicular helper (TFH) cells are critical in adaptive immune responses to pathogens and vaccines; however, what drives the initiation of their developmental program remains unclear. Studies suggest that a T cell antigen receptor (TCR)-dependent mechanism may be responsible for the earliest TFH cell-fate decision, but a critical aspect of the TCR has been overlooked: tonic TCR signaling. We hypothesized that tonic signaling influences early TFH cell development. Here, two murine TCR-transgenic CD4+ T cells, LLO56 and LLO118, which recognize the same antigenic peptide presented on major histocompatibility complex molecules but experience disparate strengths of tonic signaling, revealed low tonic signaling promotes TFH cell differentiation. Polyclonal T cells paralleled these findings, with naive Nur77 expression distinguishing TFH cell potential. Two mouse lines were also generated to both increase and decrease tonic signaling strength, directly establishing an inverse relationship between tonic signaling strength and TFH cell development. Our findings elucidate a central role for tonic TCR signaling in early TFH cell-lineage decisions.


Conflict of interest statement

COMPETING INTERESTS

The authors declare no competing interests.

Figures

Figure 1.
Figure 1.. High and low tonic signaling cells (LLO56 and LLO118, respectively) generate equivalent Th1 immune responses, but differ in their ability to produce a Tfh population.
20,000-100,000 naive LLO56 and LLO118 cells were co-transferred into recipient B6 mice and then infected with actA-Lm the following day. Spleens were harvested on the indicated days post-infection for flow cytometry analysis of the activated LLO T cell populations (Supplemental Fig.1). Data collected from each individual recipient mouse are paired. a, Representative flow plots depicting Teff, pre-Tfh, and Tfh PD-1/CXCR5 gating strategies. Numbers shown are the frequency of each subset within the activated LLO parent population. b, Quantification of the frequency of Tfh cells. Three independent experiments for day 4 (n=13), eight for day 7 (n=31), and two for day 10 (n=10). c, Total numbers of activated LLO T cells. Three independent experiments for days 4 (n=13) and 7 (n=14), two for day 10 (n=10). d, Total numbers of LLO Tfh cells from the same experiments as in (c). e, Percentage difference in Bcl6 MFI of the paired pre-Tfh and Tfh subsets for each genotype relative to the average B6 Teff subset at day 7 post-infection. Data are from the same experiments as in (c) and exclude mice with no LLO56 Tfh generation. f, The frequency of Teff and pre-Tfh cells from the same experiments as in (b). g, LLO T cells were assessed for Tbet, GATA-3, and RORγt expression via intracellular staining at day 7 post-infection. Three independent experiments (n=14) are shown. h, Splenocytes were stimulated with PMA and ionomycin before intracellular cytokine staining was performed to assess frequency and i, MFI of IFN-γ expression in the activated LLO populations. Three independent experiments for days 4 (n=15) and 7 (n=14) and two for day 10 (n=7). MFI data shows the mean ± SEM. ****p < 0.0001, ***p < 0.001, **p < 0.01, *p < 0.05. Paired t test or Wilcoxon matched-pairs signed rank test for nonnormally distributed data (b-d, f-h). Two-way ANOVA using tukey’s multiple comparisons test for comparison of subsets across genotypes and Sidak’s multiple comparisons test for comparisons among subsets within each genotype (e). One-way ANOVA analysis (i).
Figure 2.
Figure 2.. LLO56 and LLO118 have distinct Tfh effector qualities.
100,000 naive CD4+ T cells of each LLO genotype were co-transferred into recipient B6 mice and infected with actA-Lm the following day. Spleens were harvested post-infection for flow cytometry. a, Frequencies of ICOS+ cells and b, CD40L+ cells in the Teff, pre-Tfh, and Tfh subsets of the LLO populations. Data points from individual recipient mice are paired. Three independent experiments for both days 4 (n=15) and 7 (n=14). c, On the indicated day post-infection, splenocytes were harvested and stimulated with PMA and ionomycin before intracellular cytokine staining was performed. The frequency of cytokine producing cells as well as cytokine MFI, given as a ratio of LLO118/LLO56 for each recipient mouse, are shown for IL-4 and d, IL-21. For both (c) and (d), three independent experiments were performed for day 4 (n=14) and two for days 7 (n=10) and 10 (n=7). MFI data show the mean ± SEM. ***p < 0.001, **p < 0.01, *p < 0.05. Two-way ANOVA or tukey’s multiple comparisons test (a). Paired t test or Wilcoxon matched-pairs signed rank test for nonnormally distributed data (b-d). One-way ANOVA analysis (MFI data for c, d).
Figure 3.
Figure 3.. Low tonic signaling cells (LLO118) support long-lived, high-affinity antibody production, while high tonic signaling cells (LLO56) do not.
3,000 LLO56 or LLO118 cells were transferred into recipient Tcra−/− mice and immunized one day later with NP-LLOLT-N. On day 7 post-immunization, splenocytes were analyzed by flow cytometry for a, total number of activated LLO T cells, b, Tfh cell frequency of the LLO T cell populations, c, total number of LLO Tfh cells, and d, frequency of GC, NP+-B cells (see Supplemental Fig. 3a for gating) Six independent experiments (n=16 for LLO56 and n=14 for LLO118). e, 3000 LLO56 or LLO118 cells were transferred and activated as in (a). Spleens were harvested post-immunization for immunohistochemistry analysis. GC staining: PNA (yellow), IgD (white), and Hoechst (blue). Representative images are shown for three independent experiments at day 7 (n=6 for LLO56 and LLO118, n=4 for controls) and two at d10 (n=3 for LLO56 and LLO118, n=4 for controls). Scale bars (bottom left corners) = 300μm. Controls are Tcra−/− mice that were immunized with NP-LLOLT-N but had received no prior T cell transfers (representative images in Supplemental Fig. 3b). f, For images obtained in (e), quantification of the number of GCs is shown. GCs were manually counted in a blinded manner and then normalized to spleen volume. Two sections per individual mouse were averaged. g, Tcra−/− mice receiving either 3,000 (data represented by the left Y axis) or 20,000 (data represented by the right Y axis) LLO56 or LLO118 cells were immunized with NP-LLOLT-N, and serum was collected on days 14, 21, and 100 post-immunization. Endpoint titers were determined with serum from Tcra−/− mice that had received LLO T cell transfers but were immunized with unconjugated protein, LLOLT-N. High- and low-affinity antibodies were determined by coating ELISA plates with NP(2)-BSA and NP(28)-BSA, respectively. For 3,000 cell transfers, data represent three independent experiments for all time-points [(d14: n=8 for LLO56, n=7 for LLO118), (d21: n=11 for LLO56, n=9 for LLO118), (d100: n=10 for both LLO genotypes)]. For 20,000 cell transfers, four independent experiments for day 14 (n=16 for LLO56, n=19 for LLO118), three for d21 (n=13 for both LLO genotypes), and two for day 100 (n=8 for both LLO genotypes). h, 20,000 LLO56 or LLO118 cells were transferred and activated as in (a). On day 7 post-immunization, splenocytes were analyzed by flow cytometry for the total number of activated LLO T cells, i, frequency of Tfh cells within the LLO populations, j, total number of LLO Tfh cells, and k, frequency of NP+ GC B cells. Three independent experiments (n=9). All data represent mean ± SEM. ***p < 0.001, **p < 0.01, *p < 0.05. Unpaired t test or Mann-Whitney test for nonnormally distributed data (a-d, g-k). One-way ANOVA (f).
Figure 4.
Figure 4.. LLO56 Tfh impairment is independent of IL-2 signaling and cannot be rescued by increasing TCR activation strength.
a, In vitro T cell stimulation assays with LLO T cells and LLOp to determine the frequency of CD25+ cells within the activated LLO T cell populations [live/single/dump(I-A/I-E)/CD4+/CD69+], as well as b, the MFI of CD25 at 2-8 hours post-activation. Assay was performed in duplicate; two independent experiments. c, 100,000 naive LLO T cells were co-transferred into recipient B6 mice and infected with actA-Lm the following day. Splenocytes were analyzed on day 4 post-infection for CD25+ frequencies and MFI in the Teff, pre-Tfh, and Tfh subsets of the activated LLO populations. Two independent experiments (n=10). d, Annexin V staining in the CXCR5 and CXCR5+ subsets of activated LLO T cells at day 4 post-infection. Three independent experiments (n=15). e, In vitro T cell stimulation assays with LLO T cells and LLOp. T cells were harvested 4-36 hours post-activation and analyzed for the frequency of CD69+ cells in the LLO populations (live/single/dump/CD4+). The highest (left graph, 10μM) and lowest (right graph, 0.00316 μM) peptide concentrations used for stimulation are shown. Data points are the duplicate averages and the paired LLO values are shown for each independent experiment (three for the 16 hour time-point and two for all others). f, In vitro LLO T cell stimulation assays with LLOp to assess TCRβ expression. Assay was performed in duplicate, and data are from two independent experiments. g, 20,000-100,000 naive LLO56 and LLO118 cells were co-transferred into recipient B6 mice and infected with actA-Lm the following day. Splenocytes were analyzed for expression of PD-1. Percentage differences in PD-1 MFI are shown relative to the average LLO56 PD-1 MFI for each time-point. Data are paired points from individual recipient mice; two independent experiments for day 3 (n=8), three for day 4 (n=13), 8 for day 7 (n=31), and two for day 10 (n=10). h, In vitro LLO56 T cell stimulation with either LLOp (referred to as WT) or LLOp with a point mutation of V➔L at residue 200 (referred to as L200). CD69+ frequency within the LLO56 population one day after stimulation. Assay was done in duplicate, and data points for LLO56 + WT and LLO56 + L200 are shown paired for each independent experiment: two for 10−3 and 10−4 μM concentrations, three for all other concentrations. i, j, 100,000-200,000 naive LLO56 were transferred into recipient B6 mice and then immunized with 10μM of either WT or L200 peptide. On day 7 post-immunization, splenocytes were analyzed for (i) frequency of activated LLO56 cells and (j) frequency of Tfh cells in the activated LLO56 cell population. LLO118 cells were also transferred into recipient B6 mice and immunized with WT peptide for Tfh analysis. In (i), only experiments with transfers of 100,000 cells are shown to keep expansion frequencies consistent (three independent experiments, n=15), and in (j) data are shown from all transfer amounts (six independent experiments, n=22 for LLO118 and n=25 for LLO56). All data represent mean ± SEM. ****p < 0.0001, ***p < 0.001, **p < 0.01, *p < 0.05. Unpaired t tests with correction for multiple comparisons using the Holm-Sidak method (a, b, e, f, h). Tukey’s multiple comparisons test (c). Paired t test or Wilcoxon matched-pairs signed rank test for nonnormally distributed data (d, g). Unpaired t test (i). Dunn’s multiple comparisons test (j).
Figure 5.
Figure 5.. Increasing basal TCR signaling in LLO118 cells inhibits Tfh development.
a, Outline of the Scn5a construct that was used to generate the F/S/F-Scn5a mouse, previously described, and the breeding scheme of the LLO118+Scn5a+Cd4-creErt2+ line. Upon tamoxifen treatment, ectopic Scn5a expression in peripheral CD4+ T cells can be detected by GFP expression. b, Representative flow plots depicting GFP detection in CD4+ T cells from LLO118+Scn5a+Cd4-creErt2+ mice 7 days post-tamoxifen treatment. Both the LLO118+Scn5a+Cd4-creErt2+ mouse and its littermate control were treated with tamoxifen. c-e, Flow cytometry analysis of CD5, Ly6C, and TCRβ MFI in LLO118 GFP+ and GFP T cells from LLO118+Scn5a+Cd4-creErt2+ mice 7 days post-tamoxifen treatment. Data points are the paired GFP+ and GFP populations from individually treated mice; three independent experiments (n=7). f, Analysis of LLO118+Scn5a+Cd4-creErt2+ GFP+ T cell expansion during a primary immune response. LLO118+Scn5a+Cd4-creErt2+ and LLO118+Scn5aCd4-creErt2+ mice were treated with tamoxifen and 7 days later CD4+ T cells were enriched and transferred into Tcra−/− recipients. The following day, recipients were immunized with NP-LLOLT-N. Graphs show the frequency of GFP+ cells in the LLO118 populations immediately prior to the transfer (unstimulated, left graph) and 7 days post-immunization (d7, right graph). Three independent experiments (n=7 for LLO118+Scn5a+Cd4-creErt2+ and n=9 for LLO118+Scn5aCd4-creErt2+). Mean ± SEM are shown. g, In the same experiments as (f), in vivo-activated LLO118+Scn5a+Cd4-creErt2+ cells were also analyzed at day 7 post-immunization for the frequency of Tfh cells within the GFP+ and GFP populations. ****p < 0.0001, **p < 0.01, *p < 0.05. Paired t test or Wilcoxon matched-pairs signed rank test for nonnormally distributed data (c-e, g). Unpaired t test or Mann-Whitney test for nonnormally distributed data (f).
Figure 6.
Figure 6.. Nur77 expression distinguishes Tfh outcome in the polyclonal repertoire.
a, Naive LLO and B6 T cells (live/single/CD4+/CD44lo/CD62L+/CD25) were assessed by intracellular staining for the expression of Nur77. Representative histograms are shown, and Nur77 MFI is quantified for the LLO populations by determining the percentage differences relative to the average LLO56 Nur77 MFI for each experiment. Two independent experiments (n=6). b, Depiction of the Nur77-sort experimental setup. Naive CD4+ T cells (gating in Supplemental Fig. 4) were sorted from Nur77-GFP donors into two populations: Nur77-high (top ~25% of GFP expression) and Nur77-low (lowest ~25% of GFP expression). 7.5-10x106 cells for each sorted population were transferred into individual Tcra−/− recipients, and one day later recipient mice were infected with LCMV-Armstrong. c, Following the experimental protocol in (b), recipient mice were harvested on day 7 post-infection, and splenocytes were analyzed for the total number of activated CD4+ T cells (live/single/CD4+/CD3+/GFP+/CD62Llo), d, the frequency of Tfh cells, e, frequency of Teff cells, and f, frequency of pre-Tfh cells within Nur77-high/low populations. Data points for (c-f) are the connected Nur77-high/low pairs from each independent experiment; three experiments total (n=3). All data represent mean ± SEM. ***p < 0.001, *p < 0.05. Unpaired t test (a). Paired t test (c-f).
Figure 7.
Figure 7.. Restricting the self-pMHC repertoire decreases tonic signaling and enhances Tfh development in polyclonal CD4+ T cells.
a, In vitro stimulation of LLO56 cells with either whole LLO protein or LLOp in the presence of BMDMs from control (B6) and DMko mice. LLO56 cells were harvested 18 hours post-activation and assessed for the frequency of CD69+ cells. Assays were performed in duplicate and representative graphs of three independent experiments are shown (n=3). b, Depiction of the generation of the H2-DMaf/fItgax-cre mouse line. c, Histograms depicting DM expression and d, CLIP bound to MHCII expression in the CD11c+ and B220+ cellular subsets of naive H2-DMaf/fItgax-cre mice and their littermate controls. Histograms are representative of two independent experiments (n=5 for the controls, n=6 for H2-DMaf/fItgax-cre). e, For the same mice analyzed in (c, d), CD5 expression in the naive CD4+ T cell population was also assessed, and the percentage differences in MFI are shown relative to the average control MFI for each experiment. f, H2-DMaf/fItgax-cre mice and their littermate controls were immunized directly with LLOp and splenocytes were assessed day 7 post-immunization for the frequency of Tfh cells in the activated, polyclonal CD4+ T cell populations. Two independent experiments (n=8). g, In the same experiments as (f), splenocytes were also analyzed for the frequency of GC B cells within the CD19+/B220+ population. All data represent mean ± SEM. *p < 0.05. Unpaired t test or Mann-Whitney test for nonnormally distributed data (e-g).

References

    1. Crotty S Follicular helper CD4 T cells (TFH). Annu Rev Immunol 29, 621–663 (2011). - PubMed
    1. Crotty S T Follicular Helper Cell Biology: A Decade of Discovery and Diseases. Immunity 50, 1132–1148 (2019). - PMC - PubMed
    1. Vinuesa CG, Linterman MA, Yu D & MacLennan IC Follicular Helper T Cells. Annu Rev Immunol 34, 335–368 (2016). - PubMed
    1. Webb LMC & Linterman MA Signals that drive T follicular helper cell formation. Immunology 152, 185–194 (2017). - PMC - PubMed
    1. Wu T et al. TCF1 Is Required for the T Follicular Helper Cell Response to Viral Infection. Cell Rep 12, 2099–2110 (2015). - PMC - PubMed

Publication types