. 2020 Nov;21(11):1456-1466.
doi: 10.1038/s41590-020-0784-4. Epub 2020 Sep 28.

Functional CRISPR dissection of gene networks controlling human regulatory T cell identity

Affiliations

Functional CRISPR dissection of gene networks controlling human regulatory T cell identity

Kathrin Schumann et al. Nat Immunol. 2020 Nov.

Abstract

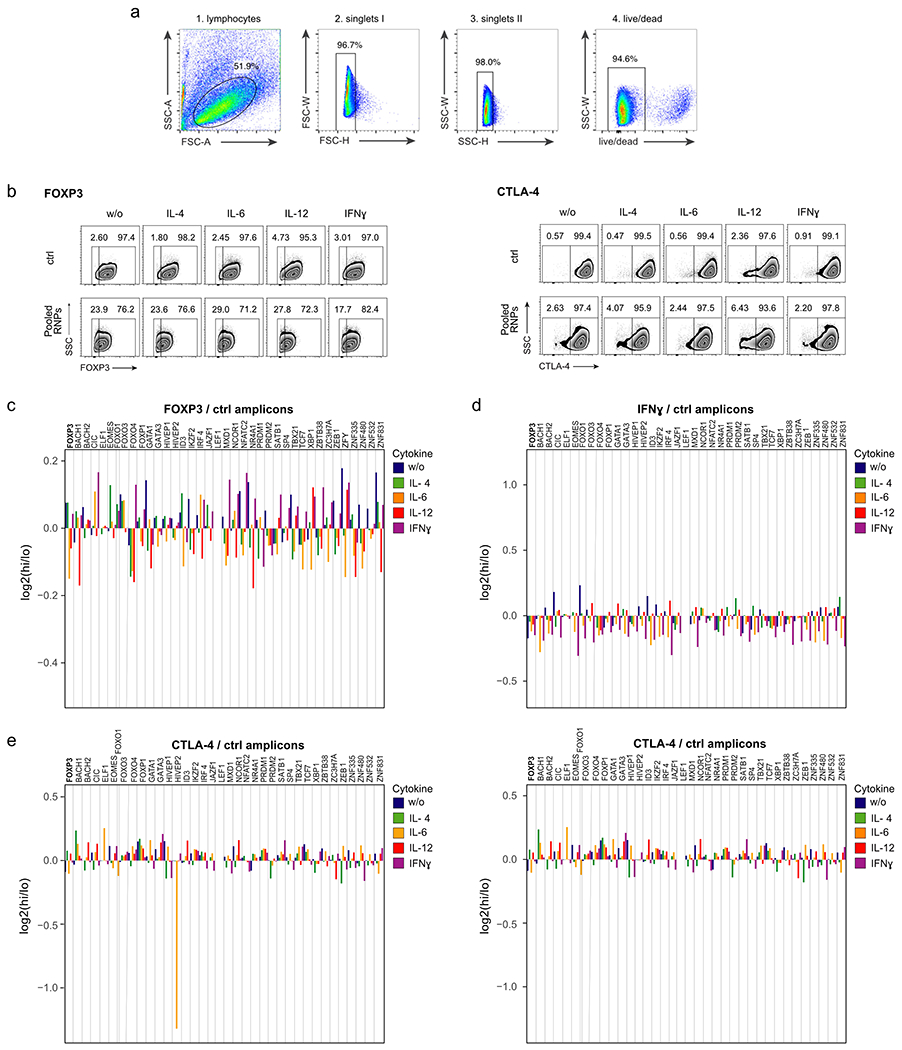
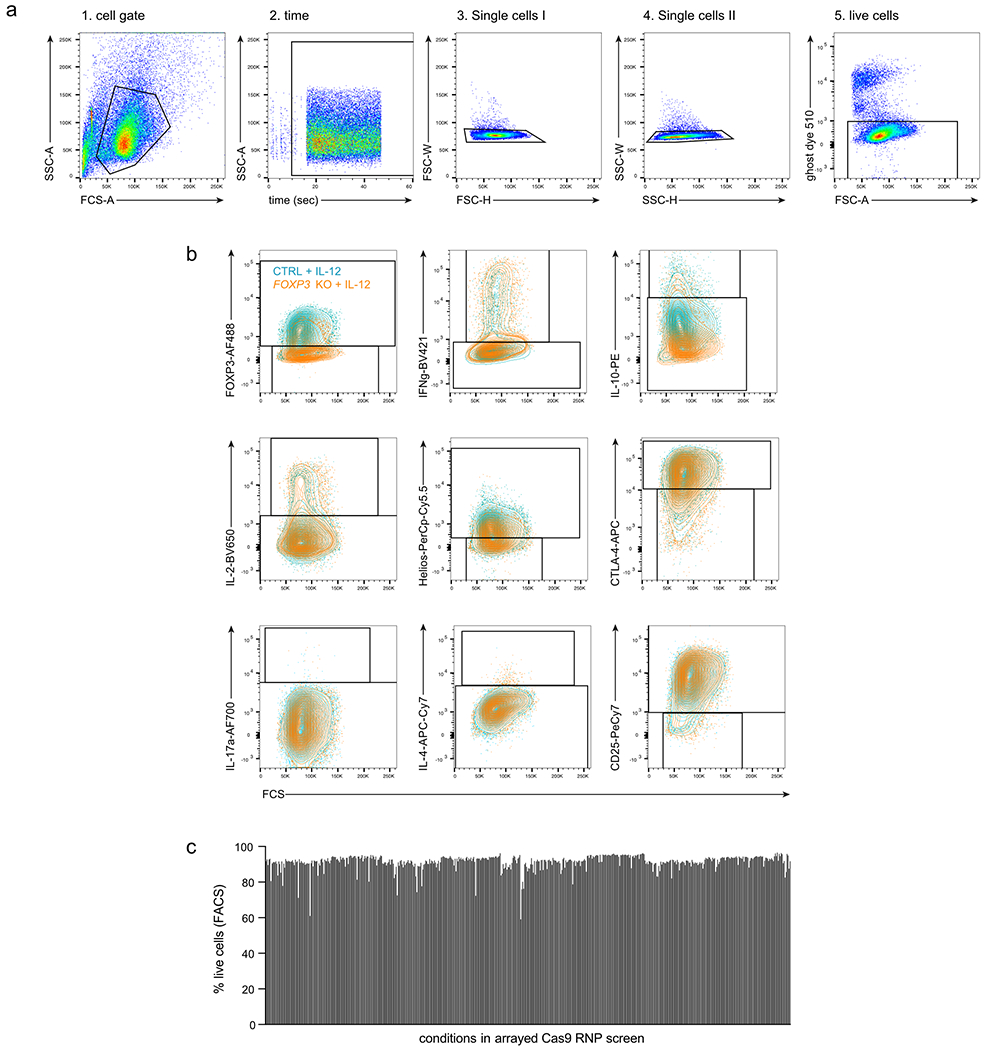
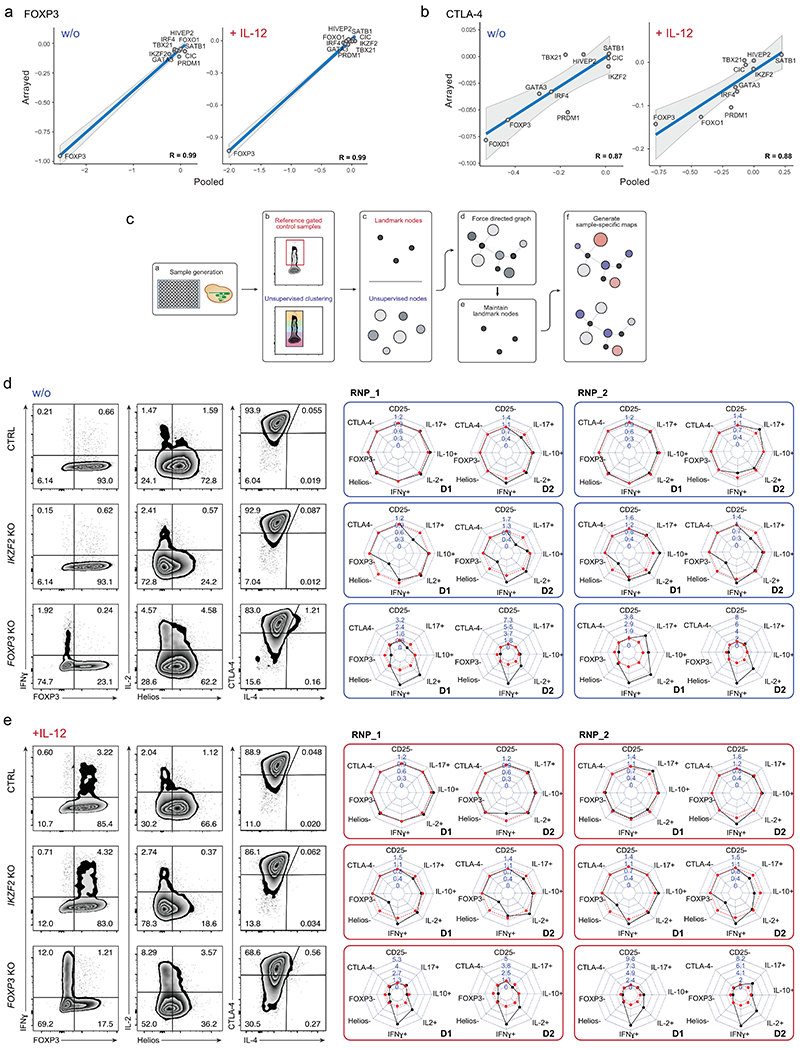
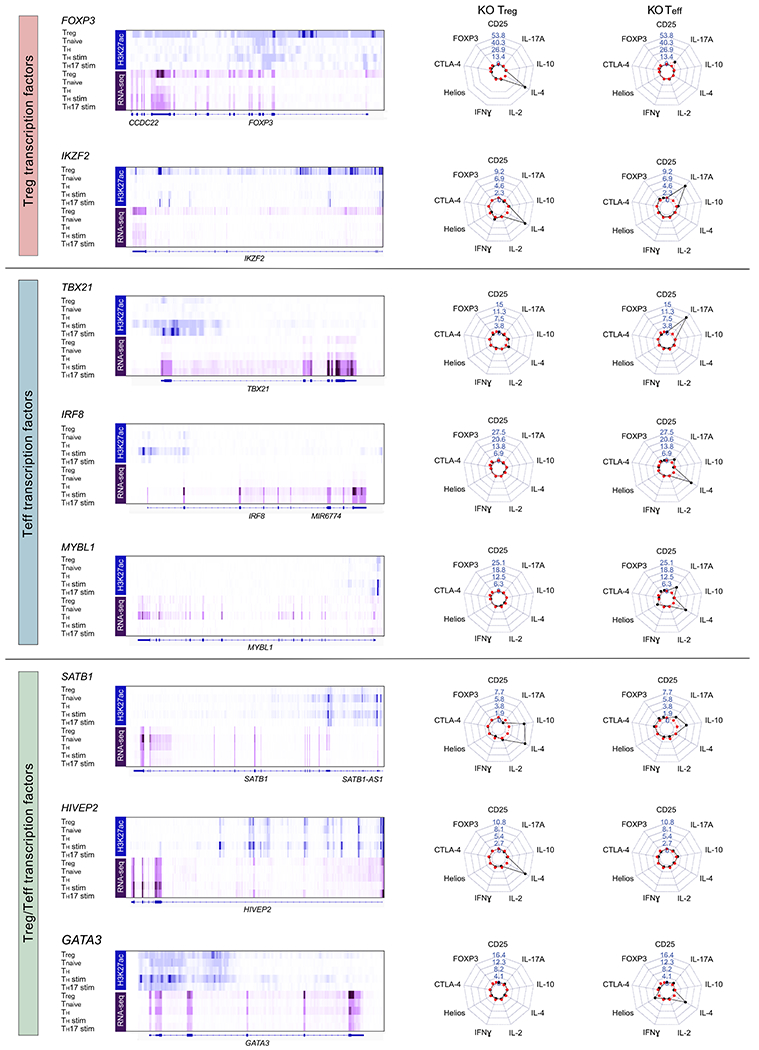
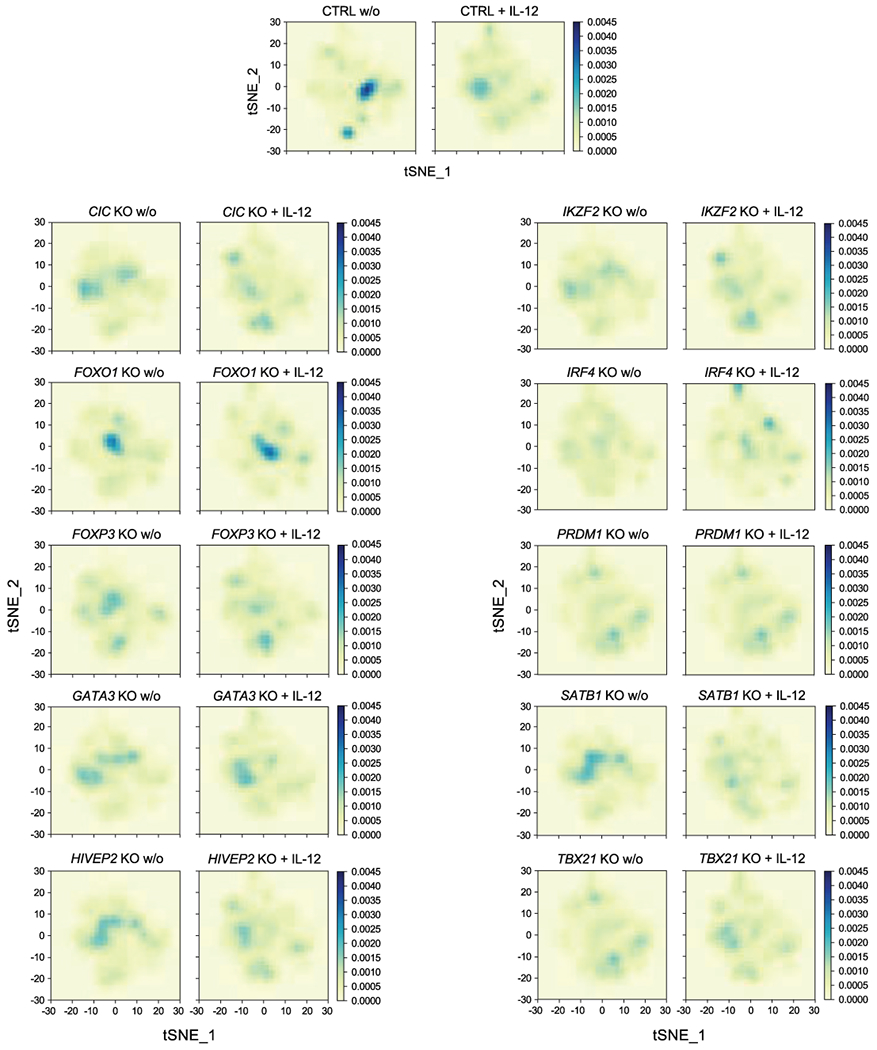
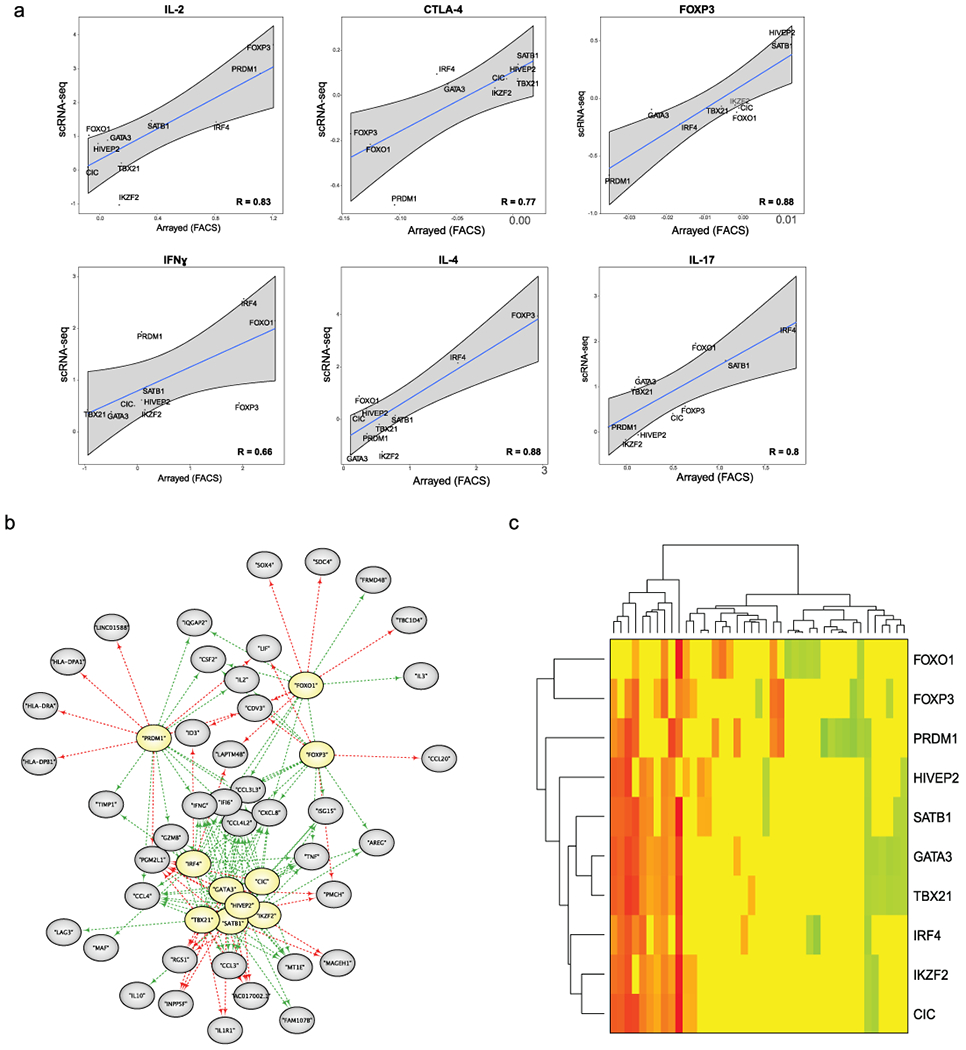
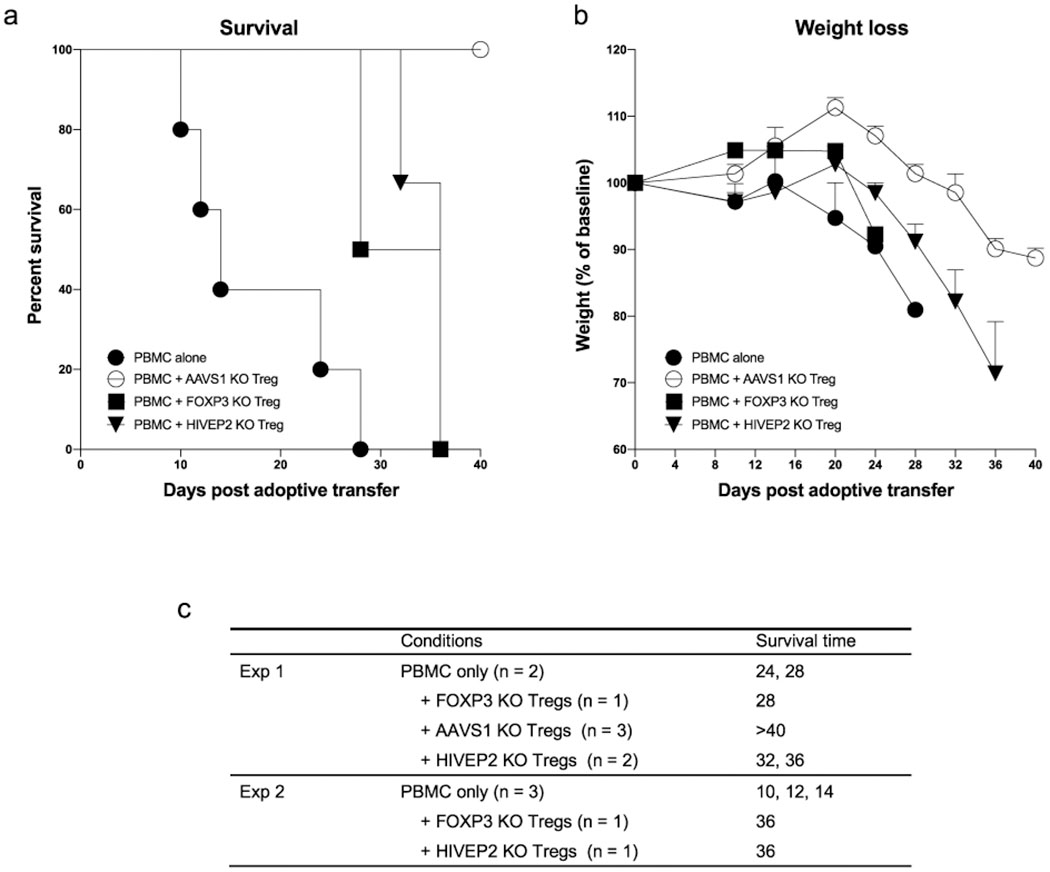
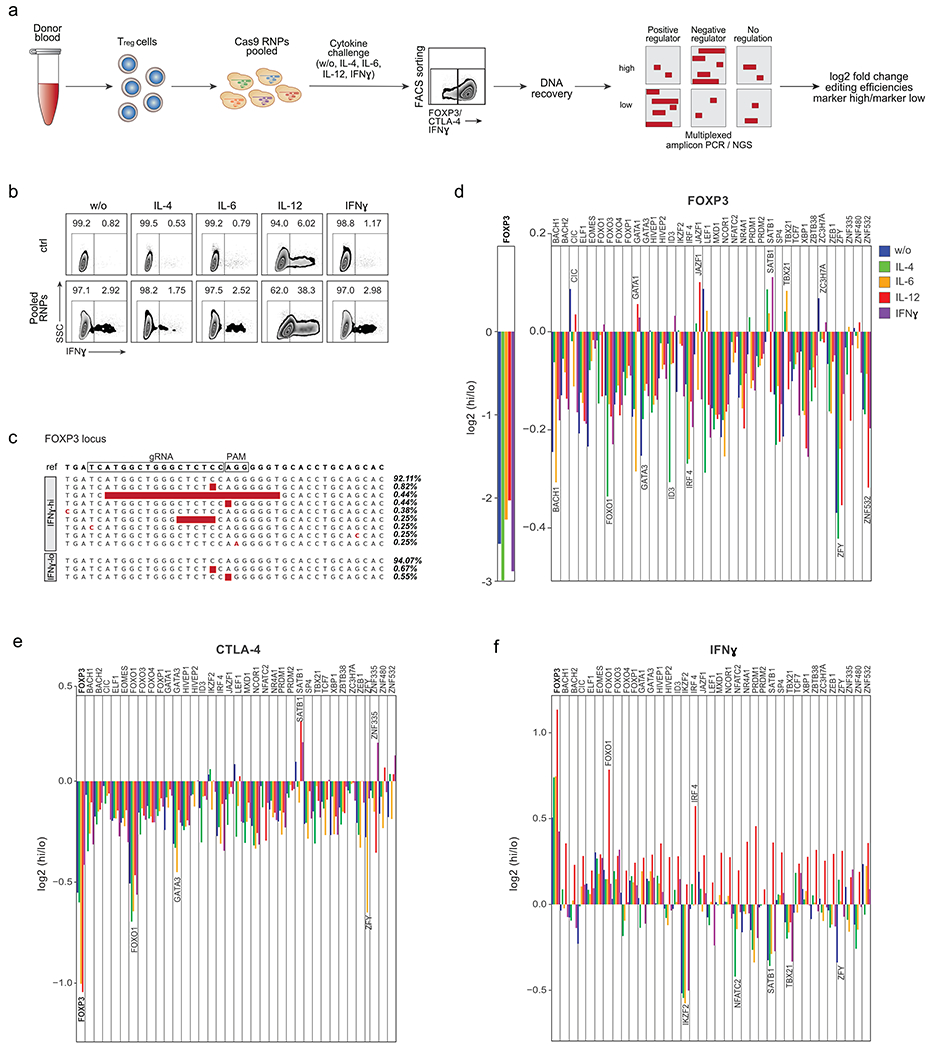
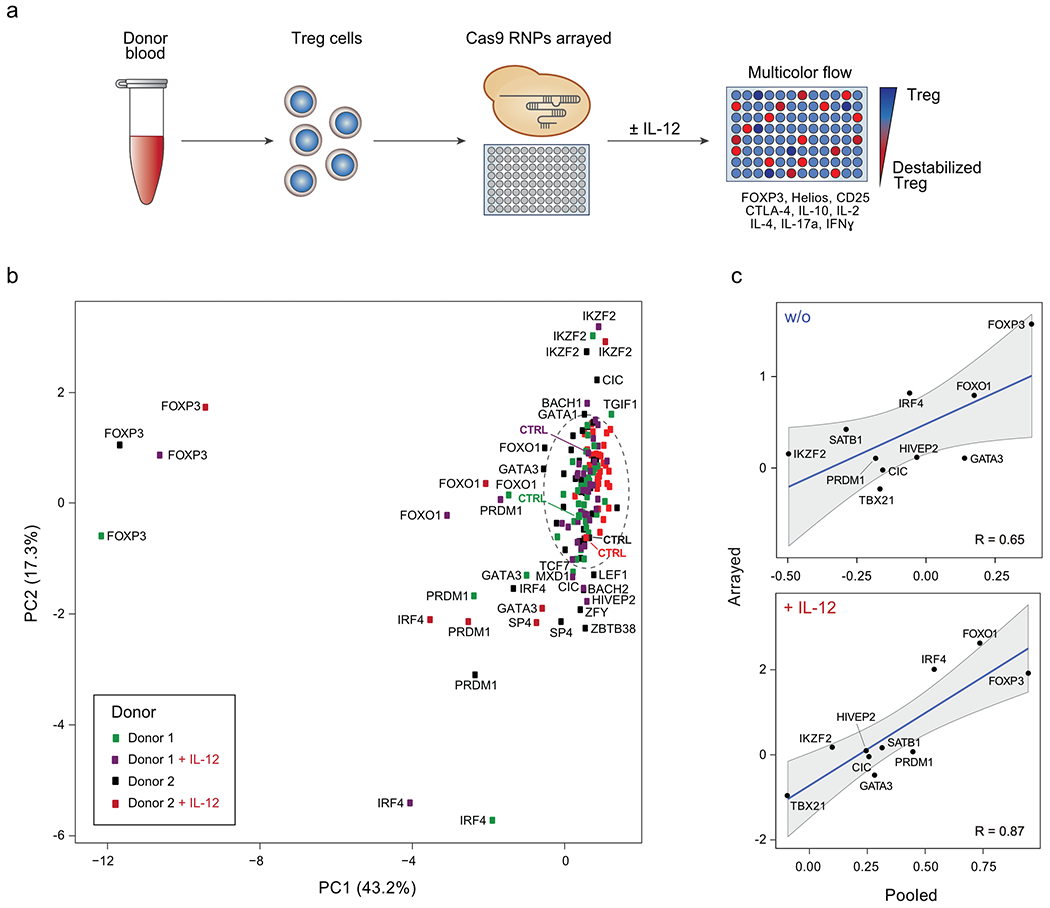
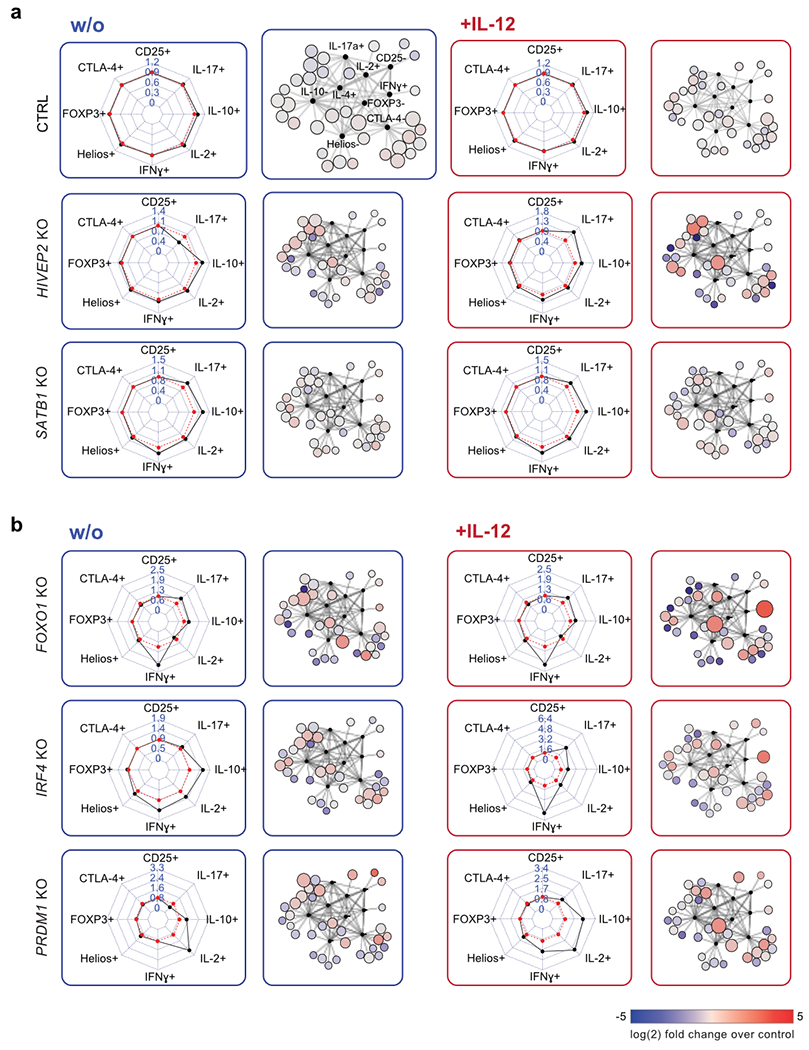
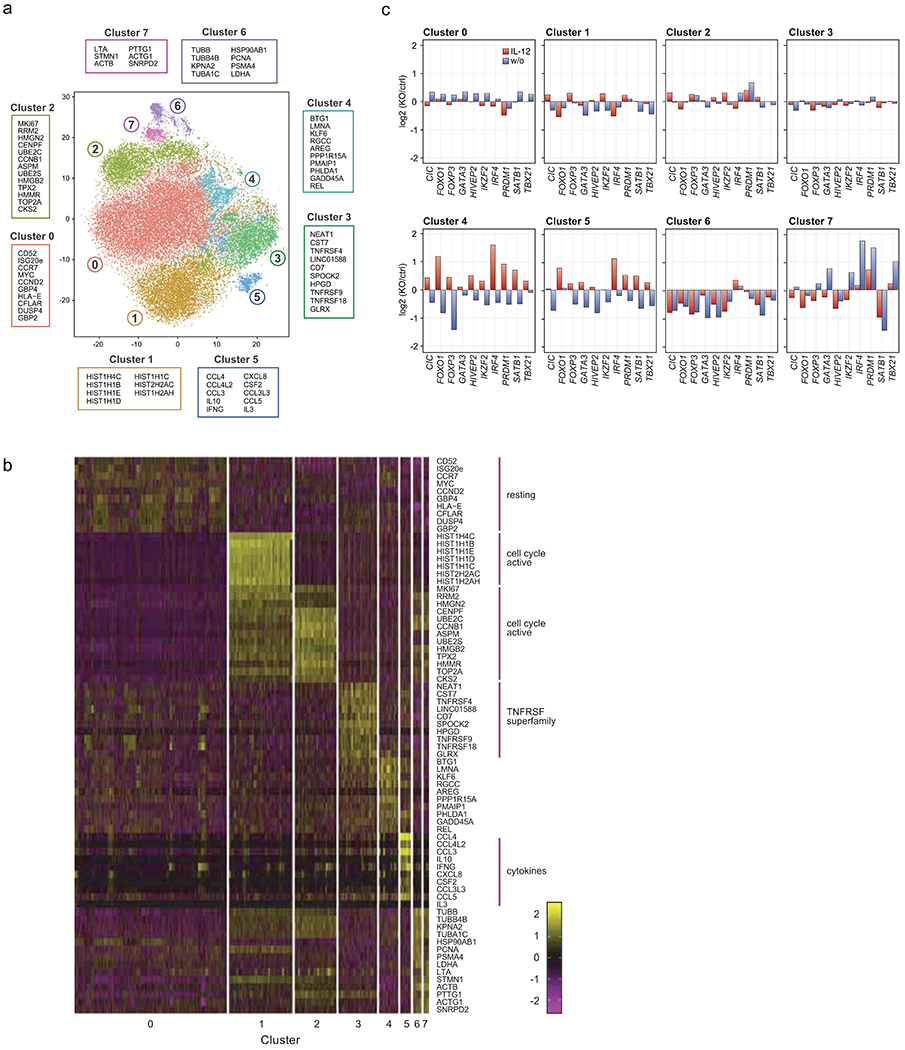
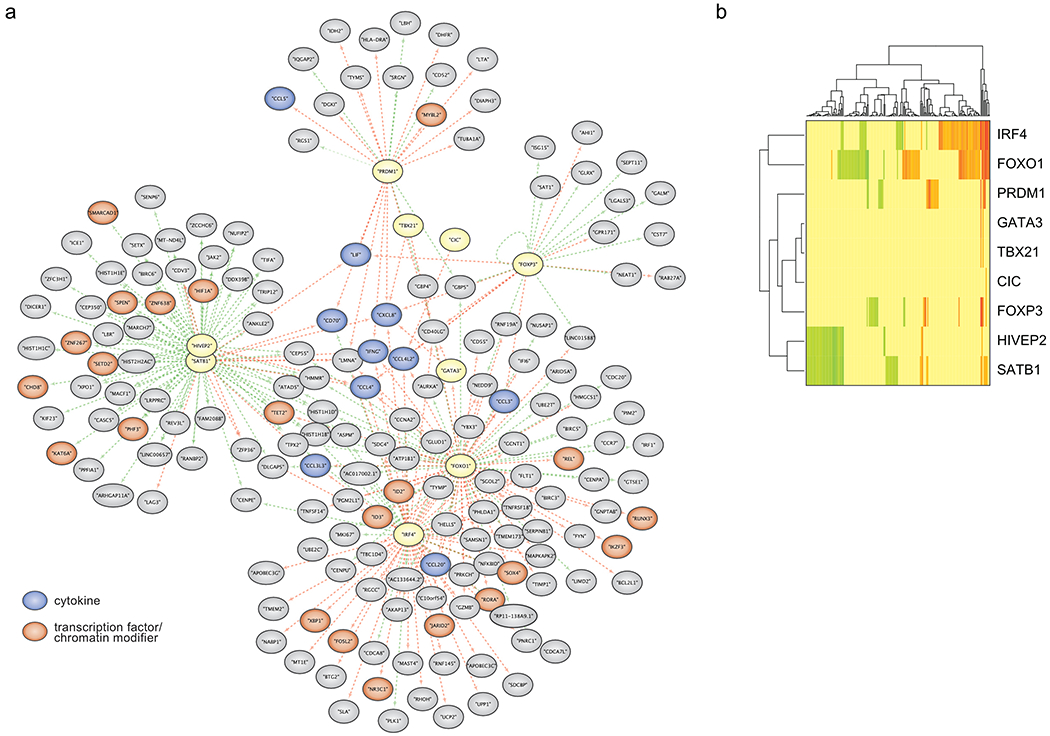
Human regulatory T (Treg) cells are essential for immune homeostasis. The transcription factor FOXP3 maintains Treg cell identity, yet the complete set of key transcription factors that control Treg cell gene expression remains unknown. Here, we used pooled and arrayed Cas9 ribonucleoprotein screens to identify transcription factors that regulate critical proteins in primary human Treg cells under basal and proinflammatory conditions. We then generated 54,424 single-cell transcriptomes from Treg cells subjected to genetic perturbations and cytokine stimulation, which revealed distinct gene networks individually regulated by FOXP3 and PRDM1, in addition to a network coregulated by FOXO1 and IRF4. We also discovered that HIVEP2, to our knowledge not previously implicated in Treg cell function, coregulates another gene network with SATB1 and is important for Treg cell-mediated immunosuppression. By integrating CRISPR screens and single-cell RNA-sequencing profiling, we have uncovered transcriptional regulators and downstream gene networks in human Treg cells that could be targeted for immunotherapies.


Figures

Extended Data Fig. 1
Extended Data Fig. 1. Limited effects of control site indel mutations on target protein levels in pooled RNP screens.
(a) FACS-gating strategy for pooled Cas9 RNP screens. Treg cells were gated on singlet live cells. Representative example from 1 of 4 human blood donors. (b) FACS sorting strategy to isolate FOXP3-high (hi) and FOXP3-low (lo) (left) and CTLA-4-hi and CTLA-4-lo Treg cells (right) electroporated with non-targeting control RNP (ctrl; top) and with a pool of RNPs targeting 40 individual TFs (bottom). Representative examples from experiments in one of 4 human blood donors. (c - e) log2 fold enrichment of indels in FOXP3-hi vs. FOXP3-lo (c), IFNg-hi vs. IFNg-lo (d) and CTLA-4-hi vs. CTLA-4-lo cell populations (e) at ctrl regions within 1 kb up- or downstream of the predicted gRNA cut site. Note: indel mutations in one control site near HIVEP2 were associated with altered CTLA-4 levels, which could be an artefact or could be due to effects on a regulatory element. Right graph (e) shows ctrl amplicons in the CTLA-4-hi and CTLA-4-lo sorted Treg cells without HIVEP2 KO control amplicon after IL-6 stimulation. (c – e): Mean of log2 fold enrichment of experiments performed in cells from 4 human blood donors with the exempt of the control amplicons for FOXO, ELF1 and ZFY (see Supplementary Table 1).
Extended Data Fig. 2
Extended Data Fig. 2. Flow cytometry gating strategy to define changes in Treg cell phenotype in arrayed Cas9 RNP screen.
(a) Initial gating strategy to identify live cells. (b) Gating strategy to assess Treg cell stability for personality and Scaffold plots. Control non-targeting Cas9 RNP-treated Treg cells (ctrl) after IL-12 conditioning are shown in light blue and FOXP3 KO Treg cells after IL-12 stimulation are shown in orange. a, b: Representative result for one non-targeting control Cas9 RNP in one out of two human blood donors. (c) % of live cells based on flow cytometry staining for all conditions tested in the arrayed Cas9 RNP screen.
Extended Data Fig. 3
Extended Data Fig. 3. Extended analysis of arrayed Cas9 RNP screen data.
Comparison of results generated in pooled (log2(#indels in “marker high” population/#indels in “marker low” population) versus arrayed Cas9 RNP screens (log2(% “marker high” in KO/% “marker high” in ctrl)) for FOXP3 (a) and CTLA-4 expression (b) with and w/o IL-12 stimulation for 10 selected TFs with notable effects on protein levels (see Methods and Supplementary Table 4) For the pooled screen, the calculated values are based on 4 human blood donors. For the arrayed screen, the calculated values are based mean fold-change values determined from 3 independent gRNAs and 2 human blood donors. The R value is based on these data points (highlighted in the graphs). Grey shading is provided by the loess algorithm in R, which uses polynomial regression to locally fit a surface to each point. (c) Schematic workflow of Scaffold generating landmark nodes and unsupervised clustering for visualization of TF KO cell subpopulations. (d, e) Phenotypic characterization of ctrl, IKZF2 and FOXP3 KO Treg cells with two-dimensional flow cytometry and personality plots w/o (d) and with IL-12 treatment (e) in Treg cells from two human blood donors (D1 and D2) with two of three different Cas9 RNPs targeting each gene (extended version of Fig. 3). Note: IL-4 was excluded from these plots due to low absolute levels that skewed fold-change analyses.
Extended Data Fig. 4
Extended Data Fig. 4. Phenotypic comparison of Treg and Teff TF KO cells.
We selected a subset of candidate Treg TFs. In addition, here we selected additional candidate TFs that are preferentially expressed in conventional CD4+ T cell subsets (referred to here as Teff cells) based on RNA-seq data (Roadmap Epigenomics Project). Corresponding H3K27ac and RNA-seq data (Treg, Tnaive, TH, TH stim and TH17 stim) are shown on the left for each tested TF. On the right: Representative personality plots of TF KO Treg cells and TF KO Teff cells after IL-12 stimulation of one of two donors tested. Note: Treg cells from this blood donor had distinct cytokine responses compared to those included in the larger arrayed TF KO screen experiments. IRF8 and MYBL1 were targeted with 3 independent gRNAs, while the other TFs were targeted with a previously validated gRNA (includes data of 2 human donors and 1 technical replicate for each condition). crRNA sequences and editing efficiencies are shown in Supplementary Table 3. Note: changes in IL-4 regulation helped to distinguish effects of TF KO in Treg versus Teff cells in these experiments and IL-4 is therefore included in these personality plots.
Extended Data Fig. 5
Extended Data Fig. 5. Distribution of cells states altered by TF ablation in Treg cells.
Cell density maps highlight the altered distribution cell states assessed by scRNA-seq (visualized with t-SNE dimensionality reduction, Fig. 5a) in individual TF KO Treg cell conditions with and w/o IL-12 treatment. The colour scale represents the population densities of particular cell states across regions of the t-SNE map. Data were generated in ex vivo expanded Treg cells from 2 human blood donors, the same data referenced in Fig. 5. Detailed list of all conditions: Supplementary Table 3.
Extended Data Fig. 6
Extended Data Fig. 6. Extended characterization of TF KO Treg cell scRNA-seq data.
(a) Comparison of results generated by flow cytometry for TF KO Treg cells in arrayed Cas9 RNP screens and scRNA-seq data after IL-12 treatment. Each of the 10 data points on the scatter plot represents arrayed Cas9 RNP screens (log2(% “marker high” in KO/% “marker high” in ctrl)) vs the scRNA-seq data (log2(mean expression KO/mean expression in ctrl)) for a given targeted TF. For the arrayed screen, the calculated values are based on 3 independent gRNAs and 2 human blood donors. For the scRNA-seq data, the calculated values are based on mean expression fold-change in a given KO and stimulation condition across 2 human blood donors. The R value is based on these data points (highlighted in the graphs). Grey shading is provided by the loess algorithm in R, which uses polynomial regression to locally fit a surface to each point. (b) Force-directed network graphs highlight gene modules in TF KO Treg cells without IL-12 treatment. Genes that depended (directly or indirectly) on each TF (yellow) are indicated by green arrows and genes repressed by each TF are marked with red arrows. (c) Heatmap summarizing the results of the network graph in a. Green indicates that TF KO represses expression of a gene, while red indicates that TF KO increases expression of a gene. Scale bar: log2(TF KO value of gene/ctrl value of gene). Data were generated in ex vivo expanded Treg cells from 2 human blood donors. Detailed list of all conditions: Supplementary Table 3.
Extended Data Fig. 7
Extended Data Fig. 7. Functional assessment of HIVEP2 KO Treg cells in a humanized mouse model of GVHD.
PBMC and Treg cells from 2 human blood donors were injected in a 2:1 ratio into NSG mice. Survival rate (a) and weight changes (b) were monitored over 40 days. PBMC alone (n = 5), PBMC + AAVS1 KO Treg cells (targeted a control safe harbour locus; n = 3), PBMC + FOXP3 KO Treg cells (n = 2), PBMC + HIVEP2 KO Treg cells (n = 3). The mice were all male age matched from three litters and randomized to different experimental groups. (c) Detailed information about the number of mice used and their survival time. Experiment 1 and 2 refers to the two different human blood donors. crRNA sequences and editing efficiencies are shown in Supplementary Table 3.
Figure 1.
Figure 1.. Pooled Cas9 RNP screens identify regulators of FOXP3, CTLA-4 and IFN-γ levels in Treg cells.
(a) Schematic workflow of pooled Cas9 RNP screens. Following cell sorting based on protein expression in varying cytokine conditions, DNA is recovered, target and control sites are amplified by multiplex PCR, and amplicons are subjected to deep sequencing. (b) FACS sorting strategy to isolate IFN-γ–high (hi) and IFN-γ-lo w (lo) Treg cells after electroporation with non-targeting control Cas9 RNP (ctrl; top) or with a pool of RNPs targeting 40 selected TFs. Ctrl and “Pool RNP” Treg cells were stimulated with IL-2 only (w/o) or IL-2 with IL-4, IL-6, IL-12 or IFN-γ. Representative example from one of 4 human blood donors (ZFY KO was assessed in only 3 human blood donors). (c) Selected examples of indels detected with multiplex PCR and deep sequencing at the targeted FOXP3 locus in FACS-sorted IFN-γ–hi and IFN-γ-lo cell populations. Read frequencies are shown on the right. (d) log2 fold enrichment of indels in FOXP3-hi vs. FOXP3-lo cell populations at the targeted FOXP3 locus (left) or at other targeted TF loci (right). (e) log2 fold enrichment of indels in CTLA-4-hi vs. CTLA-4-lo cell populations at target loci. (f) log2 fold enrichment of indels in IFN-γ–hi vs IFN-γ-lo cell populations at target loci. d-f: Mean of log2 fold enrichment in cells from 4 blood donors. Results of the ctrl regions: Extended Data Fig. 1c – e.
Figure 2.
Figure 2.. Arrayed flow cytometry characterization of TF KO Treg cells.
(a) Workflow of arrayed Cas9 RNP screens for TFs regulating Treg cell identity. The flow cytometry panel of assessed Treg and Teff cell proteins is shown. (b) Principal Component Analysis (PCA) summarizing flow cytometry results of 40 TF KOs Treg cells and non-targeting controls without and with IL-12 (results from 2 human blood donors). In the circle: Controls and KO conditions with minimal dysregulation of assessed proteins based on PCA. The mean of 3 independent gRNAs targeting each TF was used as the input for each condition. (c) Comparison of IFN-γ results generated in pooled (log2(#indels in IFN-γ-high population/#indels in IFN-γ-low population) versus arrayed Cas9 RNP screens (log2(% IFN-γ-high in KO/% IFN-γ-high in ctrl)) with and w/o IL-12 for 10 selected TFs with notable effects on protein levels (see Methods and Supplementary Table 4). For the pooled screen, the calculated values are based on the mean frequency fold-change values from 4 human blood donors. For the arrayed screen, the calculated values are based on the mean fold-change values derived from 3 independent gRNAs and 2 blood donors. Correlation coefficients (R values) are based on these data points and shown in each graph. Shading is provided by the loess algorithm in R, which uses polynomial regression to locally fit a surface to each point.
Figure 3.
Figure 3.. Deep phenotypic analysis of altered protein expression resulting from individual TF ablations.
(a) Left: Representative flow cytometry analysis of IKZF2 KO and FOXP3 KO Treg cells compared to control non-targeting RNP-treated Treg cells (ctrl) without IL-12 stimulation. Middle: Personality plots summarizing flow cytometry results for 8 markers (IL-4 was excluded from these plots due to low absolute levels that skewed fold-change analyses). Each dimension on the personality plots—representing one flow cytometry marker—indicates the ratio of the percent “marker-high” cells in TF KO population relative to the percent “marker-high” in non-targeting RNP treated Treg cells. Red lines indicate average marker positive cells in ctrl cells electroporated with non-targeting RNP (6 ctrls; 3 different non-targeting RNPs, one replicate each). For each TF KO, black lines indicate the ratio of percent positive expression of a given marker relative to the average of the associated ctrls. Right: Corresponding Scaffold plots for 9-dimensional visualization of flow cytometry data. Landmark nodes (black) are labelled based on reference gates in ctrl samples. Size of cluster nodes indicates number of cells in the cluster. Colour scale: increase (red) or decrease (blue) in relative population frequency of given cluster. Representative results from one of two blood donors and one of three independent gRNAs. (b) Flow cytometry results and personality plots for ctrl, IKZF2 KO and FOXP3 KO Treg cells with IL-12 treatment (same Cas9 RNPs and same donor as in a). Representative result from one of two blood donors and one of three independent gRNAs.
Figure 4.
Figure 4.. Multidimensional characterization of selected hits from arrayed Cas9 RNP screen.
(a) Representative personality plots and Scaffold analysis of SATB1 KO and HIVEP2 KO Treg cells compared to control non-targeting RNP treated Treg cells (ctrl) without (blue) and with IL-12 stimulation (red) (IL-4 was excluded from these plots due to low absolute levels that skewed fold-change analyses). Ctrl Treg cells are the same as shown in Fig. 3a. (b) Representative personality and Scaffold plots for FOXO1, IRF4 and PRDM1 KO Treg cells. Dysregulated cytokine production after IL-12 production is highlighted in the respective Scaffold plots. Representative results from one out of two blood donor and one of three independent gRNAs.
Figure 5.
Figure 5.. Distinct phenotypic landscapes in scRNA-seq of TF KO human Treg cells.
(a) t-SNE plot summarizing all cell states assessed by analysis of 10 TF KO and control Treg cells electroporated with non-targeting Cas9 RNP with and without IL-12 stimulation. 8 cell phenotype clusters (Clusters 0-7) were identified based on DE gene expression analysis of the scRNA-seq data. The 10 genes with the highest fold-change in expression levels in each individual cluster compared to all clusters are indicated. (b) Heatmap showing the individual cellular expression levels of the top 10 genes differentially expressed in each cluster versus other clusters in Fig. 5a). (c) Phenotypic distribution of cells in each cluster resulting from each TF KO w/o (blue) and with IL-12 stimulation (red) (normalized to ctrl cells in the corresponding cytokine condition). Data were generated with ex vivo expanded Treg cells from 2 human blood donors. Detailed list of all conditions: Supplementary Table 3.
Figure 6:
Figure 6:. Functional dissection of gene networks downstream of key TFs in human Treg cells using scRNA-seq data.
(a) Force-directed graph of gene modules regulated by Treg TFs (yellow) after IL-12 stimulation. Genes with reduced expression in response to a given TF KO are indicated by adjoining green arrows, and genes with increased expression in response to a given TF KO are marked with adjoining red arrows. TF target genes encoding cytokines and chemokines are shown in blue and target genes encoding TFs and chromatin modifiers are shown in orange. (b) Heatmap summarizing the results of the network graph shown in Fig 6a. Scale bar: log2(mean expression of TF KO population/mean expression of ctrl cells of the corresponding cytokine condition). Green indicates that TF KO represses expression of a gene, while red indicates that TF KO increases expression of a gene. Data were generated in ex vivo expanded Treg cells from two human blood donors, the same as presented in Fig 5. Detailed list of all conditions: Supplementary Table 3.

References

    1. Schmidt A, Oberle N & Krammer PH Molecular mechanisms of treg-mediated T cell suppression. Front Immunol 3, 51 (2012). - PMC - PubMed
    1. Long SA & Buckner JH CD4+FOXP3+ T regulatory cells in human autoimmunity: more than a numbers game. J Immunol 187, 2061–2066 (2011). - PMC - PubMed
    1. Ferreira LMR, Muller YD, Bluestone JA & Tang Q Next-generation regulatory T cell therapy. Nat Rev Drug Discov 18, 749–769 (2019). - PMC - PubMed
    1. Overacre-Delgoffe AE et al. Interferon-gamma Drives Treg Fragility to Promote Anti-tumor Immunity. Cell 169, 1130–1141 e1111 (2017). - PMC - PubMed
    1. Wang D et al. Targeting EZH2 Reprograms Intratumoral Regulatory T Cells to Enhance Cancer Immunity. Cell Rep 23, 3262–3274 (2018). - PMC - PubMed

References - Online Methods:

    1. Kang HM et al. Multiplexed droplet single-cell RNA-sequencing using natural genetic variation. Nat Biotechnol 36, 89–94 (2018). - PMC - PubMed
    1. Brinkman EK, Chen T, Amendola M & van Steensel B Easy quantitative assessment of genome editing by sequence trace decomposition. Nucleic Acids Res 42, e168 (2014). - PMC - PubMed
    1. Samusik N, Good Z, Spitzer MH, Davis KL & Nolan GP Automated mapping of phenotype space with single-cell data. Nat Methods 13, 493–496 (2016). - PMC - PubMed

Publication types

MeSH terms