. 2020 Nov;21(11):1371-1383.
doi: 10.1038/s41590-020-0785-3. Epub 2020 Sep 28.

Interleukin-33 activates regulatory T cells to suppress innate γδ T cell responses in the lung

Affiliations

Interleukin-33 activates regulatory T cells to suppress innate γδ T cell responses in the lung

Lucas D Faustino et al. Nat Immunol. 2020 Nov.

Abstract

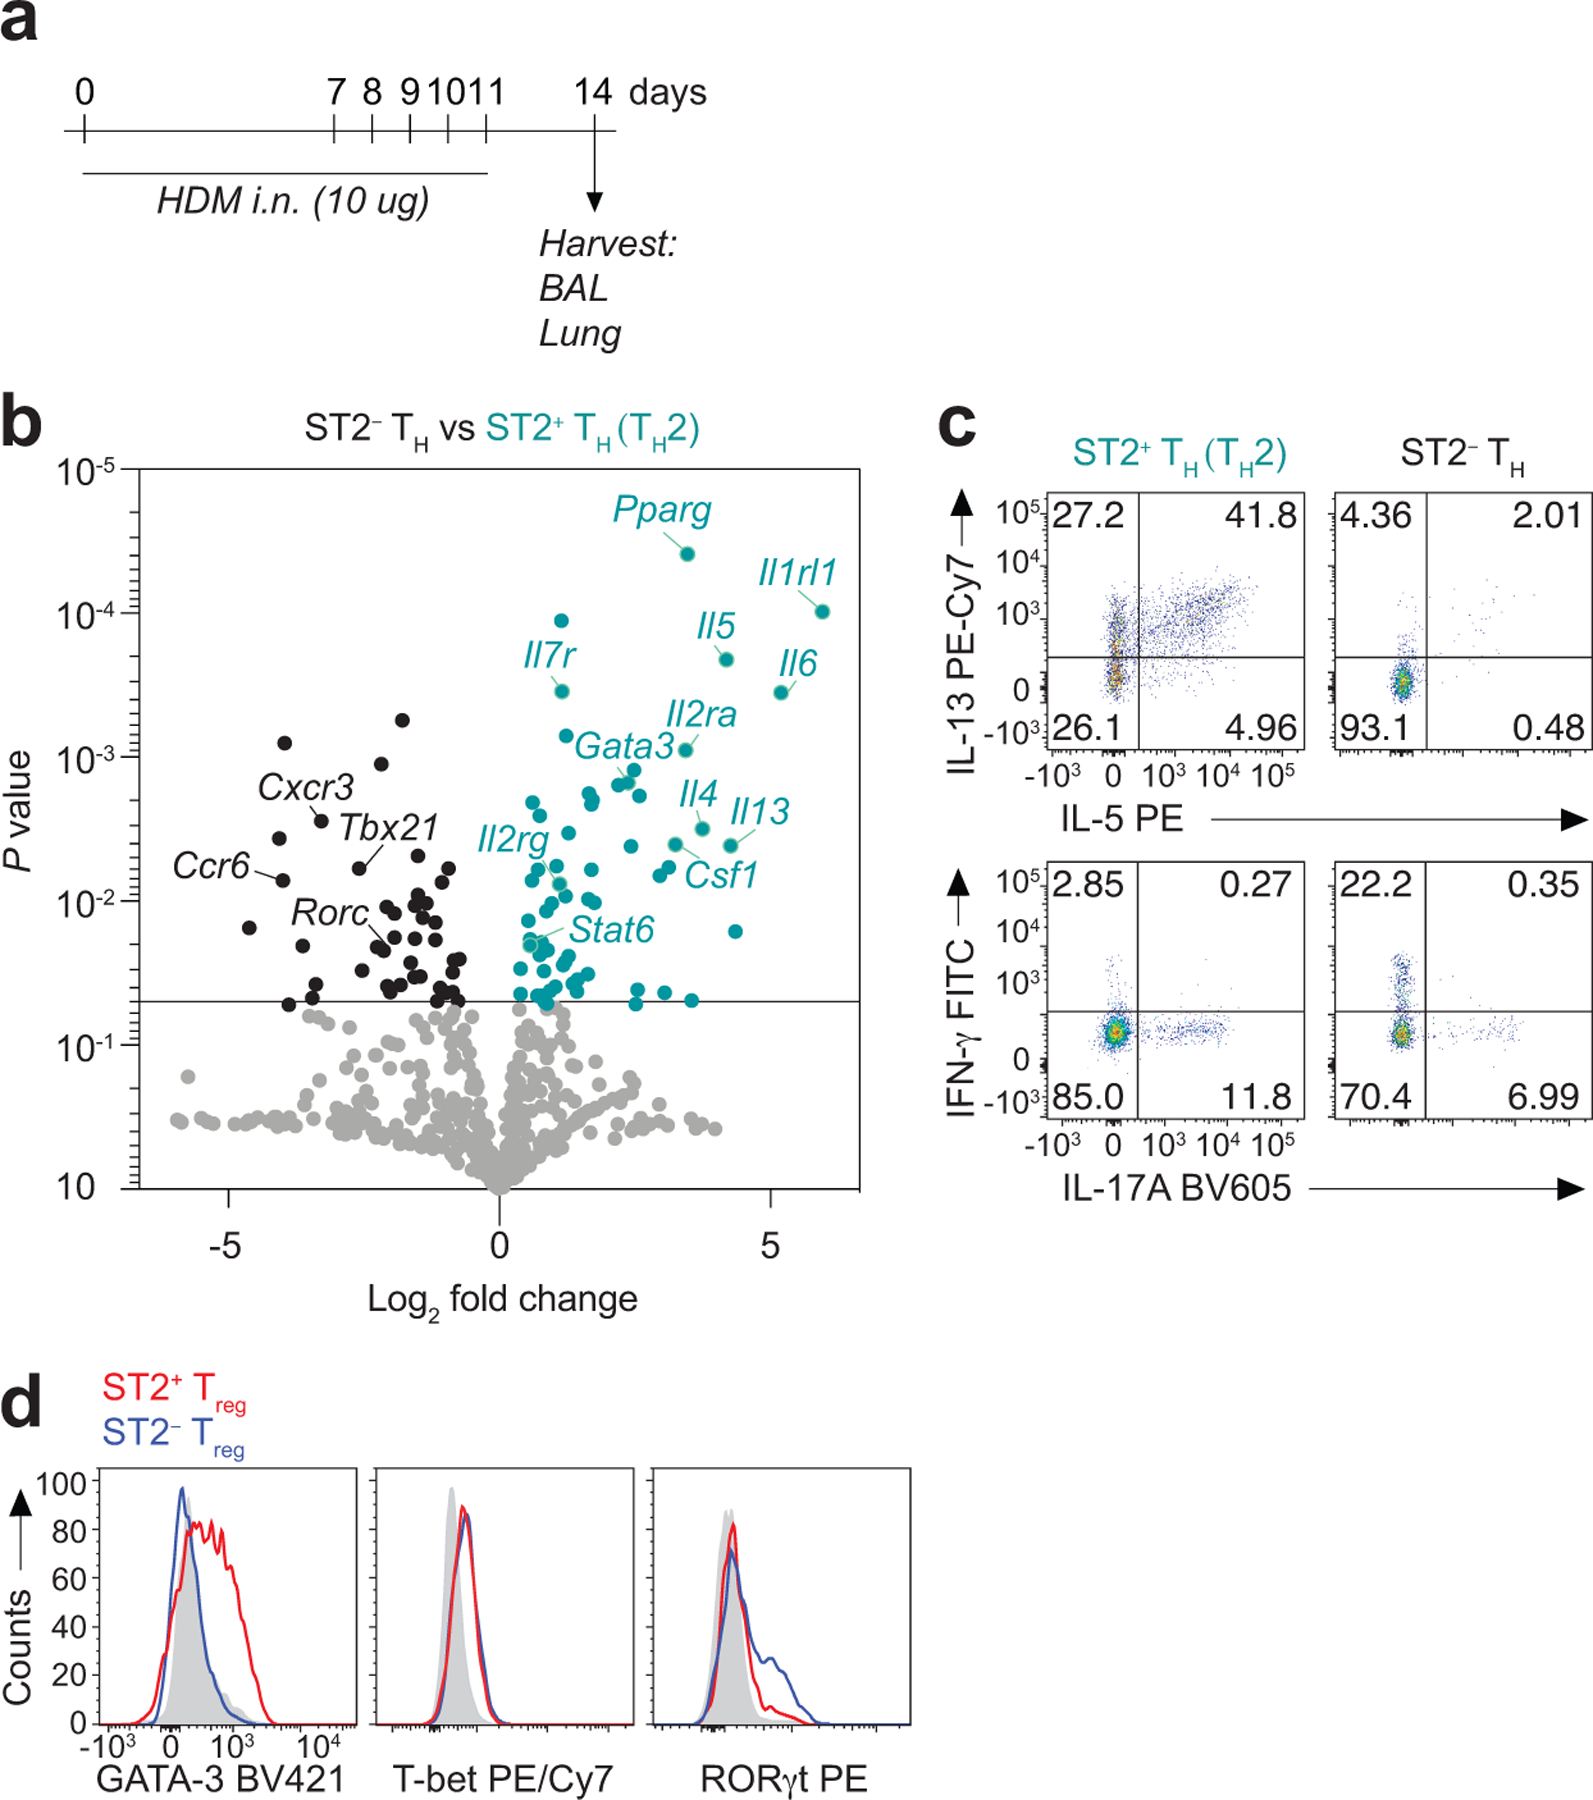
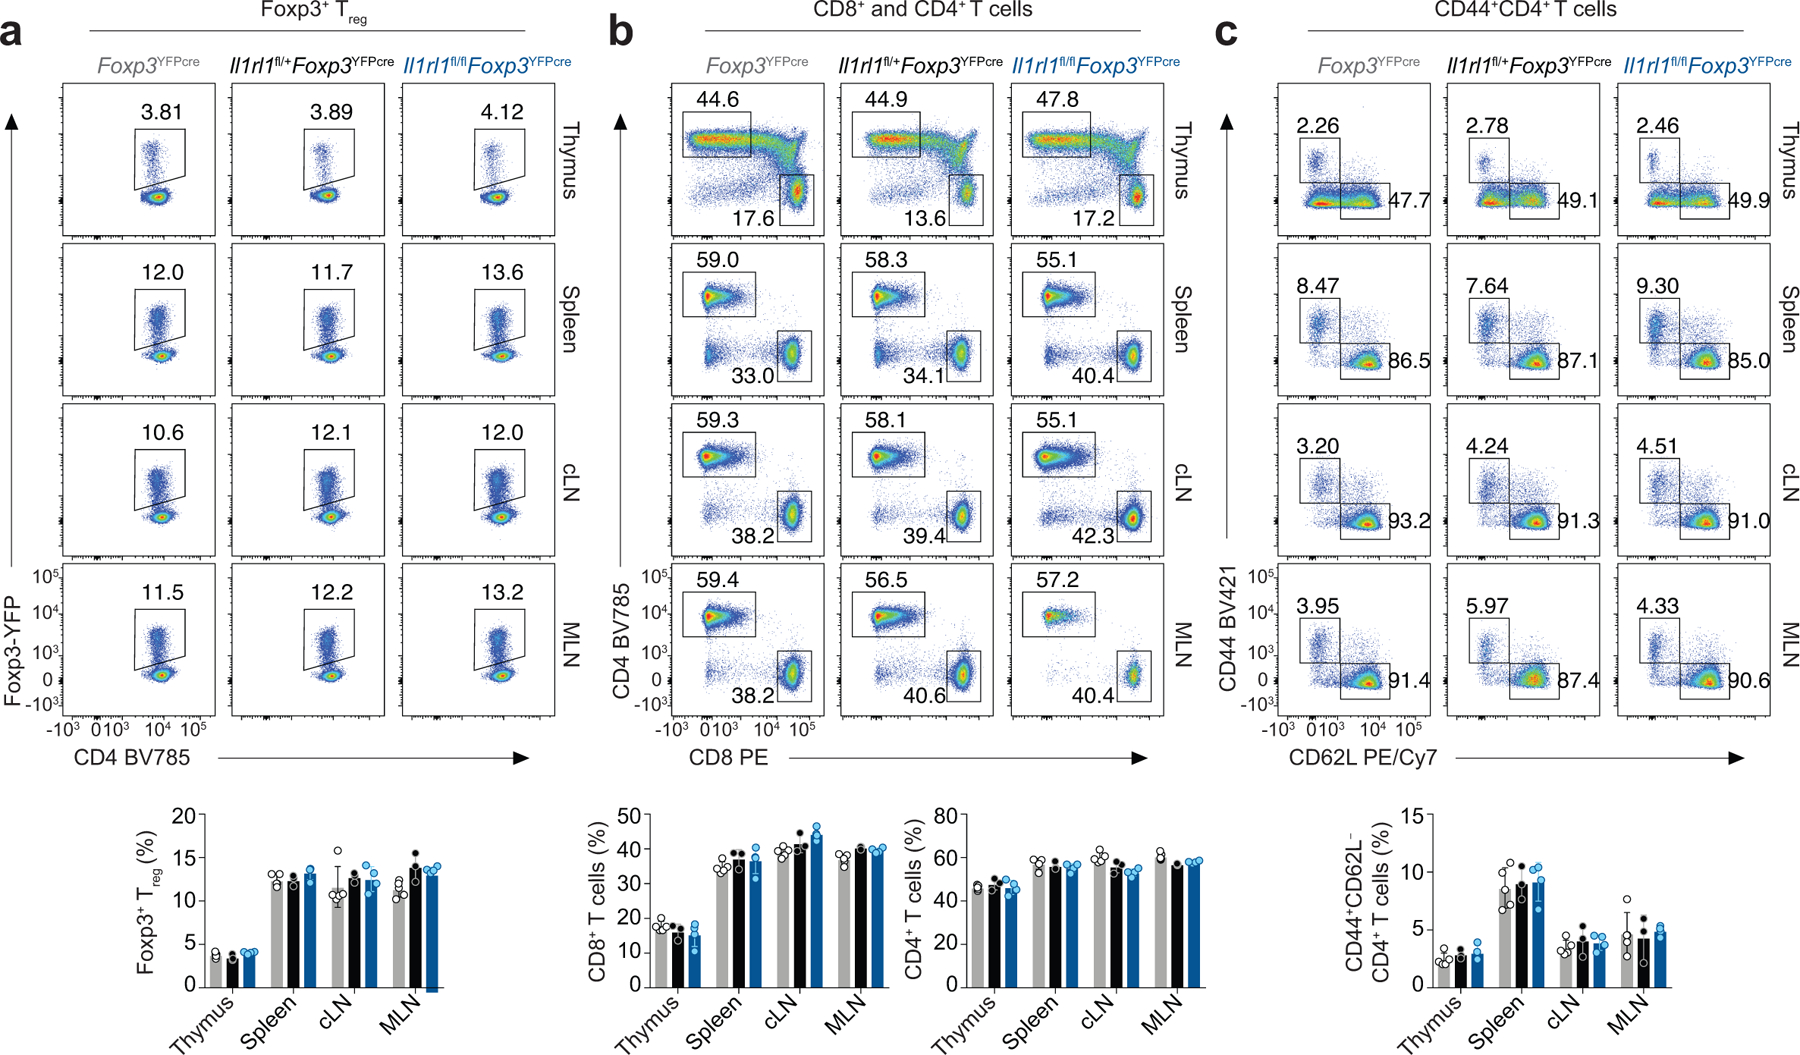
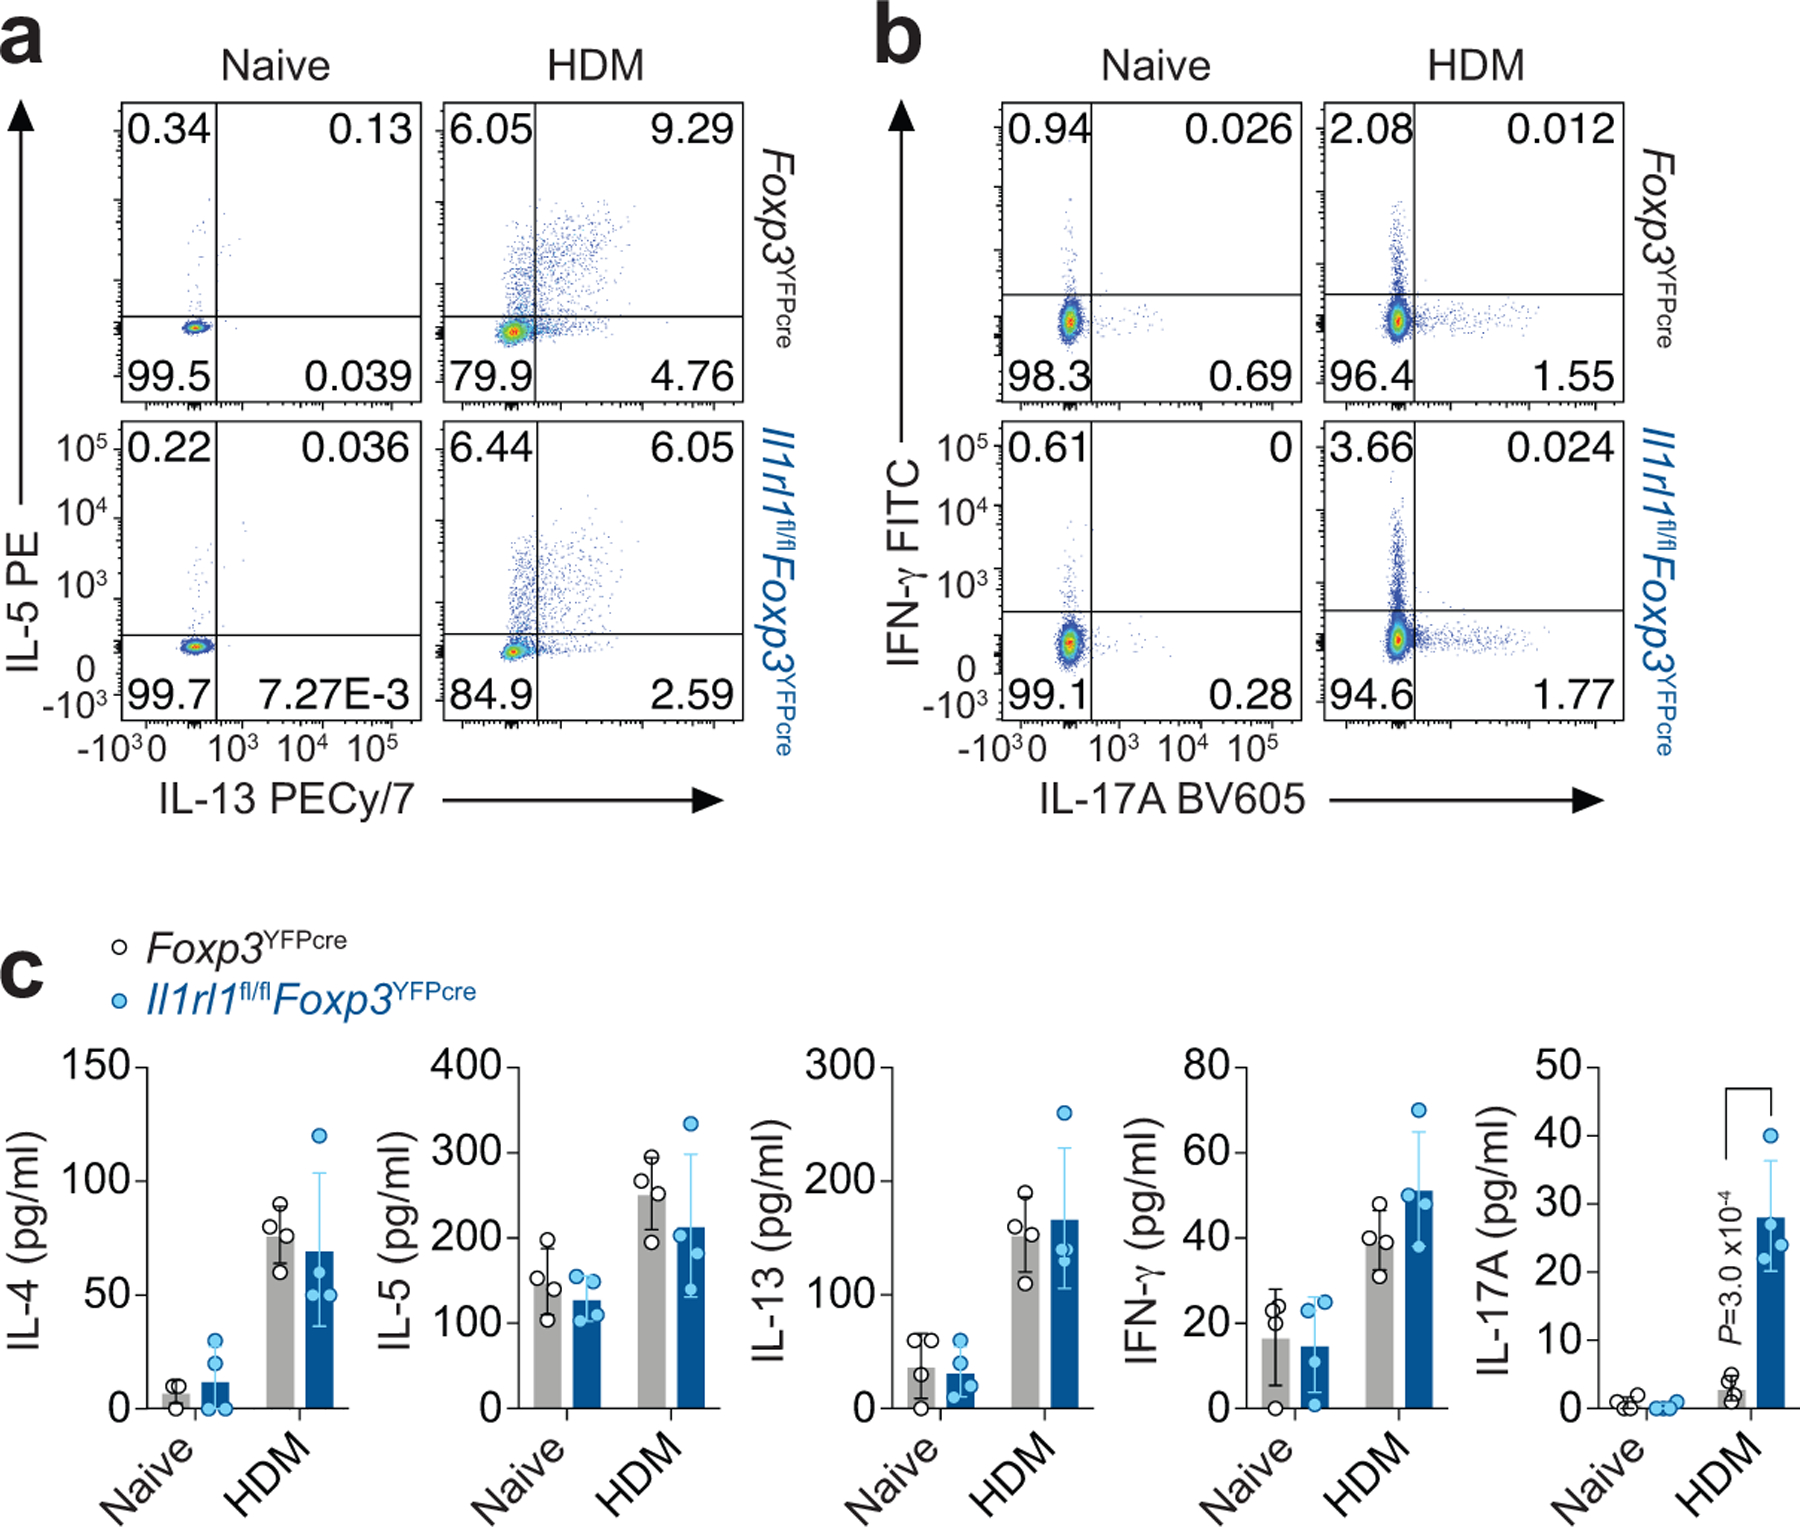
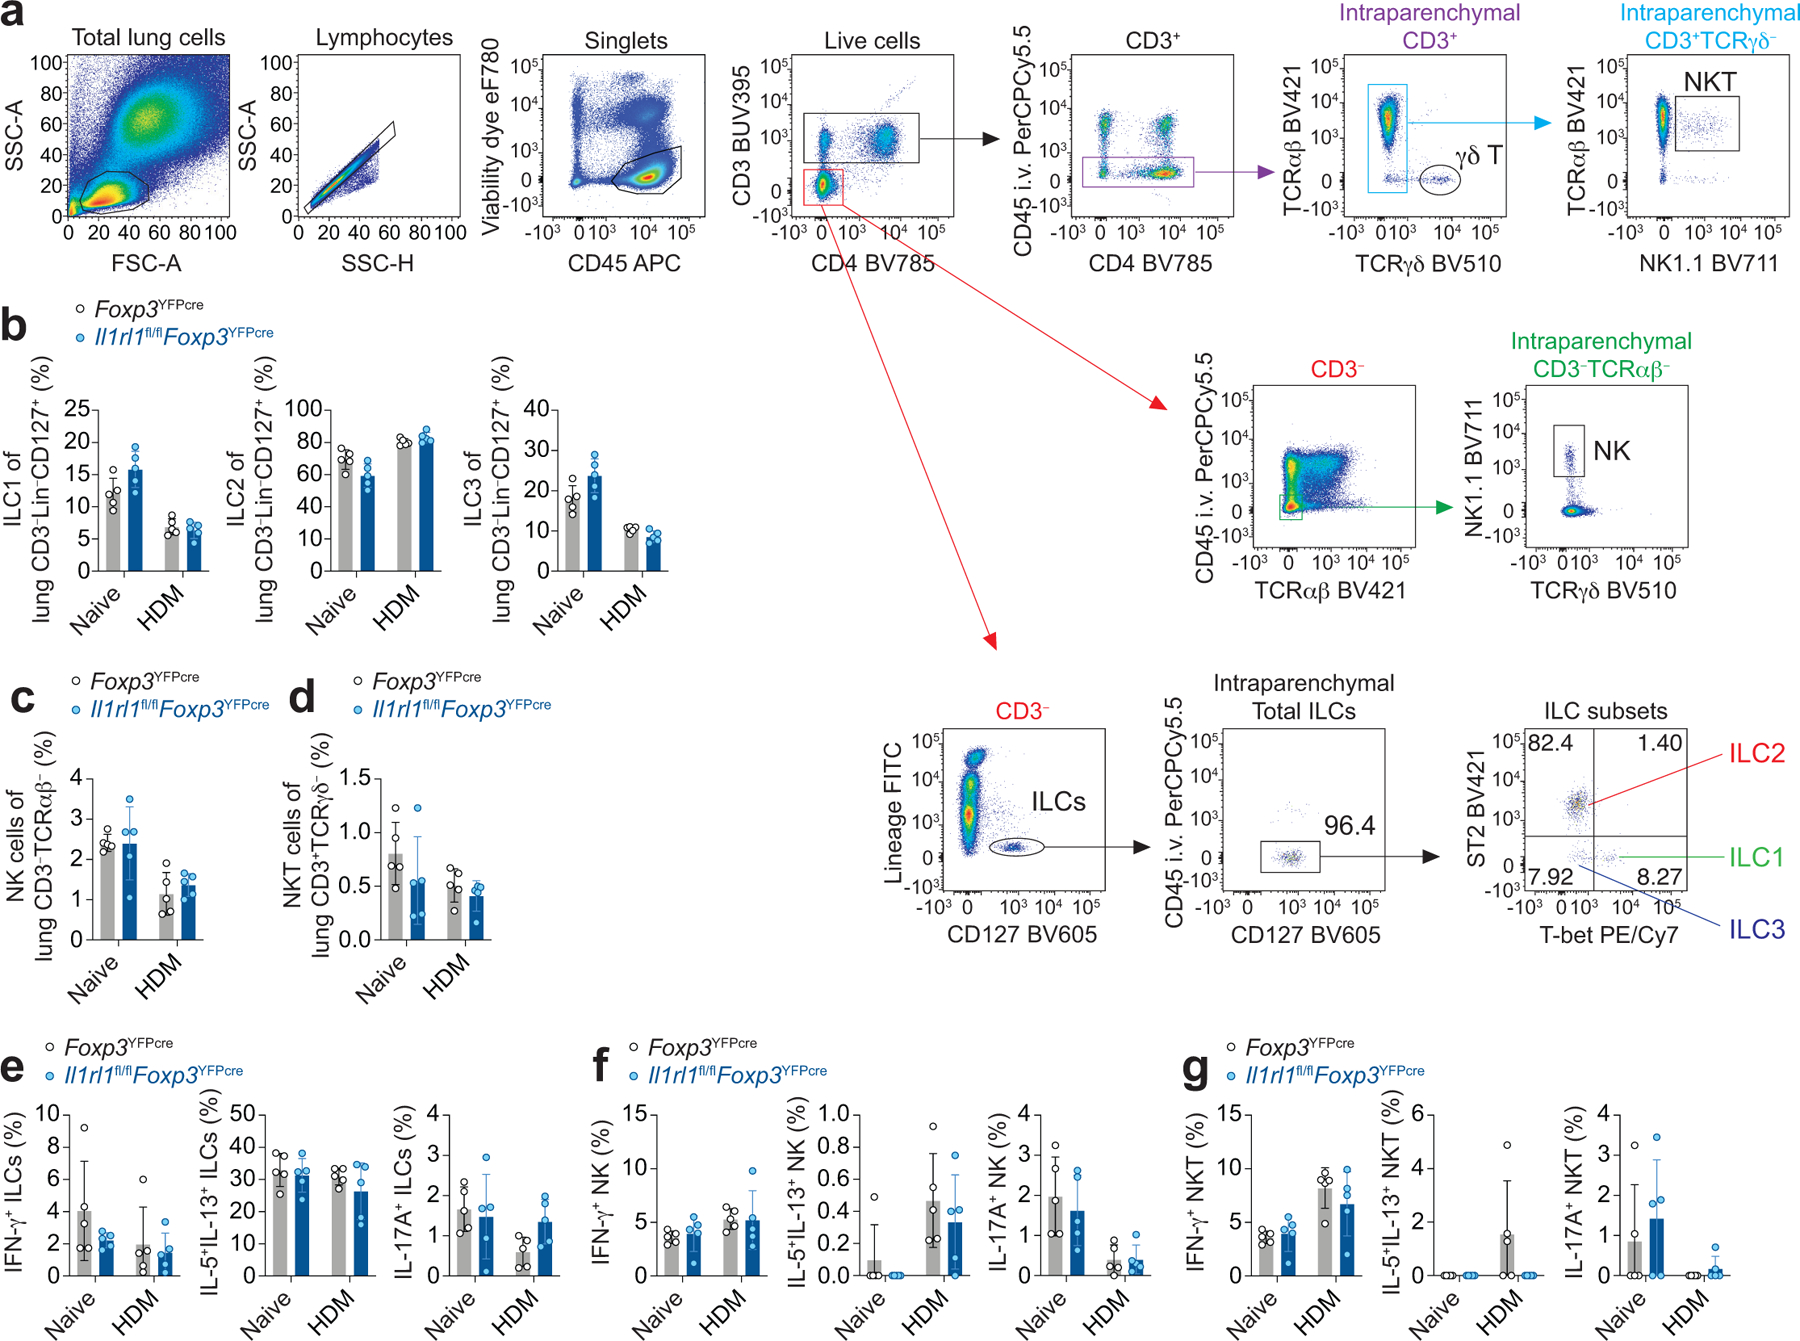
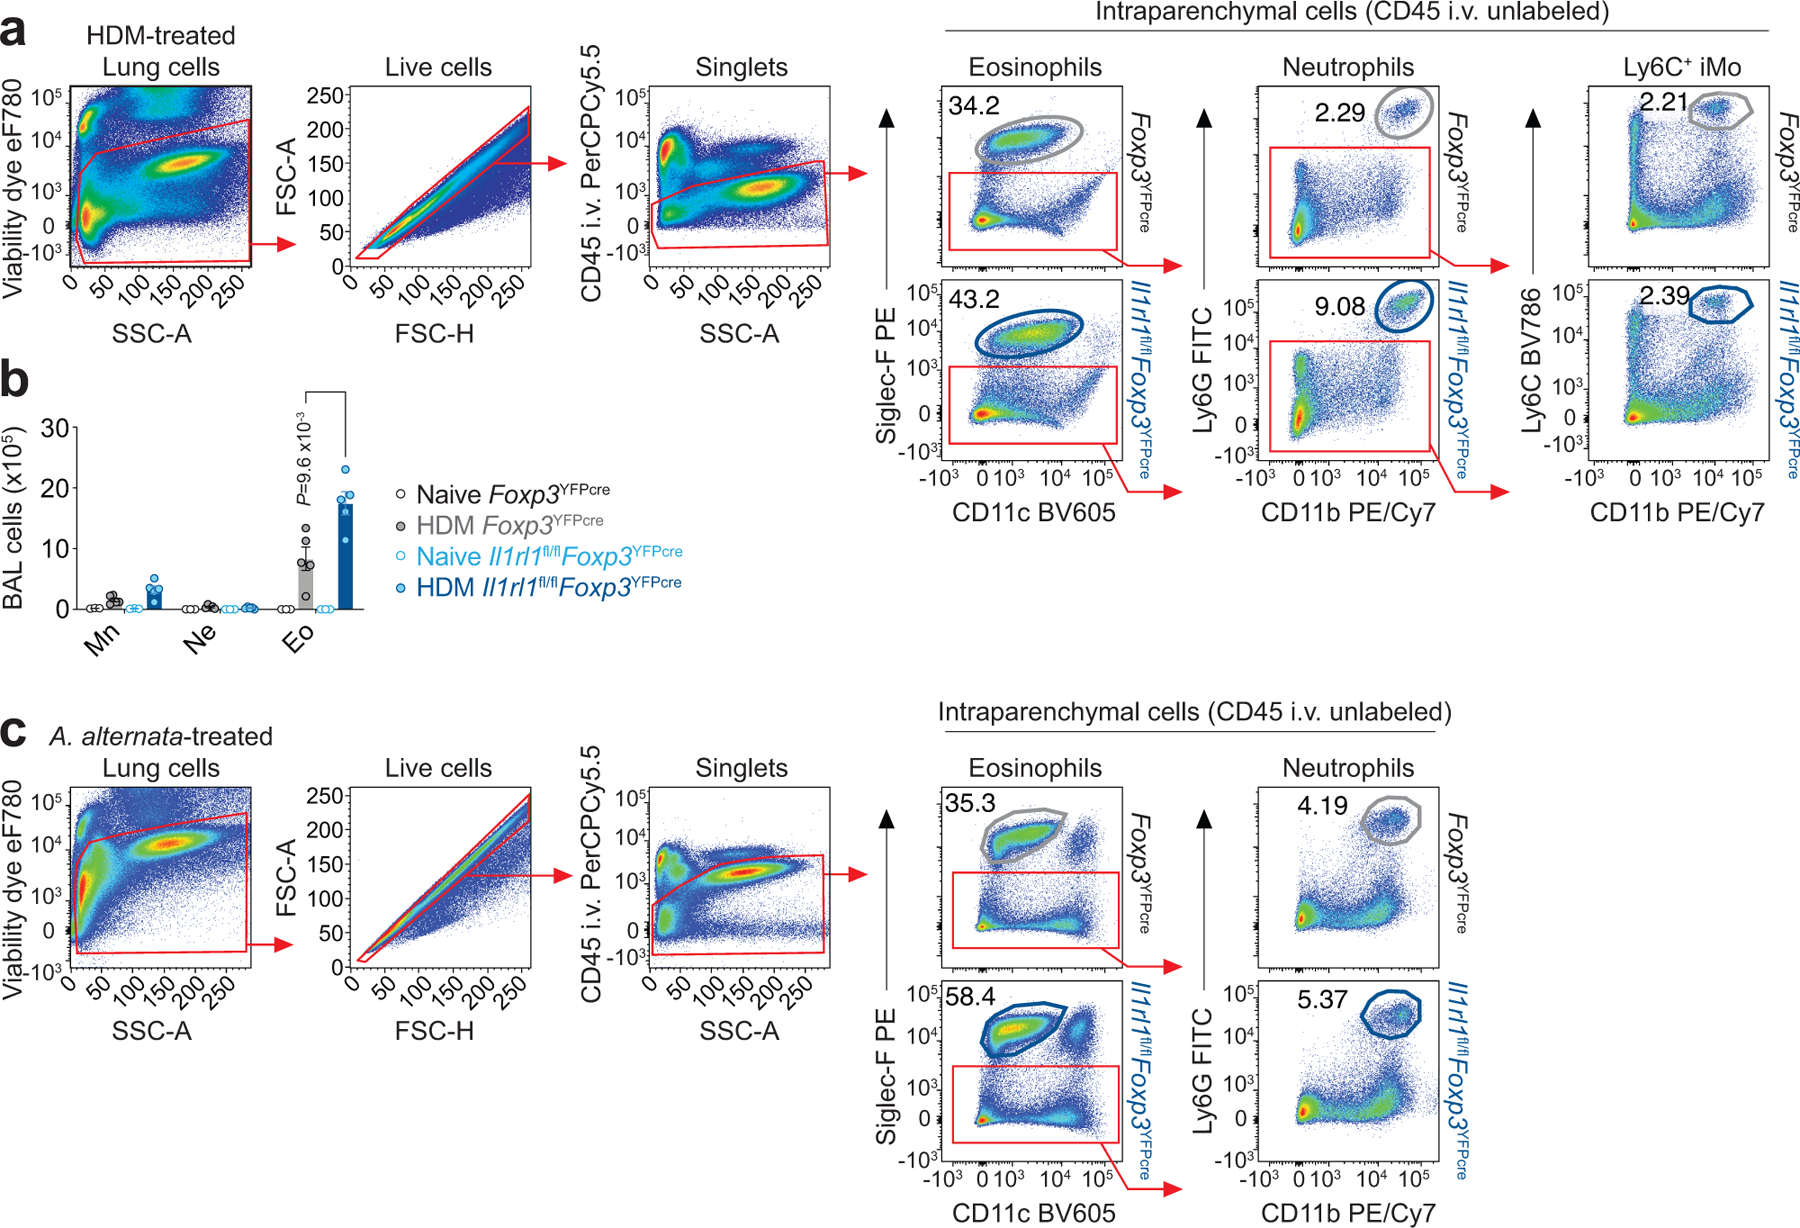
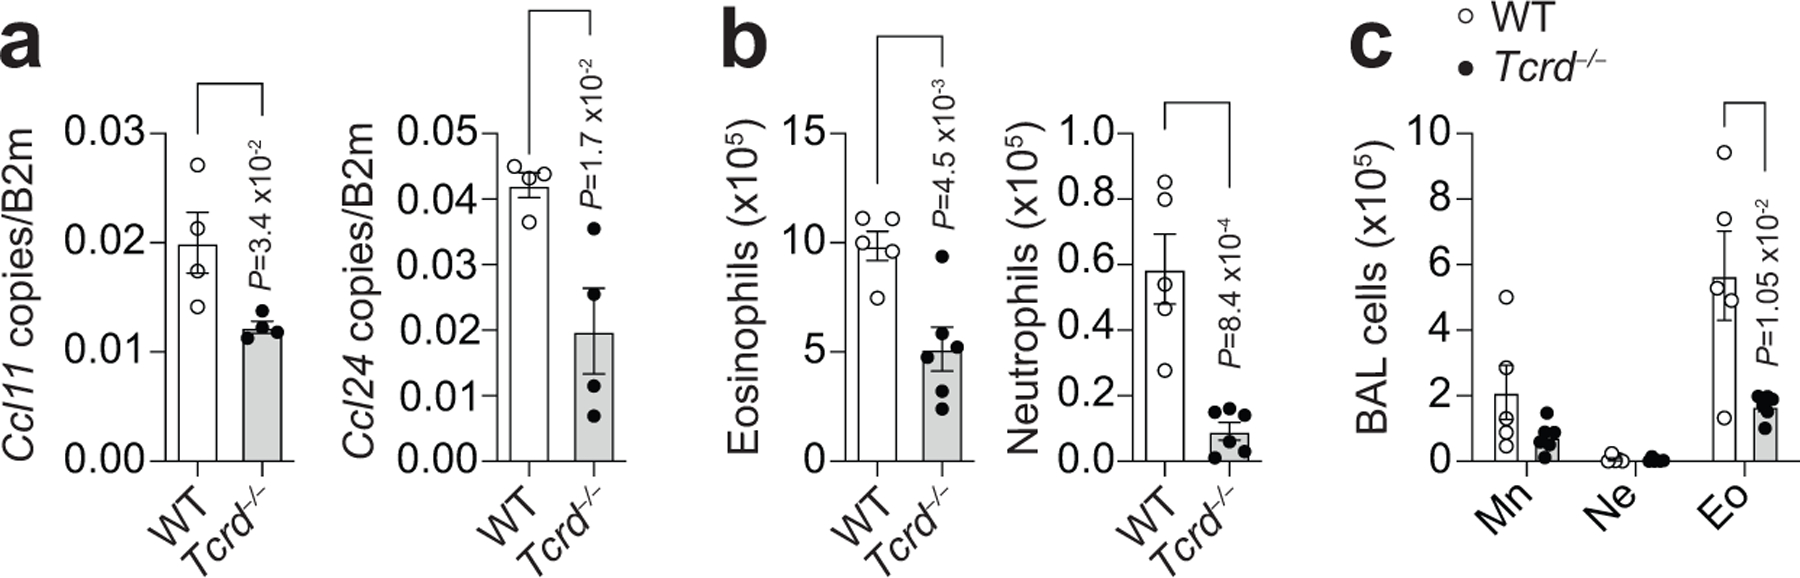
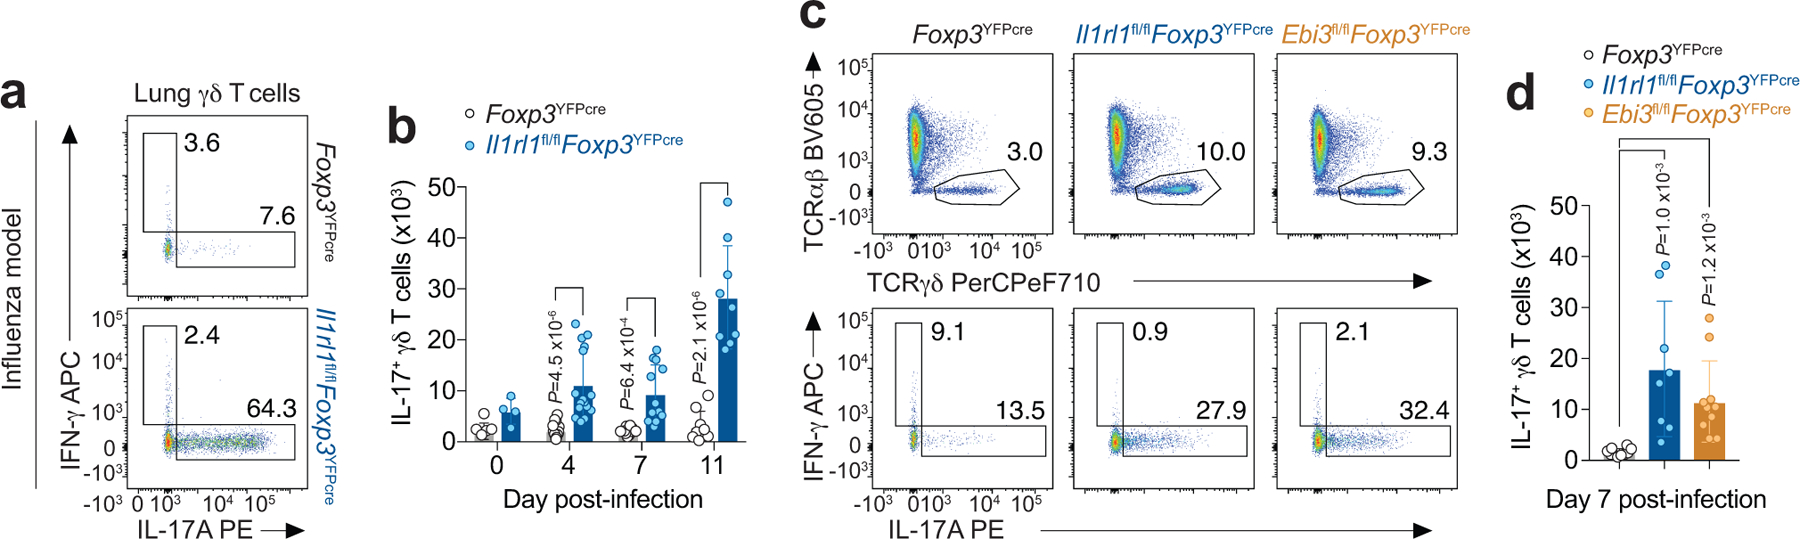
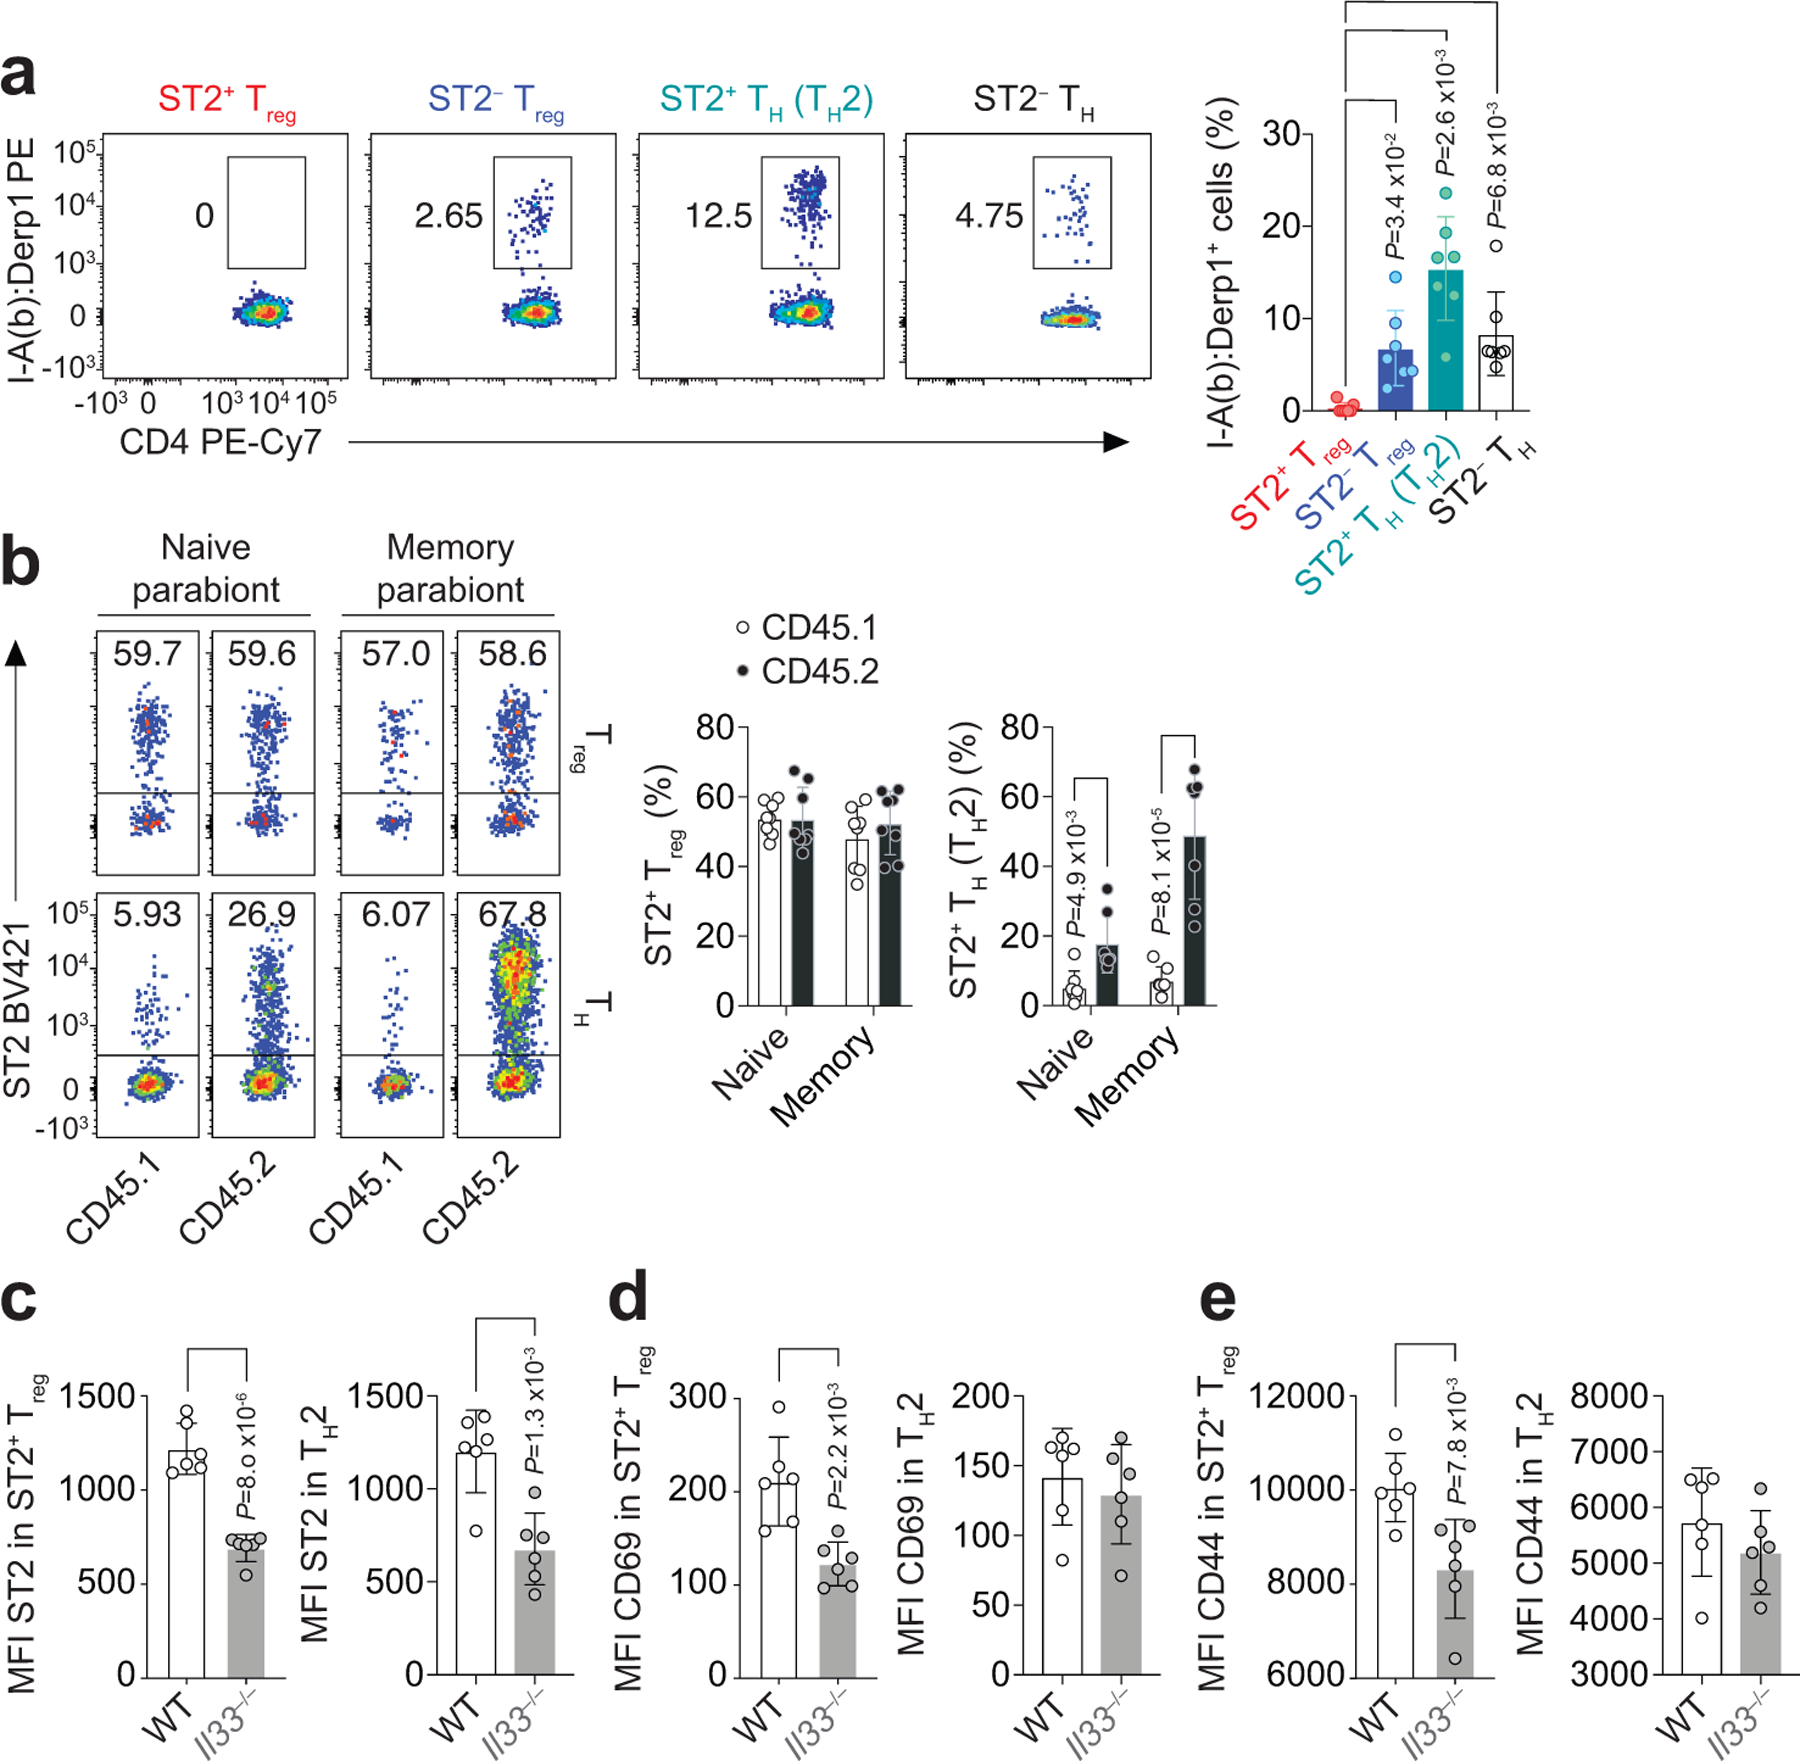
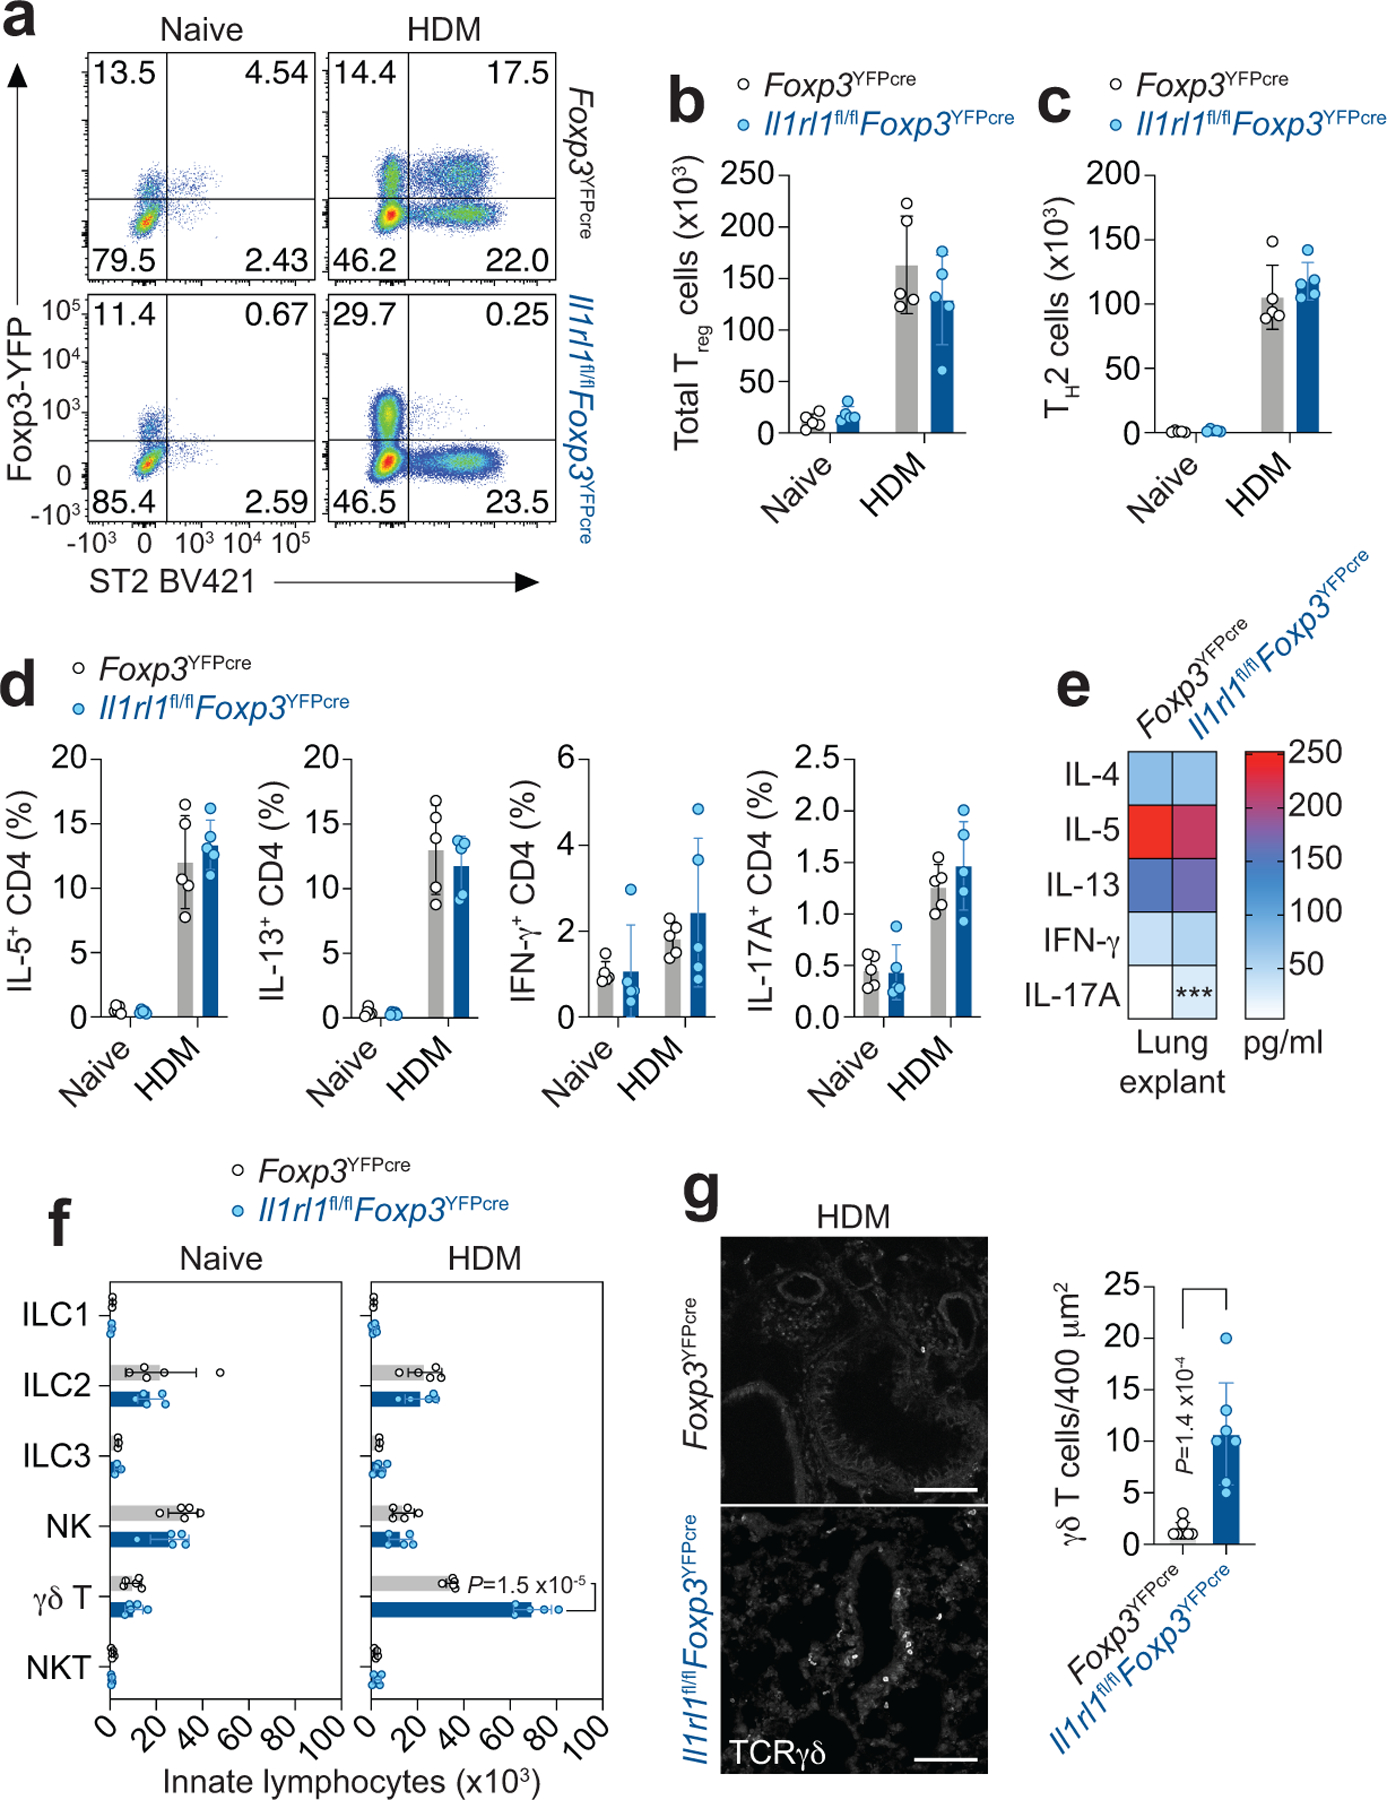
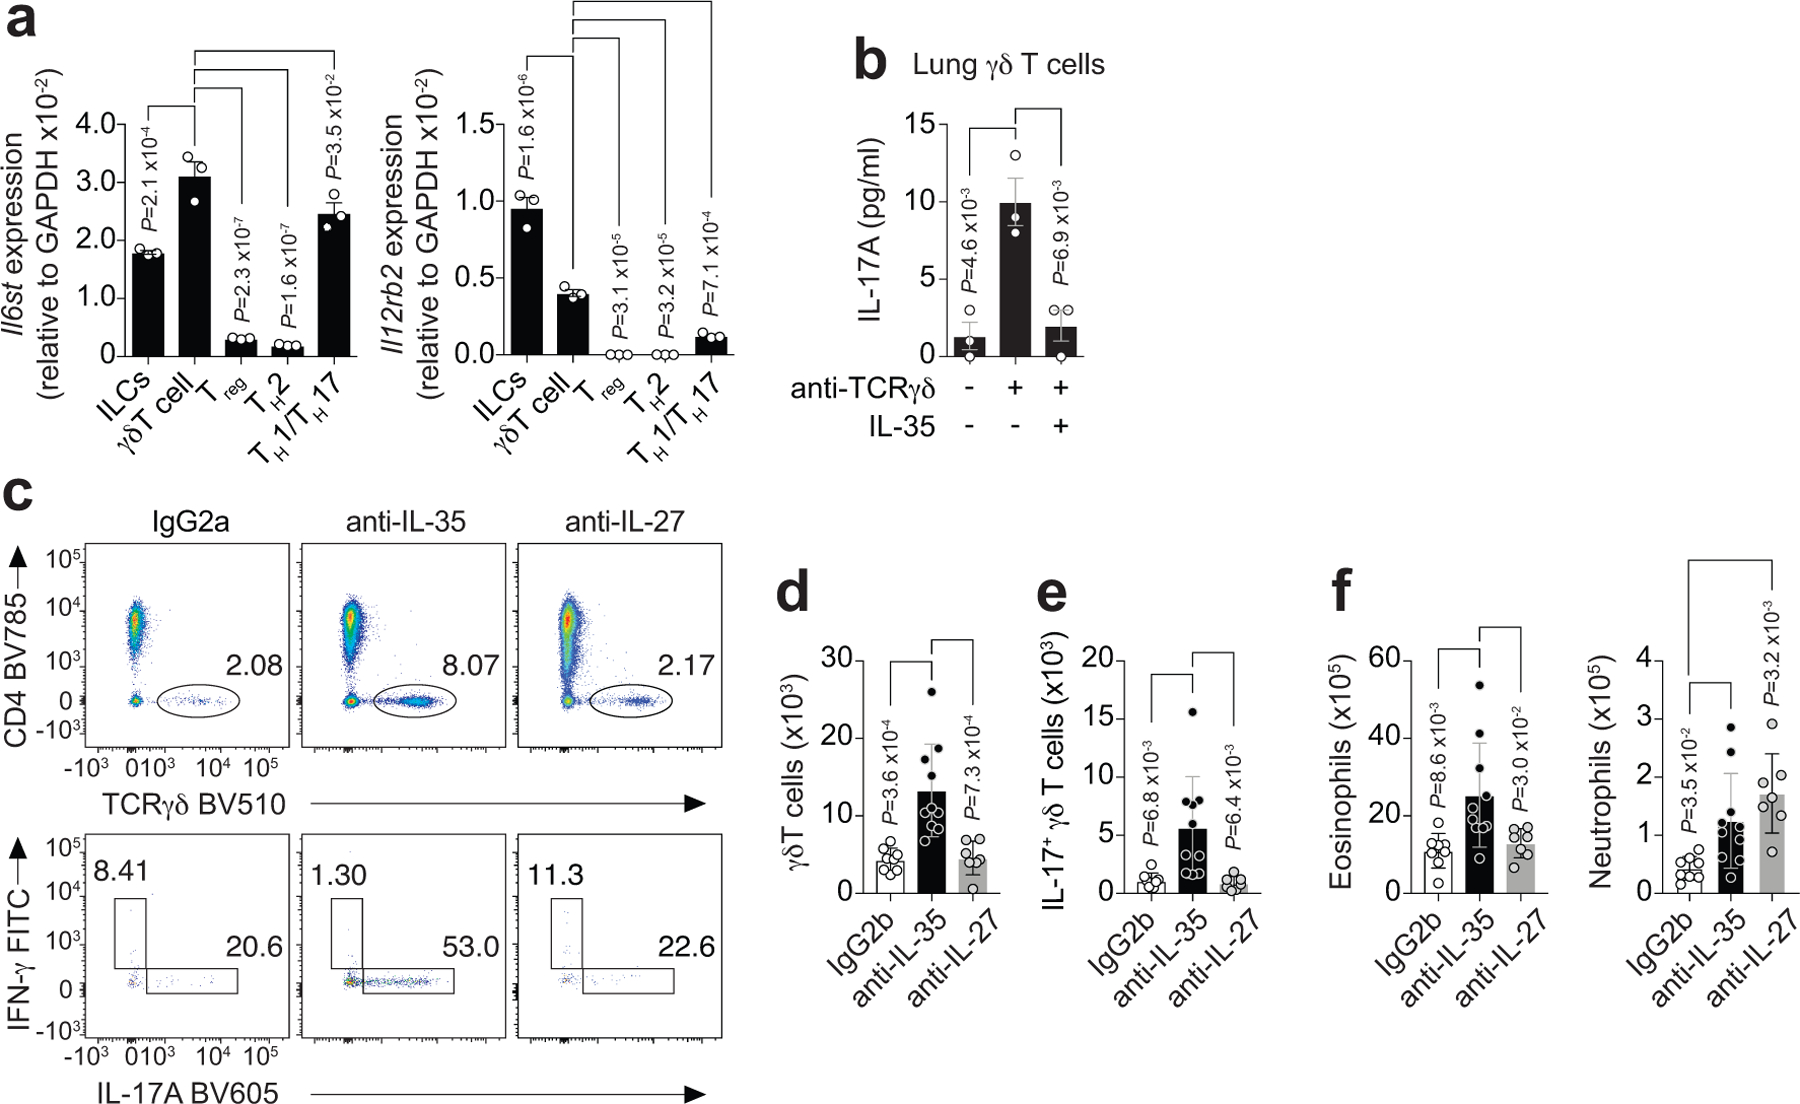
Foxp3+ regulatory T (Treg) cells expressing the interleukin (IL)-33 receptor ST2 mediate tissue repair in response to IL-33. Whether Treg cells also respond to the alarmin IL-33 to regulate specific aspects of the immune response is not known. Here we describe an unexpected function of ST2+ Treg cells in suppressing the innate immune response in the lung to environmental allergens without altering the adaptive immune response. Following allergen exposure, ST2+ Treg cells were activated by IL-33 to suppress IL-17-producing γδ T cells. ST2 signaling in Treg cells induced Ebi3, a component of the heterodimeric cytokine IL-35 that was required for Treg cell-mediated suppression of γδ T cells. This response resulted in fewer eosinophil-attracting chemokines and reduced eosinophil recruitment into the lung, which was beneficial to the host in reducing allergen-induced inflammation. Thus, we define a fundamental role for ST2+ Treg cells in the lung as a negative regulator of the early innate γδ T cell response to mucosal injury.


Conflict of interest statement

Competing Interests

The authors declare no competing interests.

Figures

Extended Data Fig. 1
Extended Data Fig. 1. Profiling ST2-expressing Treg and TH cells in the lungs of HDM-treated mice.
a-d, Foxp3YFPcre mice were treated with HDM i.n. on days 0 and 7–11 and analyzed on day 14. a, Schematic of experimental design. b, NanoString analysis of gene expression comparison between flow sort-purified CD4+Foxp3 T helper (TH) cells expressing ST2 (TH2) or not (ST2 TH) from lung parenchyma. Data are presented as volcano plot from three independent experiments of pooled mice (n = 7 mice per experiment). Unpaired two-tailed t test with Holm-Sidak correction for multiple comparisons was used to obtain the P values. c, Representative flow cytometry plots for IL-13 and IL-5 (top), and for IL-17A and IFN-γ (bottom) in TH2 and ST2 TH cells from lung parenchyma. d, Representative histograms showing the expression of the indicated transcription factors in ST2+ Treg cells (red) or ST2 Treg cells (blue) from lung parenchyma. Isotype control is shown in gray.
Extended Data Fig. 2
Extended Data Fig. 2. Subject characteristics.
Aeroallergen-allergic human subjects screened for eligibility with a full medical history, baseline spirometry, methacholine challenge, and allergen skin testing to confirm allergy to either cat dander or Dermatophagoides pteronyssinus)(DP). The threshold level of allergen sensitivity was determined by skin prick test titration using serial threefold dilutions of allergen extract.
Extended Data Fig. 3
Extended Data Fig. 3. IL-33 activates ST2+ Treg cells in the lung after HDM exposure.
a-c, Wild-type (WT) and Il33−/− mice were treated with HDM i.n. on days 0 and 7–11 and analyzed on day 10. a, Representative flow cytometry for Foxp3 and ST2 in CD4+ T cells from lung parenchyma. b, Percentage of ST2+ Treg cells, ST2 Treg cells, and TH2 (Foxp3ST2+) cells in the lung. c, Representative histograms showing the expression of the indicated surface markers in ST2+ Treg and TH2 cells from the lung parenchyma of WT (black) and Il33−/− (gray) mice. Data represent one experiment with n = 6 mice per group of two independent experiments in panels (a-c). Unpaired two-tailed t test was used for statistical analysis in panel (b). Error bars denote mean ± s.d. P values are indicated in the figure.
Extended Data Fig. 4
Extended Data Fig. 4. Treg cell-specific deletion of ST2 does not result in systemic alterations in the number or activation of T cells.
Thymus, spleen, cervical lymph nodes (cLN) and mesenteric lymph nodes (MLN) were harvested from naive Il1rl1fl/flFoxp3YFPcre mice, Il1rl1fl/+Foxp3YFPcre mice, and Il1rl1+/+Foxp3YFPcre (Foxp3YFPcre) littermate control mice for flow cytometric analysis. a, Representative flow cytometry for Foxp3 and CD4 in CD4+ T cells (top) and percentage of Foxp3+ Treg cells (bottom) from the indicated tissues. b, Representative flow cytometry for CD8 and CD4 in CD3+ T cells (top) and percentage of CD8+ T cells and CD4+ T cells (bottom) from the indicated tissues. c, Representative flow cytometry for CD44 and CD62L in CD4+ T cells (top) and percentage of CD44+CD4+ T cells (bottom) from the indicated tissues. Data represent one experiment (Foxp3YFPcre n = 5; Il1rl1fl/+Foxp3YFPcre n = 3; Il1rl1fl/flFoxp3YFPcre n = 4 mice per group) of two independent experiments in panels (a-c). Unpaired two-tailed t test with Holm-Sidak correction for multiple comparisons was used for statistical analysis in panels (a-c bottom). No statistical difference was found. Error bars denote mean ± s.d.
Extended Data Fig. 5
Extended Data Fig. 5. Immune response in the lung to HDM in mice with a Treg cell-specific deletion of ST2.
a-c, Il1rl1fl/flFoxp3YFPcre mice and Foxp3YFPcre littermate controls were left untreated (Naive) or were treated with HDM i.n. on days 0 and 7–11 and analyzed on day 14. a,b, Representative flow cytometry for IL-13 and IL-5 (a) and for IFN-γ and IL-17A (b) in CD4+Foxp3 (TH) cells from lung parenchyma. Data represent one experiment with n = 5 mice per group of two independent experiments in panels (a,b). c, Lung explants from Naive and HDM-treated mice were re-stimulated ex vivo with HDM and the indicated cytokines measured in culture supernatants 72 h later by ELISA. Data represent one experiment with n = 4 mice per group of two independent experiments. Unpaired two-tailed t test with Holm-Sidak correction for multiple comparisons was used for statistical analysis. Error bars denote mean ± s.d. P values are indicated in the figure.
Extended Data Fig. 6
Extended Data Fig. 6. Innate lymphocyte response in the lung to HDM.
a-g, Il1rl1fl/flFoxp3YFPcre mice and Foxp3YFPcre littermate controls were left untreated (Naive) or were treated with HDM i.n. on days 0 and 7–11 and analyzed on day 14. a, Gating strategy for flow cytometric analysis of innate lymphocytes in lung parenchyma. b-d, Percentage of ILC1 (T-bet+), ILC2 (ST2+), and ILC3 (ST2T-bet) of CD3LinCD127+ cells (b), percentage of natural killer (NK) cells of CD3TCRαβ cells (c), and percentage of NKT cells of CD3+TCRγδ cells (d) in the lung parenchyma. e-g, Percentage of lung ILCs (e), NK (f), and NKT cells (g) expressing IL-13 and IL-5, IFN-γ, or IL-17A. Data represent one experiment with n = 5 mice per group of three independent experiments in panels (b-g). Unpaired two-tailed t test with Holm-Sidak correction for multiple comparisons was used for statistical analysis in panels (b-g). No statistical difference was found. Error bars denote mean ± s.d.
Extended Data Fig. 7
Extended Data Fig. 7. Lung and airway inflammatory response to HDM and A. alternata in mice with a Treg cell-specific deletion of ST2.
a,b, Il1rl1fl/flFoxp3YFPcre mice and Foxp3YFPcre littermate controls were left untreated (Naive) or were treated with HDM i.n. on days 0 and 7–11 and analyzed on day 14. a, Gating strategy for flow cytometric analysis of eosinophils (CD11cSiglec-F+), neutrophils (Siglec-FCD11b+Ly6G+), and Ly6C+ inflammatory monocytes (Ly6C+ iMo, Siglec-FCD11b+Ly6C+) in the lung parenchyma of HDM-treated mice. b, Quantification of cell differential counts in BAL. Mn - Mononuclear cells; Ne - Neutrophils; Eo - Eosinophils. Data represent one experiment (Foxp3YFPcre Naive n = 3; Foxp3YFPcre HDM n = 5; Il1rl1fl/flFoxp3YFPcre Naive n = 3; Il1rl1fl/flFoxp3YFPcre HDM n = 5 mice per group) of two independent experiments. Unpaired two-tailed t test with Holm-Sidak correction for multiple comparisons was used for statistical analysis. c, Il1rl1fl/flFoxp3YFPcre mice and Foxp3YFPcre littermate controls were treated with A. alternata i.n. on days 0, 1 and 17–19 and analyzed on day 20. Gating strategy for flow cytometric analysis of eosinophils and neutrophils in the lung parenchyma of A. alternata-treated mice. Error bars denote mean ± s.d. P values are indicated in the figure.
Extended Data Fig. 8
Extended Data Fig. 8. Decreased lung CCL11 and CCL24 and allergic pulmonary inflammation in γδ T cell-deficient mice.
a-c, TCRγδ-deficient (Tcrd−/−) and WT mice were treated with HDM i.n. on days 0 and 7–11 and analyzed on day 14. a, Lung Ccl11 and Ccl24 mRNA levels relative to β2M determined by RT-qPCR. Data represent one experiment with n = 4 mice per group of two independent experiments. b, Number of eosinophils (CD11cSiglec-F+) and neutrophils (Siglec-FCD11b+Ly6G+) in lung parenchyma. c, Quantification of cell differential counts in BAL. Mn - Mononuclear cells; Ne - Neutrophils; Eo - Eosinophils. Data represent one experiment (WT n = 5; Tcrd−/− n = 6 mice per group) of two independent experiments in panels (b,c). Unpaired two-tailed t test was used for statistical analysis in panels (a,b) and unpaired two-tailed t test with Holm-Sidak correction for multiple comparisons was used for statistical analysis in panel (c). Error bars denote mean ± s.d. P values are indicated in the figure.
Extended Data Fig. 9
Extended Data Fig. 9. ST2+ Treg cell-derived Ebi3 suppresses γδ T cell responses in the lung to influenza infection.
a-d, Foxp3YFPcre, Il1rl1fl/flFoxp3YFPcre and Ebi3fl/flFoxp3YFPcre mice were infected with PR8 influenza and lungs were harvested for flow cytometry analysis in the indicated time points. a, Representative flow cytometry for IL-17A and IFN-γ in γδ T cells from lung parenchyma on day 11 post-infection. b, Number of IL-17A+ γδ T cells in the lung over the course of infection. Data pooled from two independent experiments (day 0: Foxp3YFPcre n = 5 and Il1rl1fl/flFoxp3YFPcre n = 4; day 4: Foxp3YFPcre n = 18 and Il1rl1fl/flFoxp3YFPcre n = 16; day 7: Foxp3YFPcre n = 10 and Il1rl1fl/flFoxp3YFPcre n = 12; day 11: Foxp3YFPcre n = 9 and Il1rl1fl/flFoxp3YFPcre n = 9 mice from the two experiments in each time point). Unpaired two-tailed t test with Holm-Sidak correction for multiple comparisons was used for statistical analysis in panel (b). c, Representative flow cytometry for TCRαβ and TCRγδ in CD3+ T cells (top) and for IL-17A and IFN-γ in γδ T cells (bottom) from lung parenchyma on day 7 post-infection. d, Number of lung IL-17A+ γδ T cells. Data pooled from two independent experiments (Foxp3YFPcre n = 10; Il1rl1fl/flFoxp3YFPcre n = 8; Ebi3fl/flFoxp3YFPcre n = 10 mice from the two experiments) in panel (d). Ordinary one-way ANOVA with Tukey’s multiple comparisons test was used for statistical analysis in panel (d). Error bars denote mean ± s.d. P values are indicated in the figure.
Figure 1.
Figure 1.. ST2+ Treg cells expand rapidly in the lung and airways of mice and humans after aeroallergen exposure.
a-d, Foxp3YFPcre mice were left untreated (Naive) or were treated with HDM i.n. on days 0 and 7–11 and analyzed on days 10 and/or 14. a, Gating strategy for flow cytometric analysis of CD4+ T cells in the lung vasculature that were labeled with anti-CD45 antibody given intravenously (CD45 i.v. labeled cells) or in the lung parenchyma (CD45 i.v. unlabeled cells). b,c, Representative flow cytometry for Foxp3 and ST2 in CD4+ T cells (b) and numbers of ST2+ Treg cells (red), ST2 Treg cells (blue) and TH2 (Foxp3ST2+) cells (green) (c) in the lung vasculature, lung parenchyma, and bronchoalveolar lavage (BAL). Data represent one experiment (day 0 n = 3 mice; day 10 n = 4 mice; day 14 n = 4 mice) of two independent experiments in panels (b,c). Unpaired two-tailed t test with Holm-Sidak correction for multiple comparisons was used for statistical analysis in panel (c). P values between ST2+ and ST2 Treg cells are shown. d,e, HDM or cat dander allergic human subjects (n = 11) underwent bronchoscopic segmental allergen challenge (SAC) with HDM or cat dander, respectively, and BAL and blood were collected before (Pre-SAC) and 24 h after segmental allergen (Post-SAC) or diluent (Post-Diluent) challenge. d, Representative flow cytometry for Foxp3 and ST2 in CD4+ T cells (left) and percentage of ST2+ Treg cells (right) from BAL (orange) and blood (black) pre- and post-SAC. Each symbol represents one subject. Repeated measures (RM) two-way ANOVA with Sidak’s multiple comparisons test was used for statistical analysis. e, Number of ST2+ Treg cells recovered from pre-SAC, Post-Diluent and Post-SAC BAL. Each symbol represents one subject. RM one-way ANOVA with Tukey’s multiple comparisons test was used for statistical analysis. Error bars denote mean ± s.d. P values are indicated in the figure.
Figure 2.
Figure 2.. ST2+ Treg cells respond to IL-33 but not directly to allergen peptide.
a, Foxp3YFPcre mice were treated with HDM i.n. on days 0 and 7–11 and analyzed on day 14. Representative flow cytometry for MHC class II I-Ab:Der p 1117–127 (I-A(b):Derp1) tetramer (left) and percentage of tetramer-specific CD4+ T cell populations (right) from lungs after tetramer-based cell enrichment. Data pooled from seven independent experiments. Each symbol represents a pool of n = 2 mice per experiment. Ordinary one-way ANOVA with Tukey’s multiple comparisons test was used for statistical analysis in panel (a, right). b, Representative flow cytometry for ST2 on CD45.1 and CD45.2 CD4+Foxp3+ (Treg) and CD4+Foxp3 (TH) cells in the lung parenchyma (left) and percentage of lung ST2+ Treg cells and ST2+Foxp3 (TH2) cells over total CD4+Foxp3+ Treg and CD4+Foxp3 TH cells, respectively (right). Data pooled from three independent experiments (n = 8 parabiontic pairs from the three experiments). Each symbol represents one mouse. Unpaired two-tailed t test with Holm-Sidak correction for multiple comparisons was used for statistical analysis in panel (b, right). c-e, Wild-type (WT) and Il33−/− mice were treated with HDM i.n. on days 0 and 7–11 and analyzed on day 10. Mean fluorescence intensity (MFI) of ST2 (c), CD69 (d), and CD44 (e) on ST2+ Treg and TH2 cells isolated from lung parenchyma. Data represent one experiment with n = 6 mice per group of two independent experiments in panels (c-e). Unpaired two-tailed t test was used for statistical analysis in panels (c-e). Error bars denote mean ± s.d. P values are indicated in the figure.
Figure 3.
Figure 3.. Treg cell-specific deletion of ST2 increases γδ T cells in the lung in response to HDM.
a-g, Il1rl1fl/flFoxp3YFPcre mice and Foxp3YFPcre littermate controls were left untreated (Naive) or were treated with HDM i.n. on days 0 and 7–11 and analyzed on day 14. a, Representative flow cytometry for Foxp3 and ST2 in CD4+ T cells from lung parenchyma. b,c, Number of total Treg (b) and TH2 (Foxp3ST2+) cells (c) in the indicated groups. d, Percentage of lung CD4+Foxp3 T helper (TH) cells expressing IL-5, IL-13, IFN-γ, or IL-17A. Data represent one experiment with n = 5 mice per group of two independent experiments in panels (b-d). Unpaired two-tailed t test with Holm-Sidak correction for multiple comparisons was used for statistical analysis in panels (b-d). No statistical difference was found. e, Lung explants from HDM-treated mice were re-stimulated ex vivo with HDM and the indicated cytokines measured in culture supernatants 72 h later by ELISA. Data are presented as heatmap from one experiment with n = 4 mice per group of two independent experiments. Unpaired two-tailed t test was used for statistical analysis. *** P = 0.000897. f, Number of different innate lymphocytes in the lung parenchyma. Data represent one experiment with n = 5 mice per group of three independent experiments. Unpaired two-tailed t test with Holm-Sidak correction for multiple comparisons was used for statistical analysis. g, Representative confocal microscopy images of γδ T cells identified with an anti-TCRγδ mAb (left), and quantification of total γδ T cells/400 μm2 area (right) in lung sections from three HDM-treated Il1rl1fl/flFoxp3YFPcre mice (n = 7 lung sections) and three HDM-treated Foxp3YFPcre littermate controls (n = 8 lung sections). Each symbol represents the analysis of one lung section. Scale bars, 100 μm. Unpaired two-tailed t test was used for statistical analysis in panel (g, right). Error bars denote mean ± s.d. P values are indicated in the figure or otherwise indicated in the legend.
Figure 4.
Figure 4.. IL-33–ST2 signaling in Treg cells restrains γδ T cell activation and function.
a-f, Il1rl1fl/flFoxp3YFPcre mice and Foxp3YFPcre littermate controls were left untreated (Naive) or were treated with HDM i.n. on days 0 and 7–11 and analyzed on day 14. a, Representative images of lung sections stained for CD4 (red), YFP (Foxp3, green) and TCRγδ (blue). Data are representative images of lungs from three HDM-treated mice of each strain. White arrowhead indicates the Treg – γδ T cell interaction. Scale bars, 100 μm. b, Quantification of the distance between each Treg and γδ T cells (Treg – γδ T cell interaction for Foxp3YFPcre n = 101 and for Il1rl1fl/flFoxp3YFPcre n = 475) in eight different lung sections analyzed from three HDM-treated mice of each strain. Unpaired two-tailed t test was used for statistical analysis. c, Percentage of Treg cells within the indicated distance (μm) of each γδ T cell. Each symbol represents pooled data from analysis of one lung section (n = 8 lung sections) from three HDM-treated mice of each strain. Unpaired two-tailed t test with Holm-Sidak correction for multiple comparisons was used for statistical analysis. d, Representative histograms showing CD69 and ICOS expression on CD3+TCRγδ+ (γδ T) cells from the lung parenchyma of Foxp3YFPcre (black) or Il1rl1fl/flFoxp3YFPcre mice (blue). Isotype control is shown in gray. Numbers within histogram are mean ± s.d. of fluorescence intensity (MFI) for each markers of the indicated strain. Data represent one experiment with n = 3 mice per group of two independent experiments. Unpaired two-tailed t test was used for statistical analysis. **P=0.0018 and ***P=0.00012. e,f, Representative flow cytometry for IL-17A and IFN-γ in γδ T cells (e) and numbers of IL-17A+ γδ T cells (f) from the lung parenchyma. Data represent one experiment with n = 5 mice per group of three independent experiments in panels (e,f). Unpaired two-tailed t test with Holm-Sidak correction for multiple comparisons was used for statistical analysis in panel (f). g-j, WT and Il33−/− mice were treated with HDM i.n. on days 0 and 7–9 and analyzed on day 10. g,h, Representative histogram (g) and MFI (h) of CD69 expression in lung γδ T cells. i,j, Representative flow cytometry for IL-17A and IFN-γ in γδ T cells (i) and number of IL-17A+ γδ T cells (j) from lung parenchyma. Data represent one experiment with n = 6 mice per group of two independent experiments in panels (g-j). Unpaired two-tailed t test was used for statistical analysis in panels (h,j). k-n, HDM-exposed Foxp3YFPcre mice were treated daily with soluble ST2 IgG-Fc fusion protein (sST2-Fc) to block IL-33 signaling or isotype control (IgG2a) i.v. during the allergen challenges (day 7–9) and analyzed on day 10. k,l, Representative histogram (k) and MFI (l) of CD69 expression in lung γδ T cells. m,n, Representative flow cytometry for IL-17A and IFN-γ in γδ T cells (m) and number of IL-17A+ γδ T cells (n) from lung parenchyma. Data represent one experiment with n = 5 mice per group of two independent experiments in panels (k-n). Unpaired two-tailed t test was used for statistical analysis in panels (l,n). Error bars denote mean ± s.d. P values are indicated in the figure or otherwise indicated in the legend.
Figure 5.
Figure 5.. γδ T cells mediate exacerbated allergic pulmonary inflammation in mice lacking ST2 in Treg cells.
a-g, Mouse strains indicated in different colors were left untreated (Naive) or were treated with HDM i.n. on days 0 and 7–11 and analyzed on day 14. a, Histopathology of lung sections stained for H&E and periodic acid-Schiff (PAS). Scale bars, 100 μm. b, Inflammation score. c, Mucus score (left) and RT-qPCR analysis of Muc5ac mRNA levels relative to β2 microglobulin (β2M) in total lung (right). Data represent one experiment with n = 5 mice per group in panels (a,b,c left) and one experiment (Foxp3YFPcre Naive n = 4; Foxp3YFPcre HDM n = 6; Il1rl1fl/flFoxp3YFPcre Naive n = 3; Il1rl1fl/flFoxp3YFPcre HDM n = 6) in panel (c right) of two independent experiments. d, Number of eosinophils (CD11cSiglec-F+), neutrophils (Siglec-FCD11b+Ly6G+) and Ly6C+ inflammatory monocytes (Siglec-FCD11b+Ly6C+) in lung parenchyma. Data represent one experiment with n = 5 mice per group of three independent experiments. Unpaired two-tailed t test with Holm-Sidak correction for multiple comparisons was used for statistical analysis in panels (b-d). e, Representative flow cytometry for CD4 and TCRγδ in CD3+ T cells from lung parenchyma of HDM-treated mice. f, Number of γδ T cells from lung parenchyma of HDM-treated mice. g, Number of eosinophils and neutrophils in lung parenchyma. Data pooled from three independent experiments (Foxp3YFPcre n = 11; Il1rl1fl/flFoxp3YFPcre n = 12; Il1rl1fl/flFoxp3YFPcreTcrd−/− n = 11 mice from the three experiments) in panels (f,g). Ordinary one-way ANOVA with Tukey’s multiple comparisons test was used for statistical analysis in panels (f,g). h-k, Il1rl1fl/flFoxp3YFPcre mice and Foxp3YFPcre littermate controls were treated with A. alternata i.n. on days 0, 1 and 17–19 and analyzed on day 20. h, Representative flow cytometry for CD4 and TCRγδ in CD3+ T cells (top) and for IL-17A and IFN-γ in γδ T cells (bottom) from lung parenchyma. i, Number of lung IL-17A+ γδ T cells. j, Representative histogram of CD69 expression in lung γδ T cells. Numbers within histogram are mean ± s.d. of fluorescence intensity of CD69 for the indicated strain. ***P = 0.00086. k, Number of eosinophils and neutrophils in lung parenchyma. Data pooled from two independent experiments (Foxp3YFPcre n = 13; Il1rl1fl/flFoxp3YFPcre n = 7 mice from the two experiments) in panels (i,k) or represent one experiment (Foxp3YFPcre n = 7; Il1rl1fl/flFoxp3YFPcre n = 4 mice) of two independent experiments in panel (j). Unpaired two-tailed t test was used for statistical analysis in panels (i-k). Error bars denote mean ± s.d. P values are indicated in the figure or otherwise indicated in the legend.
Figure 6.
Figure 6.. IL-17 blockade decreases eosinophil-attracting chemokine production and eosinophil recruitment into the lung.
a,b, Il1rl1fl/flFoxp3YFPcre mice and Foxp3YFPcre littermate controls were left untreated (Naive) or were treated with HDM i.n. on days 0 and 7–11 and analyzed on day 14. a, Levels of the indicated lung chemokine mRNA relative to β2 microglobulin (β2M) determined by RT-qPCR. Data pooled from two independent experiments (Foxp3YFPcre Naive n = 6; Foxp3YFPcre HDM n = 6; Il1rl1fl/flFoxp3YFPcre Naive n = 6; Il1rl1fl/flFoxp3YFPcre HDM n = 8 mice from the two experiments). b, Levels of CCL11 and CCL24 protein in lung homogenates. Data represent one experiment (Foxp3YFPcre Naive n = 3; Foxp3YFPcre HDM n = 4; Il1rl1fl/flFoxp3YFPcre Naive n = 3; Il1rl1fl/flFoxp3YFPcre HDM n = 5 mice) of two independent experiments. Unpaired two-tailed t test with Holm-Sidak correction for multiple comparisons was used for statistical analysis in panels (a,b). c-e, HDM-exposed Il1rl1fl/flFoxp3YFPcre mice were treated daily with anti-IL-17A blocking mAb or isotype control (IgG2a) i.n. during the allergen challenges (day 7–11) and analyzed on day 14. c, Lung Ccl11 and Ccl24 mRNA levels relative to β2M determined by RT-qPCR. d, Number of eosinophils (CD11cSiglec-F+) and neutrophils (Siglec-FCD11b+Ly6G+) in lung parenchyma. e, Quantification of cell differential counts in BAL. Mn - Mononuclear cells; Ne - Neutrophils; Eo - Eosinophils. Data pooled from two independent experiments (IgG2a n = 8; anti-IL-17A n = 9 mice from the two experiments) in panels (c-e). Unpaired two-tailed t test was used for statistical analysis in panels (c,d) and unpaired two-tailed t test with Holm-Sidak correction for multiple comparisons was used for statistical analysis in panel (e). Error bars denote mean ± s.d. P values are indicated in the figure.
Figure 7.
Figure 7.. ST2+ Treg cell-derived Ebi3 is required to suppress γδ T cell IL-17 responses in the lung.
a-c, Foxp3YFPcre mice were treated with HDM i.n. on days 0 and 7–11 and analyzed on day 14. a, NanoString analysis of comparative gene expression between flow sort-purified ST2+ and ST2 Treg cell populations isolated from lung parenchyma. Data are presented as volcano plot from three independent experiments of pooled mice (n = 7 per experiment). Unpaired two-taile t test with Holm-Sidak correction for multiple comparisons was used to obtain the P values. b, RT-qPCR analysis of Ebi3, Il12a (IL-12p35) and Il27 (IL-27p28) in flow sort-purified ST2+ and ST2 Treg cell populations from lung parenchyma. Data pooled from four independent experiments. Each symbol represents a pool of n = 7 mice per experiment. Unpaired two-tailed t test was used for statistical analysis. c, Representative histogram of IL-17RB (IL-25R) expression on ST2+ Treg cells (red) and ST2 Treg cells (blue) from lung parenchyma. Isotype control is shown in gray. Data represent one experiment with n = 3 mice per group of two independent experiments. d, Flow sort-purified splenic ST2+ Treg cells from naive Foxp3YFPcre mice were stimulated in vitro with the indicated stimuli and RT-qPCR analysis of Ebi3 and Il12a performed 72 h later. Data are triplicates of pooled mice (n = 4) and represent one of two independent experiments. Ordinary one-way ANOVA with Tukey’s multiple comparisons test was used for statistical analysis. e, Flow sort-purified splenic Treg cells from naive Foxp3YFPcre mice (WT Treg), Il1rl1fl/flFoxp3YFPcre mice (Il1rl1−/− Treg), or from Ebi3fl/flFoxp3YFPcre mice (Ebi3−/− Treg) were stimulated in vitro as indicated and Ebi3 and IL-12p35 levels determined by ELISA 72 h later. Data are triplicates of pooled mice (n = 3) and represent one of two independent experiments. Unpaired two-tailed t test with Holm-Sidak correction for multiple comparisons was used for statistical analysis in panel (e). f-i, Foxp3YFPcre, Il1rl1fl/flFoxp3YFPcre and Ebi3fl/flFoxp3YFPcre mice were treated with HDM i.n. on days 0 and 7–11 and analyzed on day 14. f, Representative flow cytometry for IL-17A and IFN-γ in γδ T cells from lung parenchyma. g, Number of lung IL-17A+ γδ T cells. h, Number of eosinophils (CD11cSiglec-F+) and neutrophils (Siglec-FCD11b+Ly6G+) in lung parenchyma. i, Quantification of cell differential counts in BAL. Mn - Mononuclear cells; Ne - Neutrophils; Eo - Eosinophils. Data pooled from two independent experiments (Foxp3YFPcre n = 7; Il1rl1fl/flFoxp3YFPcre n = 9; Ebi3fl/flFoxp3YFPcre n = 7 mice from the two experiments) in panels (g-i). Ordinary one-way ANOVA with Tukey’s multiple comparisons test was used for statistical analysis in panels (g,h) and unpaired two-tailed t test with Holm-Sidak correction for multiple comparisons was used for statistical analysis in panel (i). Error bars denote mean ± s.d. P values are indicated in the figure.
Figure 8.
Figure 8.. IL-35 suppresses γδ T cell IL-17 responses in the lung induced by HDM.
a, RT-qPCR analysis of Il6st (left) and Il12rb2 (right), the two chains of the IL-35 receptor, in flow sort-purified lymphocytes from lung parenchyma of HDM-treated Foxp3YFPcre mice. Data pooled from three independent experiments. Each symbol represents a pool of n = 4 mice per experiment. b, Flow sort-purified lung γδ T cells from HDM-treated Foxp3YFPcre mice were stimulated in vitro as indicated and IL-17A protein levels determined by ELISA 72 h later. Data are triplicates of a pool of n = 4 mice and represent one of two independent experiments. Ordinary one-way ANOVA with Tukey’s multiple comparisons test was used for statistical analysis in panels (a,b). c-f, HDM-exposed Foxp3YFPcre mice were treated with mAbs that specifically neutralize IL-35 or IL-27, or with a mAb isotype control (IgG2b) i.p. on days 6 and 11 and analyzed on day 14. c, Representative flow cytometry for CD4 and TCRγδ in CD3+ T cells (top) and for IL-17A and IFN-γ in γδ T cells (bottom) from lung parenchyma. d, Number of total lung γδ T cells. e, Number of lung IL-17A+ γδ T cells. f, Number of eosinophils (CD11cSiglec-F+) and neutrophils (Siglec-FCD11b+Ly6G+) in lung parenchyma. Data pooled from two independent experiments (IgG2b n = 8; anti-IL-35 n = 10; anti-IL-27 n = 7 mice from the two experiments) in panels (d-f). Ordinary one-way ANOVA with Tukey’s multiple comparisons test was used for statistical analysis in panels (d-f). Error bars denote mean ± s.d. P values are indicated in the figure.

Comment in

References

References (main text only)

    1. Brunkow ME et al. Disruption of a new forkhead/winged-helix protein, scurfin, results in the fatal lymphoproliferative disorder of the scurfy mouse. Nat Genet 27, 68–73 (2001). - PubMed
    1. Kim JM, Rasmussen JP & Rudensky AY Regulatory T cells prevent catastrophic autoimmunity throughout the lifespan of mice. Nat Immunol 8, 191–197 (2007). - PubMed
    1. Campbell DJ & Koch MA Phenotypical and functional specialization of FOXP3+ regulatory T cells. Nat Rev Immunol 11, 119–130 (2011). - PMC - PubMed
    1. Burzyn D et al. A special population of regulatory T cells potentiates muscle repair. Cell 155, 1282–1295 (2013). - PMC - PubMed
    1. Arpaia N et al. A Distinct Function of Regulatory T Cells in Tissue Protection. Cell 162, 1078–1089 (2015). - PMC - PubMed

References (methods only)

    1. Itohara S et al. T cell receptor delta gene mutant mice: independent generation of alpha beta T cells and programmed rearrangements of gamma delta TCR genes. Cell 72, 337–348 (1993). - PubMed
    1. Rubtsov YP et al. Regulatory T cell-derived interleukin-10 limits inflammation at environmental interfaces. Immunity 28, 546–558 (2008). - PubMed
    1. Oboki K et al. IL-33 is a crucial amplifier of innate rather than acquired immunity. Proc Natl Acad Sci U S A 107, 18581–18586 (2010). - PMC - PubMed
    1. Chen WY, Hong J, Gannon J, Kakkar R & Lee RT Myocardial pressure overload induces systemic inflammation through endothelial cell IL-33. Proc Natl Acad Sci U S A 112, 7249–7254 (2015). - PMC - PubMed
    1. Turnis ME et al. Interleukin-35 Limits Anti-Tumor Immunity. Immunity 44, 316–329 (2016). - PMC - PubMed

Publication types

LinkOut - more resources