. 2020 Oct 23;23(10):101585.
doi: 10.1016/j.isci.2020.101585. Epub 2020 Sep 23.

SARS-CoV-2 Infection Boosts MX1 Antiviral Effector in COVID-19 Patients

Affiliations

SARS-CoV-2 Infection Boosts MX1 Antiviral Effector in COVID-19 Patients

Juan Bizzotto et al. iScience. .

Abstract

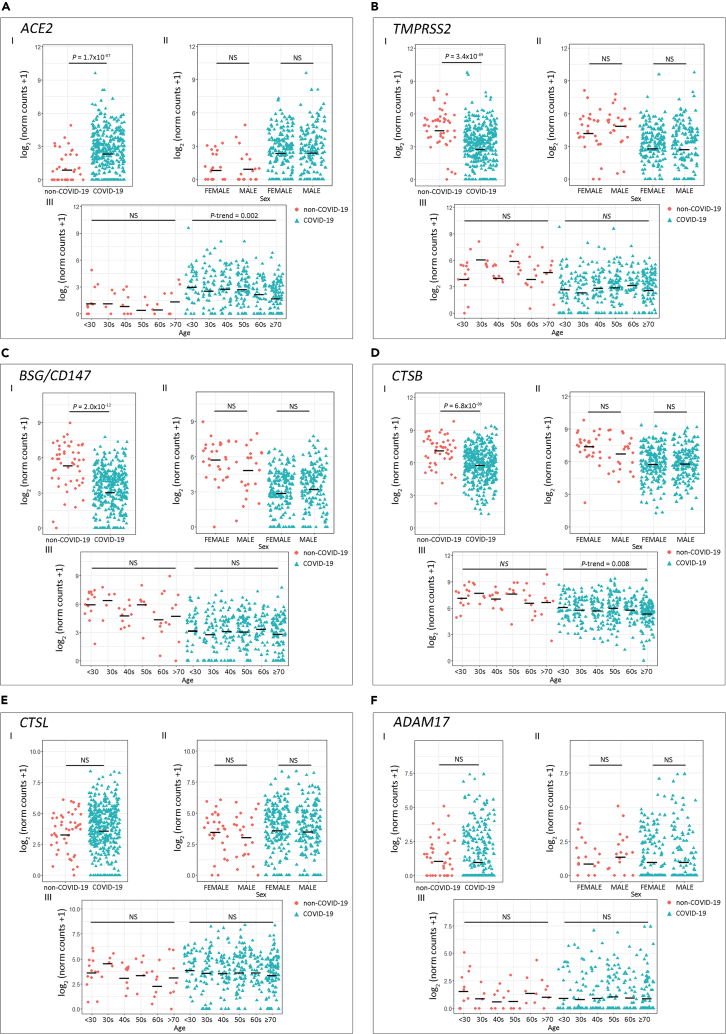
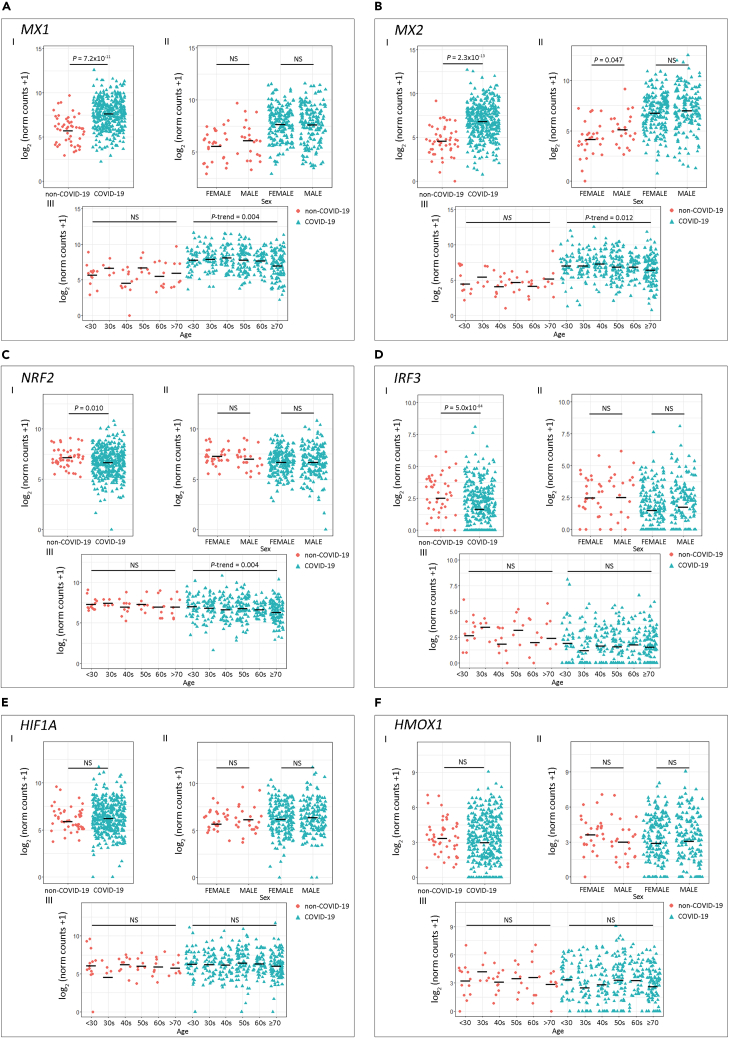
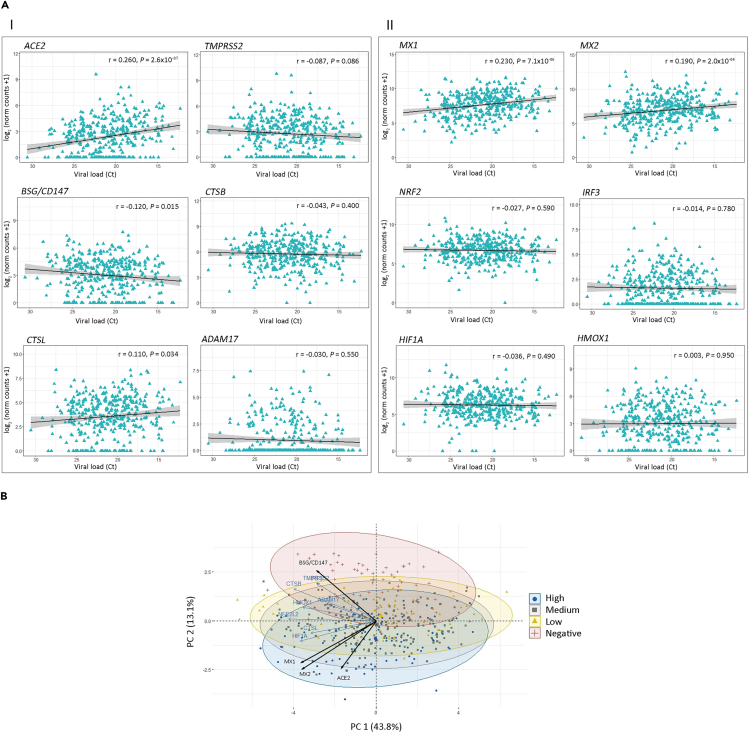
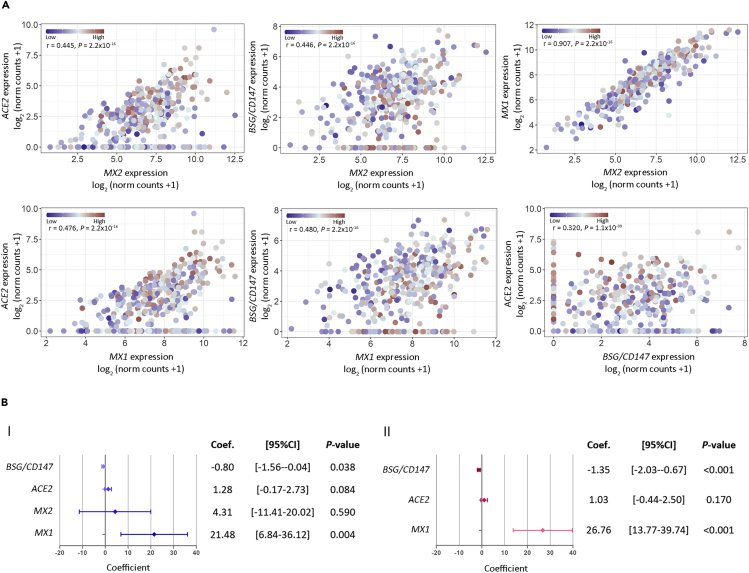
In a published case-control study (GSE152075) from SARS-CoV-2-positive (n = 403) and -negative patients (n = 50), we analyzed the response to infection assessing gene expression of host cell receptors and antiviral proteins. The expression analysis associated with reported risk factors for COVID-19 was also assessed. SARS-CoV-2 cases had higher ACE2, but lower TMPRSS2, BSG/CD147, and CTSB expression compared with negative cases. COVID-19 patients' age negatively affected ACE2 expression. MX1 and MX2 were higher in COVID-19 patients. A negative trend for MX1 and MX2 was observed as patients' age increased. Principal-component analysis determined that ACE2, MX1, MX2, and BSG/CD147 expression was able to cluster non-COVID-19 and COVID-19 individuals. Multivariable regression showed that MX1 expression significantly increased for each unit of viral load increment. Altogether, these findings support differences in ACE2, MX1, MX2, and BSG/CD147 expression between COVID-19 and non-COVID-19 patients and point out to MX1 as a critical responder in SARS-CoV-2 infection.

Keywords: Health Informatics; Virology.


Conflict of interest statement

The authors declare no competing interests.

Figures

None
Graphical abstract
Figure 1
Figure 1
Expression of Host Cell Receptor Genes in COVID-19 and Non-COVID-19 Patients (A–F) Gene expression analysis for host cell receptor genes (A) ACE2, (B) TMPRSS2, (C) BSG/CD147, (D) CTSB, (E) CTSL, and (F) ADAM17. (I) COVID-19 versus non-COVID-19 patients (p values correspond to Wilcoxon rank-sum test); (II) COVID-19 and non-COVID-19 patients by sex (p values correspond to Wilcoxon rank-sum test); (III) COVID-19 and non-COVID-19 patients categorized by age groups (p values correspond to decreasing Jonckheere-Terpstra trend test). Statistical significance was set at p < 0.05. NS: not significant.
Figure 2
Figure 2
Expression of Host Antiviral Effector Genes in COVID-19 and Non-COVID-19 Patients (A–F) Gene expression analysis for the selected host cell receptor genes (A) MX1, (B) MX2, (C) NRF2, (D) IRF3, (E) HIF1A, and (F) HMOX1. (I) COVID-19 versus non-COVID-19 patients (p values correspond to Wilcoxon rank-sum test), (II) COVID-19 and non-COVID-19 patients by sex (p values correspond to Wilcoxon rank-sum test), and (III) COVID-19 and non-COVID-19 patients categorized by age groups (p values correspond to decreasing Jonckheere-Terpstra trend test). Statistical significance was set at p < 0.05. NS: not significant.
Figure 3
Figure 3
Gene Correlation and Principal-Component Analysis (PCA) (A) Pairwise Spearman correlation matrix analysis between all genes of interest. The upper half displays the Spearman coefficients (r) considering all patients (Corr), non-COVID-19 patients (Neg.), or COVID-19 patients (Pos.). Black boxes highlight genes that have significant correlation only in COVID-19 patients. Statistical significance ∗p < 0.05; ∗∗p < 0.01; ∗∗∗p < 0.001. The lower half displays the scatterplots. (B) PCA biplot of gene expression data showing a rough segregation of non-COVID-19 and COVID-19 samples. Each point represents one individual, and the arrows depict the gene expression profile; black arrows show the 4 genes that have the greatest weight in driving the difference between the groups. (C) 3D scatter plots for (I) ACE2, MX1, and BSG/CD147 and (II) ACE2, MX2, and BSG/CD147.
Figure 4
Figure 4
Correlation Analysis between Gene Expression and SARS-CoV-2 Viral Load in COVID-19 Patients (A) Viral load and gene expression correlation for (I) ACE2, TMPRSS2, BSG/CD147, CTSB, CTSL, and ADAM17 and for (II) MX1, MX2, NRF2, IRF3, HIF1A, and HMOX1. Viral load was defined by the cycle threshold (Ct) of the N1 viral gene amplification during diagnostic PCR. Spearman coefficient (r) is shown for each correlation. Statistical significance was set at p < 0.05. NS: not significant. (B) Principal-component analysis biplot of gene expression data showing a rough segregation of non-COVID-19 and COVID-19 patients stratified by low (Ct > 24), medium (Ct = 24–19), and high (Ct < 19; blue) viral load. Each point represents one individual, and the arrows depict the gene expression profile; black arrows show the 4 genes that have the greatest weight in driving the difference between the groups.
Figure 5
Figure 5
Association between Viral Load and Gene Expression (A) Dot plots representing pairwise correlations for BSG/CD147, ACE2, MX1, and MX2 considering viral load in COVID-19 patients. For each comparison, the independent variable is plotted in the x axis and the dependent variable is plotted in the y axis. For all cases, viral load was considered as an independent variable. Viral load is represented as a color scale. (B) Forest plots representing multivariable regression analysis. Model (I) considering as covariates: individual gene expression, viral load, and age; and model (II) considering as covariates: viral load, age, and all genes. Statistical significance was set at p < 0.05. NS: not significant.

References

    1. Bai Y., Yao L., Wei T., Tian F., Jin D.-Y., Chen L., Wang M. Presumed asymptomatic carrier transmission of COVID-19. JAMA. 2020;323:1406–1407. - PMC - PubMed
    1. Belouzard S., Chu V.C., Whittaker G.R. Activation of the SARS coronavirus spike protein via sequential proteolytic cleavage at two distinct sites. Proc. Natl. Acad. Sci. U S A. 2009;106:5871–5876. - PMC - PubMed
    1. Bhargava A., Lahaye X., Manel N. Let me in: control of HIV nuclear entry at the nuclear envelope. Cytokine Growth Factor Rev. 2018;40:59–67. - PubMed
    1. Centers for Disease Control and Prevention 2020. https://www.cdc.gov/coronavirus/2019-ncov/need-extra-precautions/older-a...
    1. Chiang H.-S., Liu H.M. The molecular basis of viral inhibition of IRF- and STAT-dependent immune responses. Front. Immunol. 2018;9:3086. - PMC - PubMed

LinkOut - more resources