

Spatiotemporal patterns and trends of community transmission of the pandemic COVID-19 in South Asia: Bangladesh as a case study
- PMID: 32989431
- PMCID: PMC7510419
- DOI: 10.1016/j.bsheal.2020.09.006
Spatiotemporal patterns and trends of community transmission of the pandemic COVID-19 in South Asia: Bangladesh as a case study
Abstract
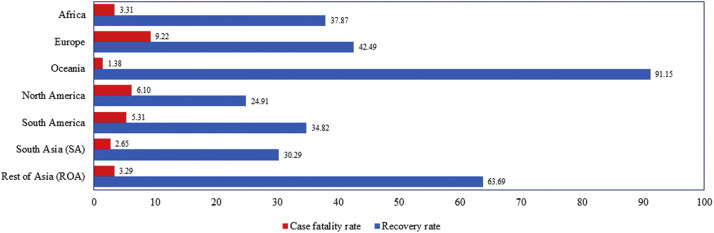
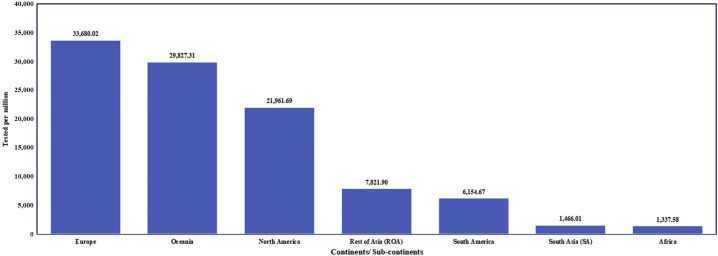
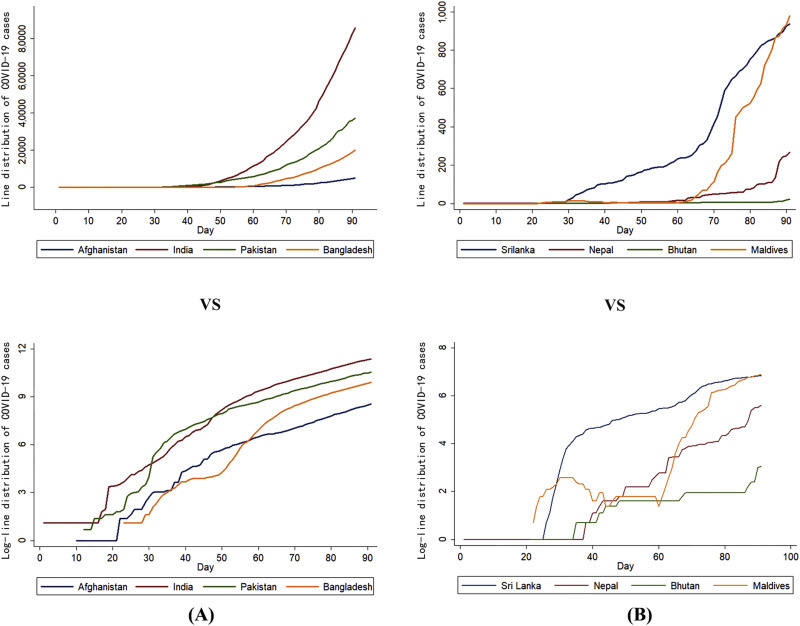
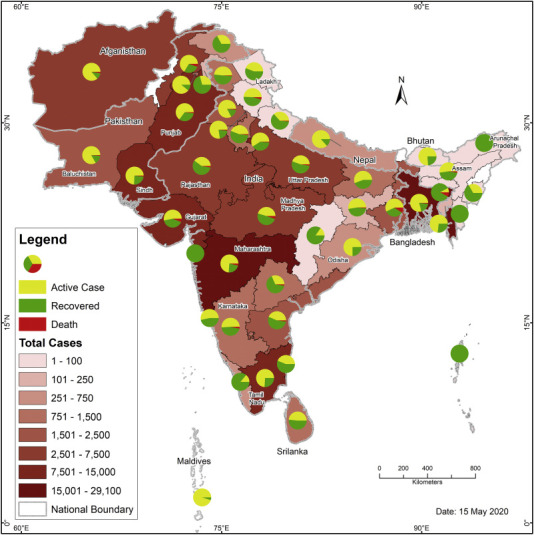
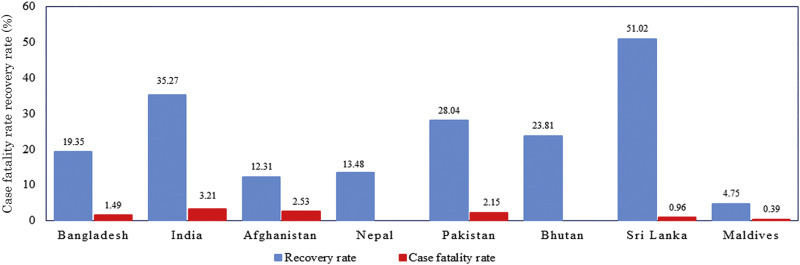
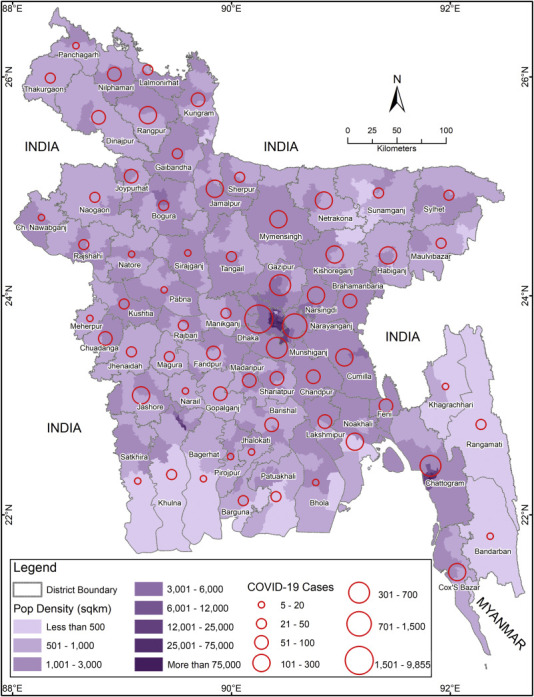
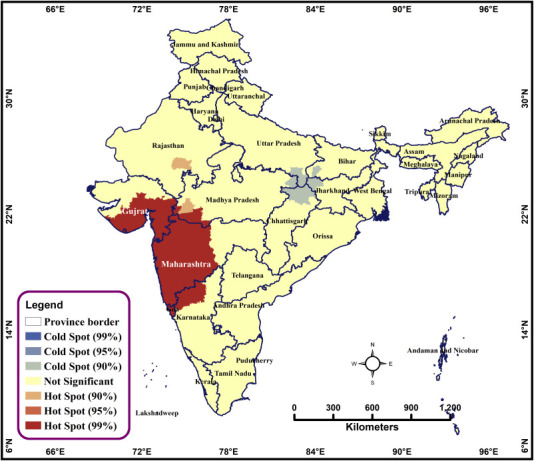
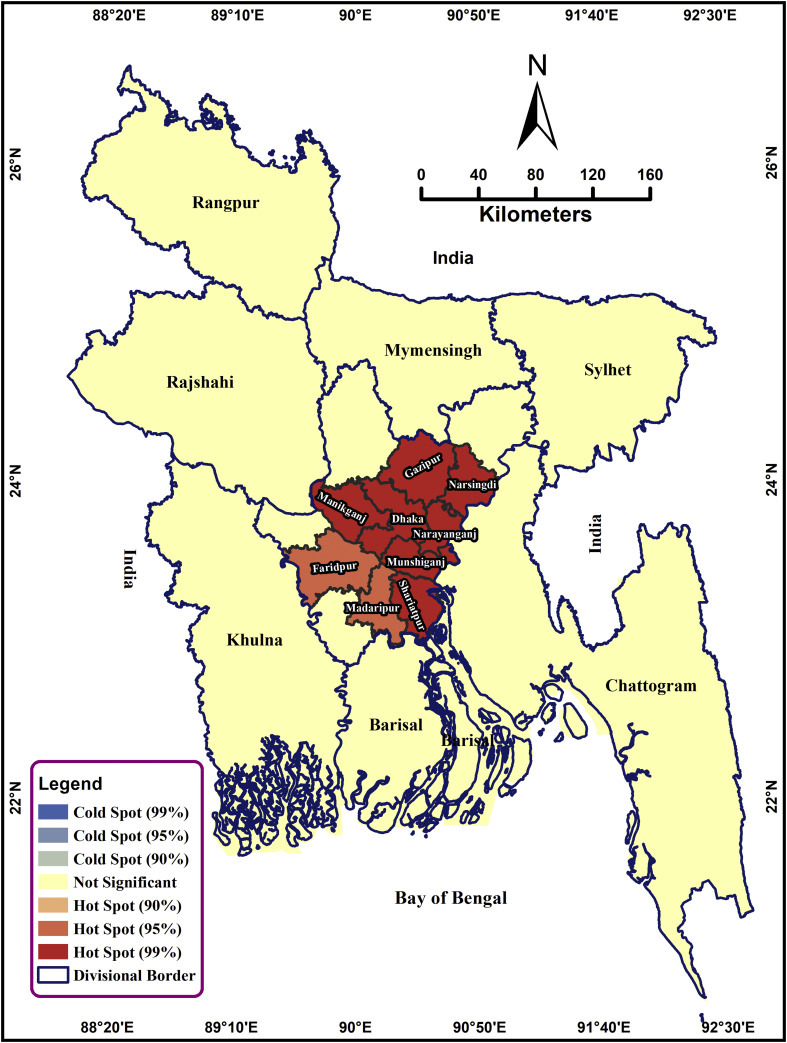
South Asian (SA) countries have been fighting with the pandemic novel coronavirus disease 2019 (COVID-19) since January 2020. Earlier, the country-specific descriptive study has been done. Nevertheless, as transboundary infection, the border sharing, shared cultural and behavioral practice, effects on the temporal and spatial distribution of COVID-19 in SA is still unveiled. Therefore, this study has been revealed the spatial hotspot along with descriptive output on different parameters of COVID-19 infection. We extracted data from the WHO and the worldometer database from the onset of the outbreak up to 15 May, 2020. Europe has the highest case fatality rate (CFR, 9.22%), whereas Oceania has the highest (91.15%) recovery rate from COVID-19. Among SA countries, India has the highest number of cases (85,790), followed by Pakistan (38,799) and Bangladesh (20,065). However, the number of tests conducted was minimum in this region in comparison with other areas. The highest CFR was recorded in India (3.21%) among SA countries, whereas Nepal and Bhutan had no death record due to COVID-19 so far. The recovery rate varies from 4.75% in the Maldives to 51.02% in Sri Lanka. In Bangladesh, community transmission has been recorded, and the highest number of cases were detected in Dhaka, followed by Narayanganj and Chattogram. We detected Dhaka and its surrounding six districts, namely Gazipur, Narsingdi, Narayanganj, Munshiganj, Manikganj, and Shariatpur, as the 99% confidence-based hotspot where Faridpur and Madaripur district as the 95% confidence-based spatial hotspots of COVID-19 in Bangladesh. However, we did not find any cold spots in Bangladesh. We identified three hotspots and three cold spots at different confidence levels in India. Findings from this study suggested the "Test, Trace, and Isolation" approach for earlier detection of infection to prevent further community transmission of COVID-19.
Keywords: Bangladesh; Case fatality rate; Community transmission; Dhaka; Risk; South Asia.
© 2021 Chinese Medical Association Publishing House. Published by Elsevier B.V.
Figures
References
-
- World Health Organization . 2020. Virtual Press Conference on COVID-19. https://www.who.int/docs/default- source/coronaviruse/transcripts/who- audio- emergencies- coronavirus- press- conference- full- and- final- 11mar2020. pdf, 2020 (accessed 18 August 2020)
-
- World Health Organization . 2020. Coronavirus disease 2019 (COVID-19): Situation report, 72. https://www.who.int/docs/default-source/coronaviruse/situation-reports/2..., 2020 (accessed 17 August 2020)
-
- World Health Organization Coronavirus disease (COVID-19) situation report – 116. 2020. https://www.who.int/docs/default-source/coronaviruse/situation-reports/2... (accessed 17 August 2020)
-
- Zhu N., Zhang D., Wang W., Li X., Yang B., Song J., Zhao X., Huang B., Shi W., Lu R., Niu P., Zhan F., Ma X., Wang D., Xu W., Wu G., Gao G.F., Tan W. A novel coronavirus from patients with pneumonia in China, 2019. N. Engl. J. Med. 2020;382(8):727–733. doi: 10.1056/nejmoa2001017. - DOI - PMC - PubMed
-
- Liu W., Zhang Q., Chen J., Xiang R., Song H., Shu S., Chen L., Liang L., Zhou J., You L., Wu P., Zhang B., Lu Y., Xia L., Huang L., Yang Y., Liu F., Semple M.G., Cowling B.J., Lan K., Sun Z., Yu H., Liu Y. Detection of Covid-19 in children in early January 2020 in Wuhan, China. N. Engl. J. Med. 2020;382(14):1370–1371. doi: 10.1056/NEJMc2003717. (accessed 17 August 2020) - DOI - PMC - PubMed
LinkOut - more resources
Full Text Sources
Other Literature Sources
