

Electrochemical multi-analyte point-of-care perspiration sensors using on-chip three-dimensional graphene electrodes
- PMID: 32989512
- PMCID: PMC7809000
- DOI: 10.1007/s00216-020-02939-4
Electrochemical multi-analyte point-of-care perspiration sensors using on-chip three-dimensional graphene electrodes
Abstract
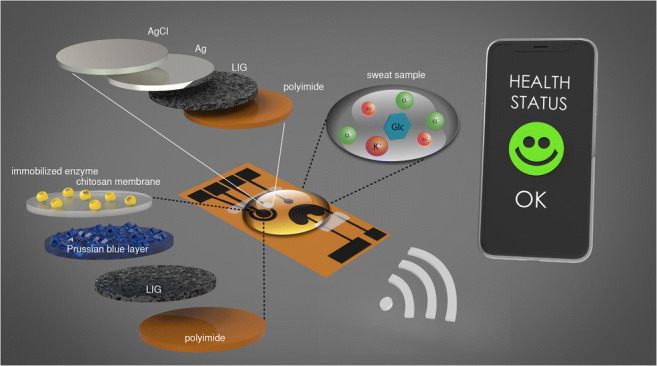
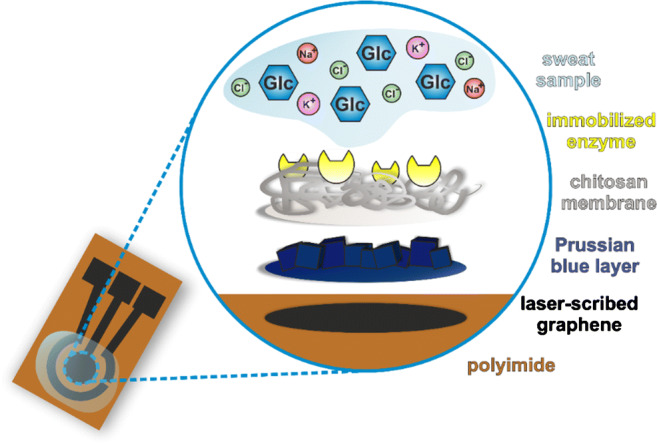
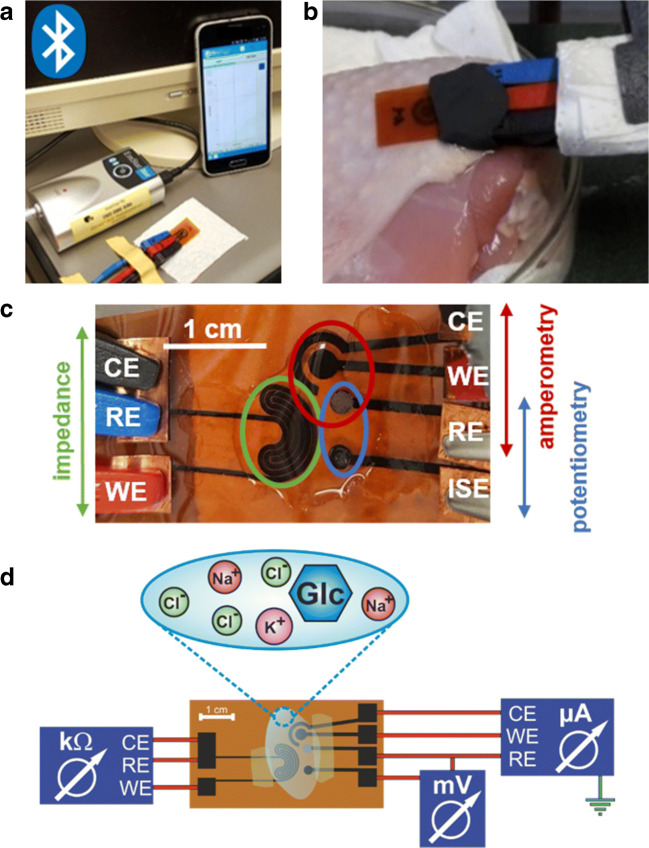
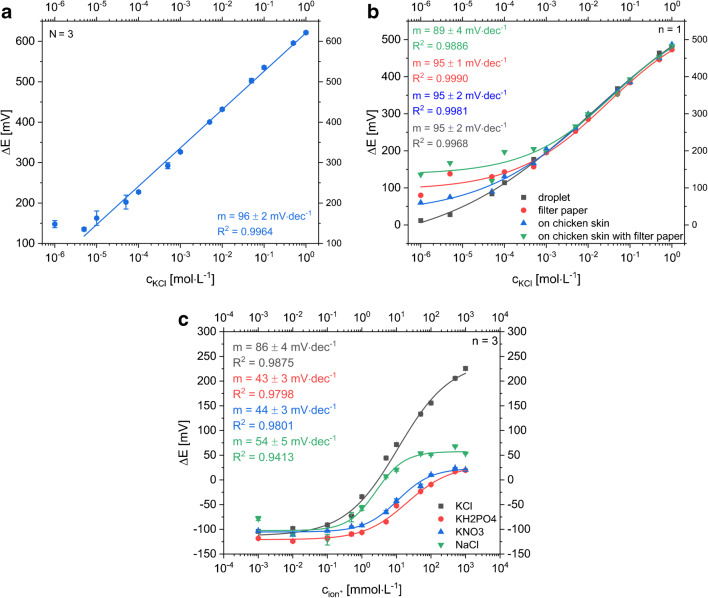
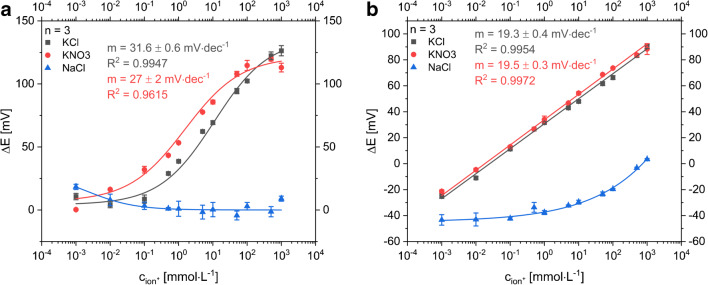
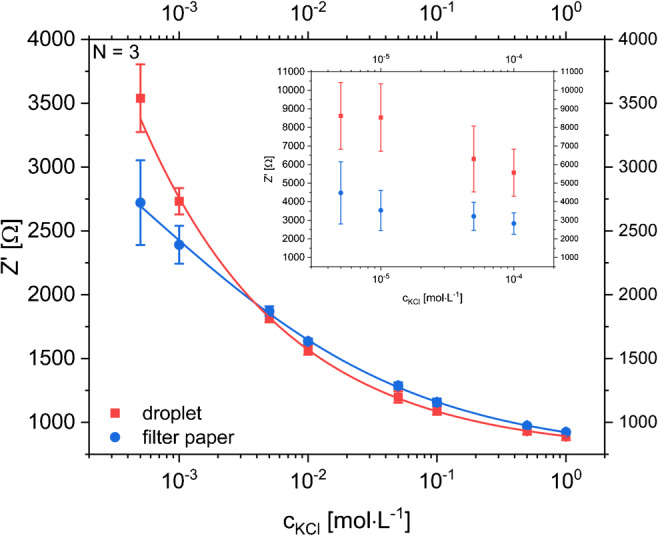
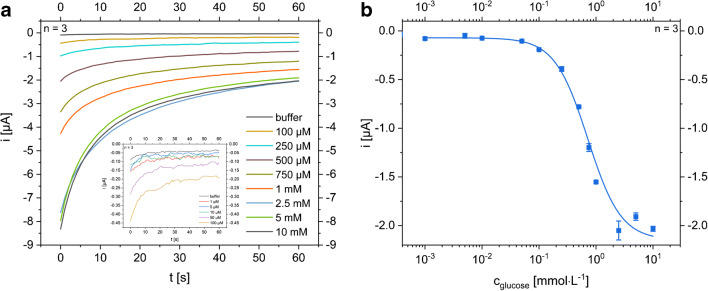
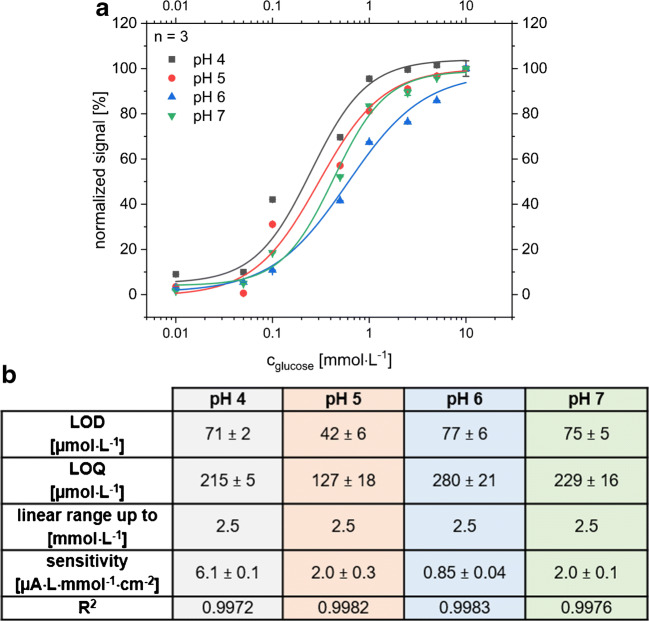
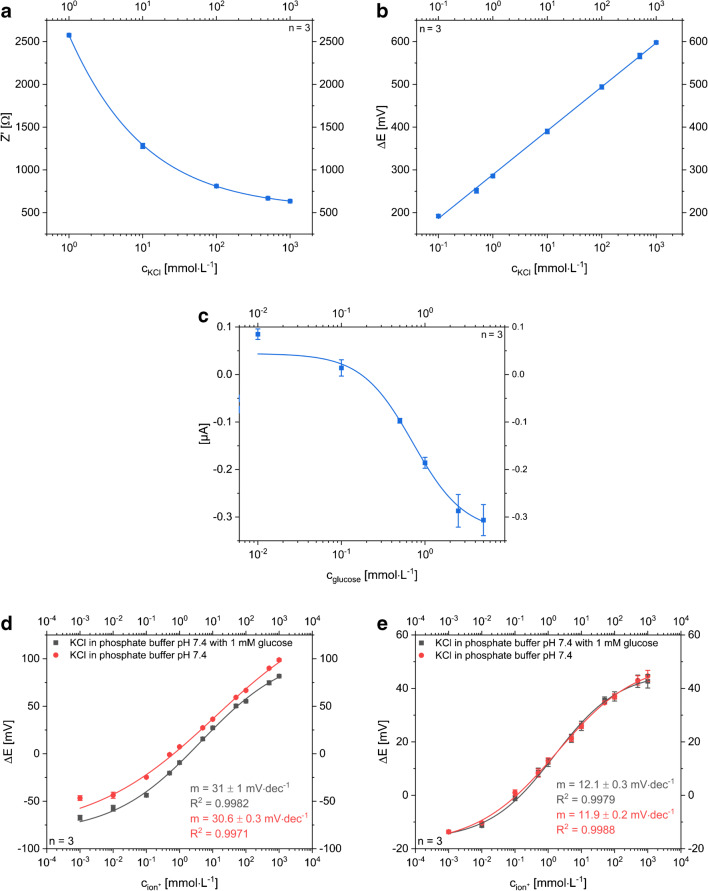
Multi-analyte sensing using exclusively laser-induced graphene (LIG)-based planar electrode systems was developed for sweat analysis. LIG provides 3D structures of graphene, can be manufactured easier than any other carbon electrode also on large scale, and in form of electrodes: hence, it is predestinated for affordable, wearable point-of-care sensors. Here, it is demonstrated that LIG facilitates all three electrochemical sensing strategies (voltammetry, potentiometry, impedance) in a multi-analyte system for sweat analysis. A potentiometric potassium-ion-selective electrode in combination with an electrodeposited Ag/AgCl reference electrode (RE) enabled the detection of potassium ions in the entire physiologically relevant range (1 to 500 mM) with a fast response time, unaffected by the presence of main interfering ions and sweat-collecting materials. A kidney-shaped interdigitated LIG electrode enabled the determination of the overall electrolyte concentration by electrochemical impedance spectroscopy at a fixed frequency. Enzyme-based strategies with amperometric detection share a common RE and were realized with Prussian blue as electron mediator and biocompatible chitosan for enzyme immobilization and protection of the electrode. Using glucose and lactate oxidases, lower limits of detection of 13.7 ± 0.5 μM for glucose and 28 ± 3 μM for lactate were obtained, respectively. The sensor showed a good performance at different pH, with sweat-collecting tissues, on a model skin system and furthermore in synthetic sweat as well as in artificial tear fluid. Response time for each analytical cycle totals 75 s, and hence allows a quasi-continuous and simultaneous monitoring of all analytes. This multi-analyte all-LIG system is therefore a practical, versatile, and most simple strategy for point-of-care applications and has the potential to outcompete standard screen-printed electrodes. Graphical abstract.
Keywords: Electrochemical biosensor; Health-monitoring platform; Laser-induced graphene (LIG); Point-of-care (POC); Sweat sensor.
Conflict of interest statement
The authors declare that they have no conflicts of interest.
Figures
Similar articles
-
Highly flexible and conductive poly (3, 4-ethylene dioxythiophene)-poly (styrene sulfonate) anchored 3-dimensional porous graphene network-based electrochemical biosensor for glucose and pH detection in human perspiration.Biosens Bioelectron. 2020 Jul 15;160:112220. doi: 10.1016/j.bios.2020.112220. Epub 2020 Apr 20. Biosens Bioelectron. 2020. PMID: 32339151
-
Laser-induced graphene electrode modified by platinum nanoparticle/zein/gelatin/glucose oxidase for non-invasive glucose sensor in multiple biofluids.Anal Chim Acta. 2025 Jun 1;1353:343974. doi: 10.1016/j.aca.2025.343974. Epub 2025 Mar 25. Anal Chim Acta. 2025. PMID: 40221209
-
Graphene Nanocomposite Ink Coated Laser Transformed Flexible Electrodes for Selective Dopamine Detection and Immunosensing.ACS Appl Bio Mater. 2024 May 20;7(5):3143-3153. doi: 10.1021/acsabm.4c00166. Epub 2024 Apr 25. ACS Appl Bio Mater. 2024. PMID: 38662615
-
Laser-induced graphene (LIG)-driven medical sensors for health monitoring and diseases diagnosis.Mikrochim Acta. 2022 Jan 10;189(2):54. doi: 10.1007/s00604-021-05157-6. Mikrochim Acta. 2022. PMID: 35001163 Free PMC article. Review.
-
Achievements and Challenges for Real-Time Sensing of Analytes in Sweat within Wearable Platforms.Acc Chem Res. 2019 Feb 19;52(2):297-306. doi: 10.1021/acs.accounts.8b00555. Epub 2019 Jan 28. Acc Chem Res. 2019. PMID: 30688433 Review.
Cited by
-
Chronoampermetric detection of enzymatic glucose sensor based on doped polyindole/MWCNT composites modified onto screen-printed carbon electrode as portable sensing device for diabetes.RSC Adv. 2022 Oct 6;12(44):28505-28518. doi: 10.1039/d2ra04947c. eCollection 2022 Oct 4. RSC Adv. 2022. PMID: 36320500 Free PMC article.
-
Portable paper-based electrochemiluminescence test incorporating lateral-flow immunosensors for detection of interferon-γ levels.Front Bioeng Biotechnol. 2023 Feb 7;11:1131840. doi: 10.3389/fbioe.2023.1131840. eCollection 2023. Front Bioeng Biotechnol. 2023. PMID: 36824352 Free PMC article.
-
Process-property correlations in laser-induced graphene electrodes for electrochemical sensing.Mikrochim Acta. 2021 Apr 7;188(5):159. doi: 10.1007/s00604-021-04792-3. Mikrochim Acta. 2021. PMID: 33829346 Free PMC article.
-
Laser-Induced Graphene (LIG) as a Smart and Sustainable Material to Restrain Pandemics and Endemics: A Perspective.ACS Omega. 2022 Feb 1;7(6):5112-5130. doi: 10.1021/acsomega.1c06093. eCollection 2022 Feb 15. ACS Omega. 2022. PMID: 35187327 Free PMC article.
-
Screen-Printed Wearable Sweat Sensor for Cost-Effective Assessment of Human Hydration Status through Potassium and Sodium Ion Detection.Micromachines (Basel). 2023 Jul 26;14(8):1497. doi: 10.3390/mi14081497. Micromachines (Basel). 2023. PMID: 37630034 Free PMC article.
References
-
- Tricoli A. Wearable and miniaturized sensor technologies for personalized and preventive medicine. Adv Funct Mater. 2017;27:1–19. doi: 10.1002/adfm.201605271. - DOI
-
- Di Sant’Agnese PA, Darling RC, Perera GA, Shea E. Abnormal electrolyte composition of sweat in cystic fibrosis of the pancreas; clinical significance and relationship to the disease. Pediatrics. 1953;12(5):549–563. - PubMed
MeSH terms
Substances
Grants and funding
LinkOut - more resources
Full Text Sources
Other Literature Sources
Medical
